|
|
|
- たみえ むらかわ
- 5 years ago
- Views:
Transcription
1
2 MRI CT
3 1 3 MRIMRS
4 MRS MRS ATP 312CT
5
6
7

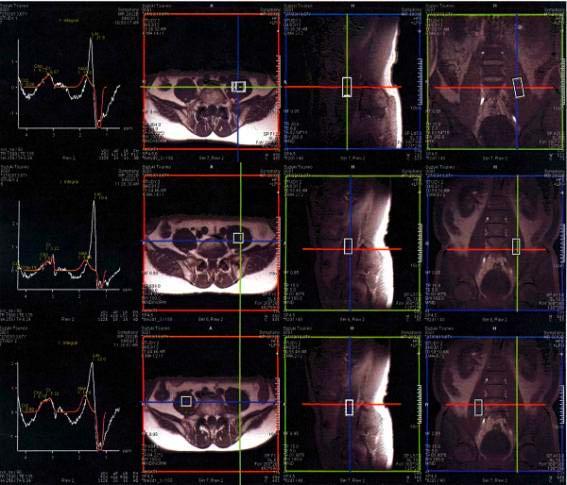
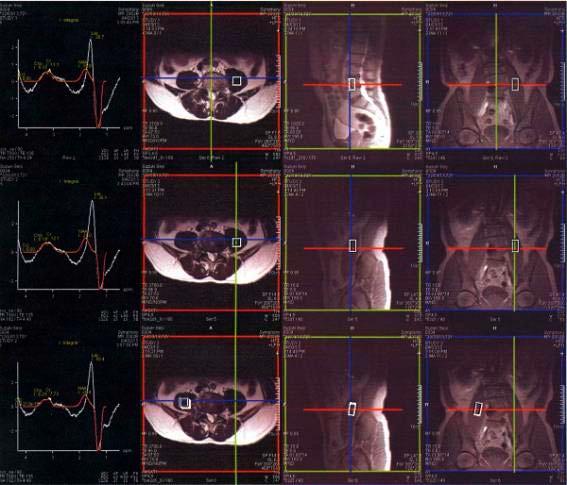
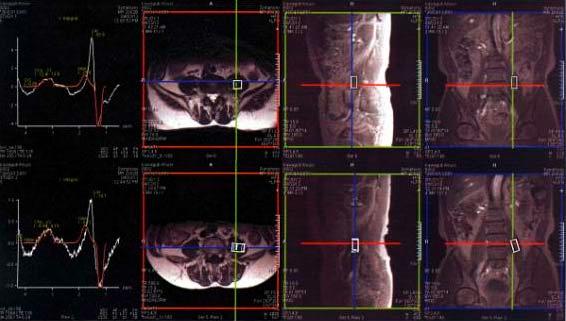
8 X CT MRS MRIMRS 1.5TMRSymphony 1 5


9 T2MRS STEP1 T2 MRS STEP2 STEP3 T2 MRS 3 10T T2 index 5 A B MRS 4 515min 6

10 T2 index T2 index T2 index
11 T2 T2 index T2 index MRS 101MRS 10 MRSATP T2 index 8 T2 index 1.6 T2 index 8
12 9
13 10
14 11
15 12
16 13
17 14
18 15
19 N19613 N CTCT12 41cm CT

20 CT % 16 3% 18 No
21 65 19 No
22
23
24 6519.0% 2.89% independent living healthy aging successful aging vitality aging, 2002 WHO1984 Davidhizar et al , ,
25 60 1,546 7 BMI 1523 n cm kg MBI kg m n n
26
27
28 8 % n n= % 1.2% % n n= % 12.9%1 % n n % 4.9% % n n % 27
29 % n n % 13.2% 1 % n n % 12.6% 1 % n n % 0.8% % n n % 0.8% 28
30 % n n % 25.3% 45.4% 3.3% 13.1% 16.4% % n n % 30.2%13.8% 14.4%1 % n n % 32.5% 16.6% 7.3%1 29
31 % n n %24.6%6 9.0%1 8 % n n % 14.6% 21.4%36.0% % n n % 14.4% 22.0%36.4% 30
32 % n n % 16.8% 23.6%40.4% % n n % 11.6%15.1% 26.7% % n n % 18.8%19.7% 38.5% % n n % 5.0%19.5% 24.5% 31
33 % n n= % 17.7%17.5% 35.2% % n n= % 24.7%23.0% 47.7% % n n= % % % 32
34 n % n= % 33.5% 21.3%26.7% 33.7%31 n % n= %1 11.3%56.1% % 36.5% 43.9% 33
35 n=428 n % n % % 24.6% 20.5%17.0%1 19.9%18.9% 15.2%13.1% 10% 34
36 1 2 % n n= % 40.3%33.7% % n n= %36.4%29.0% % n n= %34.4%29.8% 166.9% % 11.6% 35
37 % n n=248 % n n=294 % n n= %33.4%25.3% % % n n=271 36
38 % n n= % 39.0%28.2% 18.5%3.2% 78.3% 20.1%24.0%55.9% % n n 249 % n n=254 % n n= %31.9% 19.2% 37
39 % n n= % 36.9%18.5% n=428 n % n % % 42.5%35.2% 34.8%34.4%30% %19.4%18.0% 10%3 38
40 n % n= % % %
41 n=428 n % n % % 48.0%46.4%40% 33.7%31.4% 30% % 13.5%12.9%2 10% 40
42 n=428 n % n % %45.4% 42.4%40% 35.2% % 41
43 10 % n n= % 27.4% 51.2% %18.9% 25%41 % n n= % 34.9% 75.9%43 2.7%6.0%10% % n n= % 28.2% 78.3%8 1.4%5.3% 42
44 6.7% % n n= % 24.0% 50.2% 4.6%16.5%2 % n n= % 24.3% 46.3%5.2% 14.2%2 % n n= % 30.5% 61.5%6 3.7% 6.3%1 43
45 % n n= % 30.3% 60.7%62.9% 4.9% % n n= % 34.6% 67.9%32 2.8%3.9% % n n= % 34.4% 66.8%322.2% 4.0% 44
46 % n n= % 35.3% 71.3%72.2% 2.3% 45
47 % n n= % 76.8% % n n= %21.3% 46
48 % n n= % 45.2%74.5% 46.3% % n n=765 % n n= % 88.5% % n n=645 47
49 %80.3% 48
50 n % n % P % 59.7% 8.9% 19.1%
51 n % n % P % 67.9% 2.7% 8.4% 50
52 3 3. n % n % P % 64.4% 3.6% 11.3% 51
53 n % n % P % 55.1% 19.0%2 52
54 n % n % P %55.4% 18.5% 2 53
55 n % n % P %82.3% 0.4%1.3% 54
56 n % n % P %85.0% 0.4%1.0% 55
57 n % n % P
58 24.4% 15.5%28.7% 21.7%53.1% 37.2% 2.0%4.9%10.2% 17.7% n % n % P
59 38.3%44.3% 33.6% 27.8% n % n % P
60 48.6% 26.9%15.5% 38.6%17.6% n % n % P
61 144.9% 32.1% 23.2%32.6% 6.8%10.8%1 n % n % P
62 45.7%47.9% 19.9%9.5% 24.7%17.9% n % n % P
63 44.0%45.6% 19.0%10.2% 25.7%19.2% n % n % P
64 39.3%45.6% 21.7%12.5% 28.9%17.2% n % n % P
65 43.6%44.3% 17.5%6.1% 20.9%9.0% n % n % P
66 38.1%48.2% 27.8%10.4% 25.2%13.0% n % n % P
67 49.0%51.3% 5.5%4.7% 17.9%20.6% n % n % ns 66
68 49.5%56.7% 24.1%11.9% 18.6%16.2% n % n % P
69 39.0%54.8% 31.0%17.8% 26.0%20.1% n % n % P
70 57.5% 45.7% %19.1% n % n % P
71 48.2%7.1% 35.4%17.0% 11.4%9.5%35.6% 31.0%23.8% 20.3% 20.4%48.5% p<
72 %15.5% 2.7% 8.9% 12.8%24.8% 71
73 n % n % P %29.3% 1.0% 4.8%3.4% 9.0% 72
74 n % n % P
75 62.7%37.6% 1.9%8.9% n % n % P
76 37.6%14.5% 2.5%7.2% 10.6%24.5% n % n % P
77 30.6%11.5% 1.8%9.5% 8.6%21.2% n % n % P
78 38.6%23.7% n % n % P
79 41.4%18.8% 3.3% 2.5%3.1%8.1% n % n % P
80 44.4%22.6%2 3.2% 2.3%1.6% 6.9% n % n % P
81 40.6%24.6% 2.4%1.3% 2.8%5.8% n % n % P
82 45.6%26.3% 2.3%1.3% 0.7%4.6% n % n % P
83 12.6%8.2% 73.6%78.0% n % n % P
84 64.7%65.0% 18.7%24.7% n % n % P
85 21.9%39.9% 48.6% 45.6%46.5% n % n % P
86 n % n % n s 85
87 47.2% 44.9% 87.9% 89.5% n % n % n s 86
88 n % n % n s 87
89
90 p< p< p< p< p< p< p< p<
91 P<
92 Bonferoni 3 91
93
94 p< p< p< p< p< ns p< p<
95 8 Promax
96 p < P <
97 Bonferoni Bonferoni
98
99
100 p< p< p< p< p< p< p< p< p< p<
101 10 Promax P < P <
102
103 Bonferoni Bonferoni
104 ** 0.33** 0.24** -0.27** ** 0.78** 0.33** -0.25** ** 0.75** 0.37** -0.26** ** 0.32** 0.34** -0.25** ** -0.27** -0.23** -0.37** **P<
105
106 Promax
107
108 P < ns P < ns 107
109 P < P < P < P < P < P < P <
110 65.9%42.6% 39.8% 25.2% 42.0%38.6% 42.6% n % n % ns ns ns ns P < ns P < ns ns ns 109
111 % %5 55.6% 5 5 n % % %
112 % 29.8% 17.4% 23.2% 25.9%18.2% 4.3%13.5% 13.5%23.8% 2 111
113 n % n % ns ns ns ns ns ns P < P < ns P < P < P < ns ns ns 112
114 Odds % Odds % Odds % Odds % Odds %
115 Odds 95% * * * * * *P<
116 6 32.8% 40.4% 42.5%50.8% 39.9%47.8% n % n % ns P < P < P < ns ns ns P < P < P < ns ns 115
117 Odds % Odds % Odds % Odds % Odds % Odds %
118 Odds 95% * * * * * * *P<
119
120 ,
121 120
122
123 122
124 Davidhizar R, Eshleman J, Moody M 2002 Health promotion for aging adults. Geriatric Nursing, , , QoL,. 123
125 124
126 125
127 126
128 127
129 128
130 129
131 130
132 131
133 132
134 133
135 134
136 135
137 136

untitled
 1 2 3 4 5 6 7 cm kg 8 9 10 11 12 13 14 15 T A S H A A M.. N.. A.. B.. I 16 17 18 C 19 20 holding 21 22 23 24 STEP1 STEP2 STEP3 STEP4 STEP5 25 26 27 28 29 30 31 32 33 34 35 36 37 38 39 40 41 42 43 44 45


 6 12 10661 93100 227213202 222208197 85kg cm 20 64.521 106856142 2 1 4 3 9767 100 35 cm 7747 208198 90kg 23 5828 10661 93100 cm 227213202 10639 61 64.521 85kg 78kg 70kg 61 100 197204.5 cm 15 61
<82D282A982C1746F95F18D908F57967B95B E696E6464>
 1 2 (90cm 70cm 2015) 3 (68cm 28cm 30cm 12kg 2015) (77.5 109.5cm 2015) 4 (22cm 50cm 50cm 4.6kg 2015) (45cm 62.5cm 2015) (47.4cm 62.5cm 2014) 5 (28.5cm 23.5cm) (45cm 62cm 2015) (97cm 107cm 2015) 6 7 8 9

180 140 22
 21 180 140 22 23 25 50 1 3 350 140 500cm 600 140 24 25 26 27 28 29 30 31 1/12 8.3 1/15 6.7 10 1/8 12.5 1/20 140 90 75 150 60 150 10 30 15 35 2,000 30 32 1 1 1 2 1 3 1 4 1 5 1 6 1 7 1 8 1 9 % 100 50 33.3
8 8 0
 ,07,,08, 8 8 0 7 8 7 8 0 0 km 7 80. 78. 00 0 8 70 8 0 8 0 8 7 8 0 0 7 0 0 7 8 0 00 0 0 7 8 7 0 0 8 0 8 7 7 7 0 j 8 80 j 7 8 8 0 0 0 8 8 8 7 0 7 7 0 8 7 7 8 7 7 80 77 7 0 0 0 7 7 0 0 0 7 0 7 8 0 8 8 7


 001 No.3/12 1 1 2 3 4 5 6 4 8 13 27 33 39 001 No.3/12 4 001 No.3/12 5 001 No.3/12 6 001 No.3/12 7 001 8 No.3/12 001 No.3/12 9 001 10 No.3/12 001 No.3/12 11 Index 1 2 3 14 18 21 001 No.3/12 14 001 No.3/12
2016.05月号cs5.indd
 5 2016.5.1 2 3 2016.5.1 2016.5.1 4 5 2016.5.1 2016.5.1 6 2016.5.1 7 2016.5.1 8 2016.5.1 9 2016.5.1 10 11 2016.5.1 2016.5.1 12 2016.5.1 13 Healthy 2016.5.1 14 2016.5.1 15 Healthy 2016.5.1 16 2016.5.1 17
.jtd")
.jtd")

1
 1 2 3 4 5 6 7 8 9 0 1 2 6 3 1 2 3 4 5 6 7 8 9 0 5 4 STEP 02 STEP 01 STEP 03 STEP 04 1F 1F 2F 2F 2F 1F 1 2 3 4 5 http://smarthouse-center.org/sdk/ http://smarthouse-center.org/inquiries/ http://sh-center.org/


P072-076.indd
 3 STEP0 STEP1 STEP2 STEP3 STEP4 072 3STEP4 STEP3 STEP2 STEP1 STEP0 073 3 STEP0 STEP1 STEP2 STEP3 STEP4 074 3STEP4 STEP3 STEP2 STEP1 STEP0 075 3 STEP0 STEP1 STEP2 STEP3 STEP4 076 3STEP4 STEP3 STEP2 STEP1
 STEP1 STEP3 STEP2 STEP4 STEP6 STEP5 STEP7 10,000,000 2,060 38 0 0 0 1978 4 1 2015 9 30 15,000,000 2,060 38 0 0 0 197941 2016930 10,000,000 2,060 38 0 0 0 197941 2016930 3 000 000 0 0 0 600 15


証券協会_p56
 INDEX P.02-19 P.20-31 P.32-34 1 STEP1 STEP2 STEP3 STEP4 P.03-06 P.07-10 P.11-12 P.11-14 P.15-16 P.15-18 P.19 202 STEP 1 3 4 5 10 25 200 30 1,000 2,500 20 30 40 50 60 5 1 80.4 356.7 66.3 461.7 452.7 802.7

医療レーザー脱毛の威力と限界
 .... mm. CT WH W H W H W H... kcalkcal. 1. cal kcal 1 6 2 3. 4. 5. 1 6 6. B6 B12 B. BMI BMI30 C. D. kg mm . CT WH W H W H W H... kcalkcal . 1. cal kcal 1 6 2 3. 4. 5. 1 6 6. B6 B12 B. BMI BMI30 C. D.


家庭系パソコンの回収再資源化にかかる論点
 1 134 1212 134 2 1 137 1212 (1) 12 12,102 40.2 4,865 2-1 12 21,497 2-2 50.1 2-3 1 kg 2 12 2-1 13 12% 2-1 (2) 2-2 4 4 7 2-3 4 (3) 13.8 2-4 46 10 80 3 3 4 3 2-5, 2-6 13 9 2-7 18 2 2 8 5,000 30 25% 25 2 2
2
 1 2 3 4 5 6 7 8 9 10 11 12 13 14 10mSv 15 16 17 4.46 4.5 4.0 3.5 3.0 2.5 2.0 1.5 1.0 3.8 2.07 2.91 1.37 2.3 1.31 1.84 1.56 1.2 1.33 2.03 0.5 1000 4000mSv 1000 4000mSv Preston et al. Radiat Res 168: 1 64,
NIHSS score p NIHSS score p149 4 p g ml 0.8 g ml D 1 D NIH NIHSS 14 D 0.8 g ml
 NIHSS score14 1 400 1 p149 1 25 20 NIHSS score14 15 10 5 2 p149 4 p151 0 0.8 g ml 0.8 g ml D 1 D NIH NIHSS 14 D 0.8 g ml 1 2 148 149 3 2 3 A B C 4 D 2 A B C A C 1 Ogata T et al J Neurol Sci 272 83 86 2008
 9 10 14 5 15 4 19 11 21 4 23 3 2012 24 11 24 5 24 6 27 2 447 52 395 27 2 1 2 3 4 5 6 7 8 9 10 11 12 (1) (2) (3) (4) 13 14 15 16 17 18 () 19 20 21 22 23 24 25 26 27 28 29 30 31 32 33 34 35 36 37 38 39 40

16 41 17 22 12 10
 1914 11 1897 99 16 41 17 22 12 10 11 10 18 11 2618 12 22 28 15 1912 13 191516 2,930 1914 5,100 43 1.25 11 14 25 34364511 7.54 191420 434849 72 191536 1739 17 1918 1915 60 1913 70 10 10 10 99.5 1898 19034.17.6

製品案内 価格表 2014/4/1
 4 (17) 3 43 5/20370/ 231(504,150) 11 12 10 14-16 10 3 100 17 100kg 5-6 3 13 3 18 18 # # # # #$$ %&$ ' ()* +,-% ' #). +,-%'% / ' # # #$ %&&&'( %)* +'(#$ #$ %&&&'( ++,-). +'(#$ #$ /'( + /0)- +'(#$ %&&&'(
3.ごみの減量方法.PDF
 - 7 - - 8 - - 9 - - 10 - - 11 - - 12 - ( 100 ( 100 - 13-123,550,846 111,195,762 92,663,135 ( 12 25 37 49.2 16 33 49 65.6 15 30 44 59.0 2.5kg) ( 5kg) ( 7.5kg) ( k ( 123,550,846 111,195,762 92,663,135 (


untitled
 21 14 487 2,322 2 7 48 4 15 ( 27) 14 3(1867) 3 () 1 2 3 ( 901923 ) 5 (1536) 3 4 5 6 7 8 ( ) () () 9 10 21 11 12 13 14 16 17 18 20 1 19 20 21 22 23 21 22 24 25 26 27 28 22 5 29 30cm 7.5m 1865 3 1820 5
1948 1907 4024 1925 14 19281929 30 111931 4 3 15 4 16 3 15 4 161933 813 1935 12 17 11 17 1938 1945 2010 14 221 1945 10 1946 11 1947 1048 1947 1949 24
 15 4 16 1988 63 28 19314 29 3 15 4 16 19283 15294 16 1930 113132 3 15 4 16 33 13 35 12 3 15 4 16 1945 10 10 10 10 40 1948 1907 4024 1925 14 19281929 30 111931 4 3 15 4 16 3 15 4 161933 813 1935 12 17 11
裁定審議会における裁定の概要 (平成23年度)
") 23 23 23 4 24 3 10 11 12 13 14 () 1 23 7 21 23 12 14 (19 ) 30 1.876% 60 8 24 19 78 27 1 (10) 37 (3) 2 22 9 21 23 5 9 21 12 1 22 2 27 89 10 11 6 A B 3 21 12 1 12 10 10 12 5 1 9 1 2 61 ( 21 10 1 11 30 )
23 23 23 4 24 3 10 11 12 13 14 () 1 23 7 21 23 12 14 (19 ) 30 1.876% 60 8 24 19 78 27 1 (10) 37 (3) 2 22 9 21 23 5 9 21 12 1 22 2 27 89 10 11 6 A B 3 21 12 1 12 10 10 12 5 1 9 1 2 61 ( 21 10 1 11 30 )
<91E6825289F1938C966B95FA8ECB90FC88E397C38B5A8F708A778F7091E589EF8EC08D7388CF88F5837D836A83858341838B566572312E696E6464>

Microsoft Word - 入居のしおり.doc
 1 1 2 2 2 3 2 4 3 5 3 6 3 7 3 8 4 1 7 2 7 3 7 4 8 5 9 6 9 7 10 8 10 9 11 10 11 11 11 12 12 13 13 1 14 2 17 3 18 4 19 5 20 6 22 (1) 24 (2) 24 (3) 24 (4) 24 (5) 24 (6) 25 (7) 25 (8) 25 (9) 25 1 29 (1) 29

和県監査H15港湾.PDF
 ...1...1...1...1...1...1...1...1...2...2...2...3...3...3...5...5...10...11...12...13...13...13...14...14...14...14...14...14...15...15...15...15...15 ...16...17 14...17...18...18...19...21...23 2...25...27...27...28...28...28

-26-
 -25- -26- -27- -28- -29- -30- -31- -32- -33- -34- -35- -36- -37- -38- cm -39- -40- 1 2 3 4 4 3 2 1 5 5-41- -42- -43- -44- -45- -46- -47- -48- -49- -50- cm -51- -52- -53- -54- -55- -56- -57- -58- -59- -60-


河川砂防技術基準・基本計画編.PDF
 4 1 1 1 1 1 2 1 2.1 1 2.2 2 2.3 2 2.4 2 3 2 4 3 2 4 1 4 1.1 4 1.2 4 2 4 2.1 4 2.2 4 2.3 5 2.4 5 2.5 5 2.5.1 5 2.5.2 5 2.6 5 2.6.1 5 2.6.2 5 2.6.3 5 2.6.4 5 2.6.5 6 2.7 6 2.7.1 6 2.7.2 6 2.7.3 6 2.7.4
4 100g
 100g 10 20 30 40 50 60 70 80 4 5 7 9 12 15 19 24 60 100 10 80 100 20 10 5 20 195 20-1- 60 60 15 100 60 100 15 15 15 100 15 15 60 100 10 60 100 100 15 10 10 60 100 15 10 15 10 5-2- 80 80 24 100 80 100 24
180 30 30 180 180 181 (3)(4) (3)(4)(2) 60 180 (1) (2) 20 (3)
(4) (3)(4)(2) 60 180 (1) (2) 20 (3)") 12 12 72 (1) (2) (3) 12 (1) (2) (3) (1) (2) (1) (2) (3) (4) (5) (6) (7) (8) (9) (10) (11) (1) (2) 180 30 30 180 180 181 (3)(4) (3)(4)(2) 60 180 (1) (2) 20 (3) 30 16 (1) 31 (2) 31 (3) (1) (2) (3) (4) 30
12 12 72 (1) (2) (3) 12 (1) (2) (3) (1) (2) (1) (2) (3) (4) (5) (6) (7) (8) (9) (10) (11) (1) (2) 180 30 30 180 180 181 (3)(4) (3)(4)(2) 60 180 (1) (2) 20 (3) 30 16 (1) 31 (2) 31 (3) (1) (2) (3) (4) 30
 ... 6 1) 2) No. 01 02 03 04 05 06 07 08 09 10 11 12 No. 1 2 2 3 3cm 4
 untitled
 1....1 2....2 2.1...2 2.2...2 3....14 3.1...14 3.2...14 4....15 4.1...15 4.2...18 4.3...21 4.4...23 4.5...26 5....27 5.1...27 5.2...35 5.3...54 5.4...64 5.5...75 6....79 6.1...79 6.2...85 6.3...94 6.4...
 113 120cm 1120cm 3 10cm 900 500+240 10 1 2 3 5 4 5 3 8 6 3 8 6 7 6 8 4 4 4 4 23 23 5 5 7


( )
") ( ) () () 3 cm cm cm cm cm cm 1000 1500 50 500 1000 1000 1500 1000 10 50 300 1000 2000 1000 1500 50 10 1000 2000 300 50 1000 2000 1000 1500 50 10 1000 2000 300 30 10 300 1000 2000 1000 1500 1000
( ) () () 3 cm cm cm cm cm cm 1000 1500 50 500 1000 1000 1500 1000 10 50 300 1000 2000 1000 1500 50 10 1000 2000 300 50 1000 2000 1000 1500 50 10 1000 2000 300 30 10 300 1000 2000 1000 1500 1000

 2002 (1) (2) (3) (4) (5) (1) (2) (3) (4) (5) (1) (2) (3) (4) (5) (6) (7) (8) (1) (2) (3) (4) (1) (2) (3) (4) (5) (6) (7) (8) No 2,500 3 200 200 200 200 200 50 200 No, 3 1 2 00 No 2,500 200 7 2,000 7

 -1- 4 1 2 4-2- -- 2 2 cm 0 80cm 2 80cm 80cm 80cm 50cm 80cm 50cm 6 80cm 100 50 50 cm 10 6 4 50cm 4 4 50cm -4- -5- cm 50cm 4 4 4 50cm 50cm 4 80cm 50cm 80cm 50cm 6 cm -6- 20 250cm 1 2 1 4 0cm 60cm cm cm 1
untitled
 () () () () () ( ) () ( ) () ( ) () 2 () () 2 () () ( ) () () () 2 () () 2 3 ( ) () ( ) 2 3 4 () () 2 3 4 () () ( )( ) ( ) 2 ( ) 3 () () 2 3 () () 2 3 () () () () () () () () (( ) ( ) (( ))( )( ) ) 2 3
 28 6 15 14 40 15 40 2 Personalized Agingusing genomics and technology to optimize healthy aging implications for oral health X7003 9001 6 16 11 00 12 00 2 X0077 9002 1 6 15 9 00 10 00 2 X0039 9003 2 6

[] 1
![[] 1](/thumbs/42/22960844.jpg "[] 1") 0 [] 1 [] 2 [] 2010 22 0% 20% 40% 60% 80% 100% 15.4 65.2 10.8 8.6 12,000 2010 22 2020 32 2030 42 2040 52 2015 27 14.3 63.3 12.3 10.1 10,000 2020 32 13.2 63.0 11.9 11.9 8,000 2025 37 12.3 62.9 10.6 14.2
0 [] 1 [] 2 [] 2010 22 0% 20% 40% 60% 80% 100% 15.4 65.2 10.8 8.6 12,000 2010 22 2020 32 2030 42 2040 52 2015 27 14.3 63.3 12.3 10.1 10,000 2020 32 13.2 63.0 11.9 11.9 8,000 2025 37 12.3 62.9 10.6 14.2

緑化計画作成の手引き 26年4月版
 http://www.city.shibuya.tokyo.jp/env/en_eventact/midori_ryokka.html 10 11 12 13 14 15 16 17 18 19 P10 P10 1 P12 2635 Fax (1) 47 03-5388-3554 http://www2.kankyo.metro.tokyo.jp/sizen/sinseisyo/e2/tebiki.htm


BAANs理論に基づく保健指導プログラム暫定版
 WHO 4 5 10% L- -3 RNA L - 1960-3 RNA mrna Bio Activating Advanced Nutrients BAANs BAANs BAANs BAANs L- (NO) -3 EPA, DHA) RNA RNA DNA TNF- PAI-1 ( ) BAANs 40 50% 20% 1Kg 7,000Kcal 50Kcal 11 50Kcal
untitled
 1 2 3 4 5 6 7 48.4 7 1 2 1210 2.5 10 15 37.5 6 8 2.5 10 3 25 19 2.5 15 3 55 37.5 4.5 10 5 25 19 4.5 15 5 55 19 4.5 15 5 92 37.5 1 4 550 3 2500 3 3 3 50 10 15 15 19 19 37.5 5 8 15 b 10 15 19 37.5
プラズマ・核融合学会
 1. Philosophy of Radiological Protection and Radiation Hazard Protection Law 1) Oita University of Nursing and Health Sciences, Oita, OITA 870-1201, Japan 2) National Institute for Fusion Science, Toki,
BMI BMI
 () () 2 QOL () () QOL 11 6 14 20 13.9 20 BMI 12 70 40 11 6 14 20 13.9 20 BMI 12 70 40 57.1 100 ) 1 100 1 250 11 11 430 315 73.3 494 247 50.0 322 60 18.6 12 70 62 88.6 100 18 57.1 1 100 1 250 430 315 73.3
104 100 60 9,195,336 409 0.004 24 8 31 9,025,983 568 0.006 2012 8 31 6,634,686 956 ( 0.014 ) 2 2011 8 26
 2 2011 8 26") 25 25 3 5 MMR 1 104 100 60 9,195,336 409 0.004 24 8 31 9,025,983 568 0.006 2012 8 31 6,634,686 956 ( 0.014 ) 2 2011 8 26 2012 8 31 1,032,660 132 ( 0.013 ) 3 2010 6 11 3 11 15.4 1 1 ( ) 12 2 2 3 ER ) (
25 25 3 5 MMR 1 104 100 60 9,195,336 409 0.004 24 8 31 9,025,983 568 0.006 2012 8 31 6,634,686 956 ( 0.014 ) 2 2011 8 26 2012 8 31 1,032,660 132 ( 0.013 ) 3 2010 6 11 3 11 15.4 1 1 ( ) 12 2 2 3 ER ) (
07.報文_及川ら-二校目.indd
 8 01 01 4 4 1 5 16 18 6 006 H 18 4 011 H 6 4 1 5 1 5 007 H 19 5 009 1 5 006 007 009 011 9 10 4 000 H 1 4 5 004 H 16 4 004 009 H 1 5 4 4 5 1 4 006 011 1 1 4m 5m 10m 007 1 7 009 009 1 5 10 1 000kg 10a 006
Index P 0 2 P 0 3 P 0 9 P 1 1 P 1 3 P
 www.rakuten-bank.co.jp/home-loan Index P 0 2 P 0 3 P 0 9 P 1 1 P 1 3 P 1 7 01 02 P04 P05 P06 1 2 3 03 0 4 1 1 2 3 2 3,000 2,700 3,000 300 0 05 0 6 1 1 2 2 3 07 0 8 S T E P1 1. 2. 3. S T E P1 S T EP2 1.
明浄創立10周年記念号/6.佐伯
 10 6 1 21 2 5 7 35 1 S 1 1 90 19 475 60 402 18 82 69.2 71.6 68.8 2 2008 5 7 30 10 1 13 WHO 6 4 4 1, 3, 6, 10 2, 9, 124, 5, 78, 11, 13 1 1 2 3 4 5 6 7 8 9 10 11 12 13 1 1 2 2 3 3 4 4 3 4 1 4 4 2 10 10 3
20●12頁●6-14▲放射線科▲.ppt
 No.268 Katayama H. et al. Adverse reactions to ionic and nonionic contrast media-a report from the Japanese Committee of the Safety of Contrast Media. Radiology 1990;175:621-628. 12.66% 3.13% 0.22% 0.04%


日本目録規則1987年版改訂2版第2章図書改定案
 2.0.1 2.0.2 2.0.3 2.0.4 2.0.5 2.0.6 2.1.1 2.1.2 2.1.3 2.1.4 2.1.5 2.2.1 2.2.2 2.2.3 2.2.4 2.4.1 2.4.2 2.4.3 2.4.4 2.5.1 2.5.2 2.5.3 2.5.4 2.6.1 2.6.2 2.6.3 2.6.4 2.6.5 ISSN 2.6.6 2.6.7 2.7.1 2.7.2 2.7.3

untitled
 CONTENTS P.3 P.5 P.7 P.13 P.21 P.31 P.33 P.3 P.3 P.3 1 2 3 4 4 1 5 6 2 7 8 2 2 9 10 2 2 1000 800 600 400 200 0 3 4 5 11 12 13 14 15 16 17 18 25 1 8 15 22 29 1 18 25 1 6 17 6 8 11 12 3 13 14 15 16 3 311

