年 3 月期
|
|
|
- しょうすけ かいじ
- 5 years ago
- Views:
Transcription


1 年 3 月期


 Mori Building Co., Ltd.")
2 1 巻頭特集 6 6 年間の主要財務指標 8 株主の皆様へ 12 特集グローバルサプライチェーン構築の取り組み モダニゼーション事業の状況 16 営業概況 25 CSR 28 コーポレート ガバナンス 3 取締役 監査役 執行役員 32 財務セクション 33 財政状態および経営成績の検討と分析 36 連結貸借対照表 38 連結損益計算書 39 連結包括利益計算書 4 連結株主資本等変動計算書 41 連結キャッシュ フロー計算書 42 連結財務諸表注記 63 独立監査人の監査報告書 ( 訳文 ) 64 グローバルネットワーク 66 株主情報 67 会社情報 Forum 66( 中国 ) Mori Building Co., Ltd. 虎ノ門ヒルズ ( 日本 ) ニューヨーク タイムズ タワー ( 米国 )


3 Fujitec Annual Report 214 1


4 2 214 * Mori Building Co., Ltd. 2 Fujitec Annual Report 214


5 8 214 * 2 25 * Before After Fujitec Annual Report 214 3
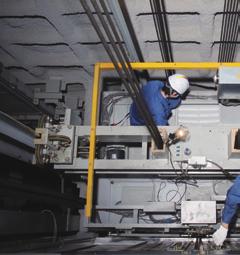
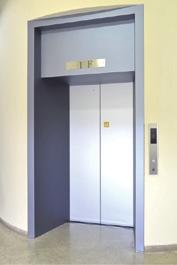
6 Grow Together! Yes, Fujitec Can phase Fujitec Annual Report 214
7 phase , 214 phase2 phase , ISO Fujitec Annual Report 214 5
8 ,54 117, ,338 49, ,716 67, ,871 9, ,664 5, ,45 12, ,976 1, ,867 1, ,237 2, ,7 1, , , ,51 78, ,294 7, (2,655) (232) (3,823) (3,48) ,93 15, % 58.6% ROE % 8.2% ,692 37, ,189 71, Fujitec Shanghai Sourcing Center Co., Ltd. (China) Fujitec Holdings Sdn. Bhd. (Malaysia) Fujitec Vietnam Co., Ltd. Fujitec, Inc. (Philippines) ,5 TOPIX 1, 5 29/ / / Fujitec Annual Report 214
9 ,61 12,53 16,137 17,69 $1,427,79 47,948 48,569 48,67 45, ,389 57,113 53,484 58,7 61, ,32 5,363 5,221 5,288 2, ,961 2,67 7,569 4,61 (649) 74,48 2,26 4, ,835 1,971 1,841 1,882 2,8 19,184 1,354 1,665 6,564 2,733 18,126 2,24 2,254 2,365 2,6 21,718 1,338 2,914 5,425 2,313 19,485 17,213 14, ,99 1,823 $1,497,718 67,915 67,161 64,56 59,81 97,776 9,685 9,157 6,71 8,431 $ 9,233 (3,952) (2,63) (6,38) (14,185) (25,777) (4,179) (5,672) (3,143) (782) (37,116) 9,718 8,224 7,84 9,389 22, (6.94) $ % 59.9% 53.6% 54.9 % 4.1% 12.4% 7.1% (1.1)% 34,391 35,525 37,221 41,129 $ 395,68 63,65 65,188 62,235 7,954 1,1, Fujitec (Thailand) Co., Ltd ,5 1, / / /1 3 Fujitec Annual Report 214 7


10 14.7% %1, %1, Grow Together Yes, Fujitec Can1 25.2%1, % % % 117, , ,85 58, ,663 88, ,172 12, ,57 7, Fujitec Annual Report 214
11 %1,6 1.%13 16, 14, 12, 1, 8, 6, Grow Together! Yes, Fujitec Can 1 1,371, ,68%1,758.6% 4, 2, 2, 14, 12, 1, 8, 6, 4, 2, , % 58, 4, , 6, , , 2, ,8 13, ,8 2 16, 12, % 65, 5, , 8, , , 2, ,9 15, , , 15, 8.6 Fujitec Annual Report 214 9


12 Fujitec Annual Report 214
13 中期経営計画 ,364 88, 62,47 65, , 147, ,24 17, 14,166 16, Fujitec Annual Report

14 m Fujitec Annual Report 214

15 Grow Together! Yes, Fujitec Can 5% 7% % % 7% 7% , % 4 15, , 5, 147,54 15,61 117,468 12, Fujitec Annual Report


16 in in % 14 Fujitec Annual Report 214


17 in JR Before JR in 7 in After in % Fujitec Annual Report
18 ,47 18.% 4,65 1, , % 6,67 2, , , ,24 23.% 1, , * 14, % * * 7 2 * * % * 5 12 * 4 2 * Fujitec Annual Report 214
19 % % 8, 5, % 6, 4, 2, 4, 3, 2, 1, , 7, % 6, 4, 2, 5, 2, , 2, 2 8.9% 1, 5, ,5 1, , 2, 2 9.6% 15, 1, 5, 1, 1 * , * 1.4% 1, * * Fujitec Annual Report
20 22 LED P 3 in JR S 8, 6, 4, 2, 51,283 52,43 5,817 52,865 62, Fujitec Annual Report 214


21 Mori Building Co., Ltd ,896 4, % 5, 4, 3, 2, 1, 13 1,579 1,898 3,447 4, Fujitec Annual Report
22 * * 1.4% 8, 66,364 6, 4, 39,445 33,836 33,241 48,693 2, Fujitec Annual Report 214


23 A , 6, 4, 2, 3,54 2,968 2,263 4,179 6, A Fujitec Annual Report


24 214 3 RMZ * KYUTO ERITO2 * 1.% 1.7% RMZ 15, 1, 1,187 9,669 9,795 1,59 13,24 2, 1,5 1,415 1,62 1,596 1,486 1,779 1, 5, Fujitec Annual Report 214


25 * * 2.8% , 2, 15, 15,562 1,815 1,123 11,431 14,166 1, 1, 5, * , * Fujitec Annual Report

26 * * 4.4% 1, * * 5 24 Fujitec Annual Report 214

27 CSR 1 1!! P! Fujitec Annual Report


28 & TECKY A FUJITEC TEC 26 Fujitec Annual Report 214


29 ,444,673 kwh 11,75 m 3 LPG 293,968 m 3 51,239 L 827,824 L 18,228 L 29,11 m 3 INPUT CO29,487 OUTPUT , 4, 3, % , 4 1, Fujitec Annual Report
30 / / / / 28 Fujitec Annual Report 214
31 e * 1 * 1 * 1 TAS * 2 * 2 * 2 *1 *2 Fujitec Annual Report


32 Fujitec Singapore Corpn. Ltd Fujitec Annual Report 214
33 * * * * TAS 27 6 * Fujitec Annual Report
34 Fujitec Annual Report 214
35 % % 1, % 6.8% % % % % % 1.7% % % % 1, % 1, % 18.4% % % 15, 1, 117,468 16,137 12,53 15,61 58,7 53,484 57,113 67,663 88, ,54 15, 1, 99,456 62,235 1,713 97,996 18,972 65,188 63,65 71,76 13, ,881 5, 48,67 48,569 47,948 49,85 58,338 5, 37,221 35,525 34,391 37,896 4, Fujitec Annual Report
36 % % % 15, 1, 5, 5,288 5,221 5, , , % , % ROE 1, % 2 2, % 8 7,5 5, 2,5 4, , , , , , 1, 5, , , ,99 14,817 17,213 93,51 78,272 64,56 67,161 67, ROE 34 Fujitec Annual Report 214
37 , 1, 5, 5, 1, 6,71 9,157 9,685 7,913 9, ,143 2,63 3,48 2,655 3,952 6,38 5,672 4,179 3,823 7,5 5, 2, , ,365 2,254 2,24 2,83 2,237 1,665 1,354 1,614 1, , ,5 2, 1,5 1,971 1,93 1,976 1,882 1, , 1,767 1,75 1,84 1,82 1, Fujitec Annual Report
38 ,93 15,519 $ 22, ,39 15, , , ,774 3,71 45, (1,263) (92) (12,262) 4,854 3, , ,93 13, , ,844 2,62 27, ,432 3,222 62, ,272 8,736 1,8, , ,228 4,363 5, , ,996 6,934 58, ,89 26,17 27, ,681 15,2 161, ,571 41, , (22,666) (2,26) (22,58) 21,95 21,19 212, ,925 6,816 67, , , ,982 28, , , , ,159 2,448 3, ,43 2,311 23, , ,643 $1,497, Fujitec Annual Report 214
39 $ 5, ,475 4, ,992 13, , ,326 11, , ,119 1,345 3, ,95 2,333 28, ,346 3,435 51, , ,31 5,91 68, ,349 39, , , , , , ,79 46, , ,415 4,418 62, ,764 44, , ,, 93,767, ,534 12, , ,566 14, , ,46 61,52 654,427 1,77, , (1,79) (135) (1,475) ,427 88,485 97, ,538 1,21 14, (2) (19) (9,864) (17,589) (95,767) (529) (5,136) (8,857) (16,568) (85,99) ,895 6,355 86, ,51 78,272 97, , ,643 $1,497,718 Fujitec Annual Report
40 ,54 117,468 $1,427, ,245 9,983 1,19, ,938 17, , ,183 18,296 1,32, ,871 9, , , (79) (56) (767) , , , , (26) (62) (253) (34) (33) (76) () () (4) (11) (39) (147) (1,427) (23) (235) (1,971) ,984 9,83 135, ,32 2,218 48, (688) 755 (6,679) ,344 2,973 42, ,64 6,857 93, ,976 1,35 19, ,664 5,57 $ 74, $.8 1* * Fujitec Annual Report 214
41 ,64 6,857 $ 93, , (2) (19) ,295 4,62 9, ,81 5,186 95, ,45 12,43 $188, ,94 9, , ,546 2,45 34,427 Fujitec Annual Report
42 ,767 12,534 14,566 57,228 (131) 84, (1,215) (1,215) ,57 5, (4) (4) ,767 12,534 14,566 61,52 (135) 88, (1,778) (1,778) ,664 7, (1,12) (1,12) ,767 12,534 14,566 67,46 (1,79) 93, (21,514) (21,58) 4,776 67, (1,215) , (4) ,925 4,49 1,579 6, ,21 (17,589) (16,568) 6,355 78, (1,778) , (1,12) (2) 7,725 (529) 7, ,54 1, ,538 (2) (9,864) (529) (8,857) 36 8,895 93, ,767 $121,689 $141,417 $597,281 $ (1,31) $859, (17,262) (17,262) ,48 74, (9,825) (9,825) ,767 $121,689 $141,417 $654,427 $(1,475) $97, $ 9,913 $ $(17,767) $ $(16,854) $ $61,7 $759, (17,262) , (9,825) ,19 (19) 75, (5,136) 74, ,659 99, $14,932 $(19) $ (95,767) $(5,136) $ (85,99) $349 $86,359 $97,776 4 Fujitec Annual Report 214
43 ,984 9,83 $135, ,237 2,83 21, , , , (793) (516) (7,699) (5,929) (3,355) (57,563) (3,43) (1,618) (33,39) , , (2) ,515 1,15 24, (7) 28 (68) (28) (2,19) (19) 8, ,657 9, , (3,363) (1,599) (32,65) ,294 7,913 9, (974) 1,427 (9,456) (2,7) (1,544) (19,485) (292) (615) (2,835) , (27) (254) (2,622) (2,655) (232) (25,777) (189) (1,29) (1,835) ,722 16, (1,568) (12) (15,223) (4) (5) (39) (1,12) (3) (9,825) (75) (56) (728) (1,777) (1,216) (17,252) (827) (463) (8,29) (172) (3) (1,67) (3,823) (3,48) (37,116) ,568 1,168 24, ,384 5,81 52, ,519 9,718 15, ,93 15,519 $22,942 Fujitec Annual Report
44 A Fujitec America, Inc. Fujitec Canada, Inc. Fujitec UK Ltd. Fujitec Deutschland GmbH Fujitec Singapore Corpn. Ltd. FSP Pte. Ltd. P.T. Fujitec Indonesia Fujitec (Malaysia) Sdn. Bhd. Fujitec Holdings Sdn. Bhd. Fujitec India Private Ltd. Fujitec (Thailand) Co., Ltd. Huasheng Fujitec Elevator Co., Ltd. Shanghai Huasheng Fujitec Escalator Co., Ltd. Fujitec Shanghai Sourcing Center Co., Ltd. Fujitec (HK) Co., Ltd. Rich Mark Engineering Limited Fujitec Taiwan Co., Ltd. Fujitec Korea Co., Ltd % 2% 5% 42 Fujitec Annual Report 214
45 B C D 3 E F G H 2 5 Fujitec Annual Report
46 I J K L Fujitec Annual Report 214
47 M N O P Q R S Fujitec Annual Report
48 37 4,7946, ,136 T U ESOP ESOP ESOP9 18 ESOP ESOP ESOPESOP 939,29862,7 9198, Fujitec Annual Report 214
49 $ 7, , (286) (273) (2,777) , (2) (19) (2) (19) (2) (19) ,295 4,62 9, ,295 4,62 9, ,295 4,62 9, ,81 5,186 $95, ,754 2, ,15 2,67 1, , ,754 2, ,15 2,67 1, , $26,738 $23,155 $33 $49, $26,738 $23,155 $33 $49, , Fujitec Annual Report
50 ,841 3,24 $ 47, ,6 4,738 68, ,29 5,945 77, ,93 13,887 $193, % % 34.% 12.5% 34.% ,347 $ ,565 15, , ,562 1,28 15, , ,737 2,88 36, ,572 1,386 15, ,338 7,35 9, (4,818) (3,884) (46,777) ,52 3,466 43, (812) (525) (7,883) (31) (31) (31) (236) (179) (2,291) (1,79) (735) (1,475) ,441 2,731 $ 33,48 48 Fujitec Annual Report 214
51 ,844 2,62 $27, , (139) (97) (1,35) ,441 2,731 $33, % 38.1 % (.9) (.29) (1.62) (1.14) (.35) % 3.24 % %35.64% 171, %4.87% % ,779 1,542 $17,272 1,779 1,542 17, ,475 4,932 1, $12,34 Fujitec Annual Report
52 $4, , $8, ESOP 9198, ,571 $15, $ $ (22) $ $ $ 5 Fujitec Annual Report 214
53 $1, , $4, % 25% 1% ,4 $126, , , , (559) (5,427) ,415 $13,243 Fujitec Annual Report
54 ,22 $79, , , , (378) (3,67) ,373 $91, $ 5, (26) (253) () () , $ 7, ,784 $14, (9,373) (91,) 1,411 13, ,379 32, ,79 46, ,79 46, ,79 $ 46, $ 6, , (164) (1,592) , $ 9, Fujitec Annual Report 214
55 $ , $7,981 7 A % % B % % Fujitec Annual Report
56 (13,545) , (5,343) , (4,37) (142) , , % % ,97619,1841, Fujitec Annual Report 214
57 ,52 14, ,23 6, ,54 147, , ,636 9,58 (9,58) ,47 14, ,24 66, ,634 (9,58) 147, ,82 14, ,245 59, ,61 (9,418) 134, ,65 (26) 5 1,779 6,67 13,33 (162) 12, ,443 6, ,81 73, ,633 (18,368) 154, , ,237 2, , ,39 2,374 2, ,897 11, ,588 45, , , , ,58 6,51 (6,51) ,865 11, ,59 48, ,969 (6,51) 117, ,418 11, ,14 44, ,75 (6,454) 18, , (12) 1,486 4,179 9,219 (47) 9, ,5 5, ,686 52, ,299 (16,656) 122, , ,83 2, , ,229 2,229 Fujitec Annual Report
58 $567,981 $137,214 $6,485 $126,437 $589,592 $1,427,79 $ $1,427, , ,718 93,1 (93,1) , ,534 6, , ,31 1,52,719 (93,1) 1,427, , ,786 6,485 19, ,553 1,394,184 (91,436) 1,32, ,79 (252) 49 17,272 64, ,535 (1,574) 124, ,582 66,835 5, , 715,379 1,676,48 (178,33) 1,497, , ,524 21,718 21, , ,272 1,87 23,49 23,49 4 A ,339 15,63 13,726 58,73 1, , ,85 12,266 1,737 43,124 1, , $566,398 $146,243 $133,262 $563,816 $17,99 $1,427,79 B , ,28 6, , , , , $215,35 $4,398 $9,98 $61,31 $49 $291,87 56 Fujitec Annual Report 214
59 $ $ $ $ $ $ $ $ $ $ 951 $ $ $ $ 951 $ $ ,961 6,961 6, A Fujitec Annual Report
60 B 1 C ,212 41,212 31,446 31, ,117 4,968 (1,149) 31,39 3,28 (759) ,15 5,15 4,154 4, () 1,914 1,914 () ,45 87,31 (1,149) 68,553 67,794 (759) ,19 17,19 13,43 13, * ,779 1,772 (7) 1,542 1,54 (2) ,339 19,332 (7) 15,545 15,543 (2) * (2) (2) 58 Fujitec Annual Report 214
61 $4,117 $4,117 $ ,93 397,748 (11,155) ,563 49, () $858,738 $847,583 $(11,155) $165,233 $165,233 $ ,252 5,252 * ,272 17,24 (68) $187,757 $187,689 $ (68) * 2... $ 369 $ 369 $..... (19) (19) * 1 1 * Fujitec Annual Report
62 $1, , ,71 3, ,915 3, $4,117 $ $ ,738 3,961 2, $775,874 $31,97 $2, , $32,379 $369 $369 6 Fujitec Annual Report 214
63 (2) $2,49 $ $(19) $5,553 $2,777 $ $35 2 a , Fujitec Annual Report
64 b , 36, 36, 36, ,16 3 a b % % ,216 $11,86 62 Fujitec Annual Report 214
65 Note ASG Fujitec Co., Ltd. 214 Annual Report Independent Auditor s Report Fujitec Annual Report

66 Fujitec America, Inc. Fujitec Canada, Inc. Fujitec Venezuela C.A. Fujitec Argentina S.A. Fujitec Uruguay S.A. Fujitec Pacific, Inc Fujitec Co., Ltd. 64 Fujitec Annual Report 214


 Sdn. Bhd. P.T.")
 Co., Ltd. Fujitec America, Inc.")
67 13 Fujitec (HK) Co., Ltd. 14 Fujitec Taiwan Co., Ltd. 15 Fujitec Korea Co., Ltd. 16 Huasheng Fujitec Elevator Co., Ltd Shanghai Huasheng Fujitec Escalator Co., Ltd. Fujitec Shanghai Sourcing Center Co., Ltd. 19 Fujitec Shanghai Technologies Co., Ltd Fujitec UK Ltd. Fujitec Deutschland GmbH Fujitec Saudi Arabia Co., Ltd. Fujitec Egypt Co., Ltd Fujitec Co., Ltd. UAE (Dubai) Office Fujitec Singapore Corpn. Ltd. FSP Pte. Ltd. Fujitec, Inc. Fujitec (Malaysia) Sdn. Bhd. P.T. Fujitec Indonesia Fujitec Vietnam Co., Ltd. Fujitec India Private Ltd. Fujitec (Thailand) Co., Ltd. Fujitec America, Inc. Huasheng Fujitec Elevator Co., Ltd. Shanghai Huasheng Fujitec Escalator Co., Ltd. Fujitec India Private Ltd. Fujitec Annual Report
68 ,, 93,767,317 3, ASG % CGMI CLIENT SAFEKEEP , , , , , , , , , , ,767, ,649 93,552,668 2 ESOP862, % 35.2% 6.52%.71% 21.22% 66 Fujitec Annual Report 214


69 会社名設立資本金事業内容所在地連結子会社従業員数 ,533,933, ,539 2,714 5,825 Web コーポレートサイト Facebook Fujitec Annual Report
70 Printed in Japan
untitled
 アニュアルレポート 2014 変化をチャンスと捉える力 The Ability to See Opportunity in Change Key Person Interview 財務セクション Contents 60 連結11ヵ年財務サマリー 62 経営者による経営成績および財務状態に関する説明および分析
 ,,, 7..9.7 7. 7..7.........,,9, 7. 7. 7.9..9 99......9.9...7,,,....7.......7... 7. 9 9..9....7.......9 9....7......7....... 7 99 7.9.9..7. 9.....9.9.... 9 97....7....7.... 7..9. 9 9... 7. 7. 7....... 9..
 1 20 2 26 4 28 6 30 10 32 12 33 14 74 75 1 2 0 6,000 7,000 5,000 4,000 3,000 2,000 1,000 2015 2012 2013 500 600 700 400 300 200 100 0 10 12 14 8 6 4 2 2015 2012 2013 2014 6,016 2014 6,252 2016 7.1 8.7
DIGITAL IMAGE INNOVATION Colorio me p4 LP-9000C p6 TV LIVINGSTATION p8
 2003 2003 4 1 2004 3 31 DIGITAL IMAGE INNOVATION Colorio me p4 LP-9000C p6 TV LIVINGSTATION p8 ........................................... 1!!!............................. 4.............. 4 LP-9000C......
Profile 1927 12 1958 1969 PT MANDOM INDONESIA Tbk 1996 11 2 1978 7 27 1984 7 1 2 3 6 8 8 10 12 14 16 20 22 24 28 30 31 32 34 35
 MANDOM Corporation Annual Review 2005 Construct the Foundation for Next Growth Profile 1927 12 1958 1969 PT MANDOM INDONESIA Tbk 1996 11 2 1978 7 27 1984 7 1 2 3 6 8 8 10 12 14 16 20 22 24 28 30 31 32
アニュアルレポート2004
 1 2 6 6 8 10 12 14 16 18 18 20 22 28 30 31 32 33 44 45 46 48 49 2004 2003 2002 2001 2000 2004 2004/2003 191,939 167,942 174,218 242,726 174,812 $1,810,745 14.3% 9,600 3,225 140 23,903 (4,628) 90,566 197.7
EPSON Safety Instructions Manual
 1 2 3 4 5 6 7 8 9 10 11 12 13 14 15 16 < EUROPE, MIDDLE EAST & AFRICA > ALBANIA : ITD Sh.p.k. http://www.itd-al.com AUSTRIA : Epson Deutschland GmbH http://www.epson.at BELGIUM : Epson Europe B.V. Branch
Ł\”ƒ1
 341331 2 9,869 9,838 0 2,500 5,000 7,500 10,000 12,500 315 703 189 200 0 200 400 600 800 11,441 3 14.1% 32.7% 19.5% 16.2% 17.5% 1 3 3 4 5 5 6 160,937 15,305 271,220 25,830 29,812 132,774 (1,411) 266,015
Nikon 2001ar
 Innovations in precision and optical technologies 2001 1 2 5 13 13 16 18 19 20 21 35 36 37 38 39 01 483,957 00 371,801 99 305,765 98 372,146 97 379,089 01 20,911 00 7,770 (18,233) 98 8,318 97 19,936 01
Rising to the Challenges
 Rising to the Challenges Rising to the Challenges We Fly 1st 1 2 3 4 5 14,896 14,878 13,925 12,283 13,576 921 6.2 843 5.7 678 5.0 326 641 4.3 233 2,519 3,577 2,099 2,116 75 0.5 (542) 2.2 (42) (573) 1.7
【アニュアルレポート】
 Unparalleled Innovation and Customer Satisfaction For Local Communities in Japan and Increasingly Overseas 2012 2012 3 457 BIZ-e- 6 AA Yamato Holdings Co., LTD. 2 4 5 12 14 16 16 18 BIZ- 20 22 e- 24 26
2
 2 3 2 4 5 6 9 12 12 18 23 47 49 50 52 53 4 5 2007 497,396 21,070 26,038 16,363 536,322 186,528 2007 48.79 12.00 2007 4,213,427 178,481 220,571 138,614 4,53,179 1,580,078 2007 0.41 0.10 2006 451,911 21,947
PREFACE: The Origins of Quality A I D A E n g i n e e r i n g, LT D.
 PREFACE: The Origins of Quality A I D A E n g i n e e r i n g, LT D. Manufacturing In the Age of The Environment NS1-1500(D) +LFL 200 188 100 wh 97 1 1.67 2 100 kw/h A n n u a l R e p o rt 2 0 1 0 1 PREFACE:
マツダ株式会社
 363026 ファイル名 :000_3_0779700101906.doc 更新日時 :2007/03/13 13:39 印刷日時 :07/06/23 17:21 第 141 期 ( 自平成 18 年 4 月 1 日至平成 19 年 3 月 31 日 ) 有価証券報告書 1 本書は証券取引法第 24 条第 1 項に基づく有価証券報告書を 同法第 27 条の30の2に規定する開示用電子情報処理組織 (EDINET)
2004 3 1963 1 2 4 2004 MISUMI It s about TIME QCT 8 12 CSR 14 16 17 6 18 19 24 39 40
 2004 2004 3 MISUMI It s about TIME 2004 3 1963 1 2 4 2004 MISUMI It s about TIME QCT 8 12 CSR 14 16 17 6 18 19 24 39 40 MISUMI Corporation ANNUAL REPORT 2004 2003 32004 3.................................................
thermometer AnnuAl RepoRt 2011 Terumo CorporaTion
 2011 2011 3 1921 10 thermometer 1921 1853 1931 AnnuAl RepoRt 2011 Terumo CorporaTion 2011 5 01 Introduction MRS. GIeSeKe 1994 DuraHeart DuraHeartDuraHeart 5 DuraHeart DuraHeart DuraHeart duraheart 2007
1120再入稿_Ushio_ウシオ電機_53中期_株主通信.indd
 PRISM 2015 4 12015 9 30 2015 12 CONTENTS USHIO NOW! P 2 P 4 P 6 P 8 P10 P12 P14 USHIO NOW! 1964 No. 1 1964 3 19,556 2015 9 30 5,764 1,749 853 3,162 2015 4 12015 9 30 886 441 387 479 20 65 4 5 2 USHIO NOW!
サステナビリティ報告書
 Living and Working together for the common good. 1 Canon Sustainability Report 2003 Canon Sustainability Report 2003 2 3 Canon Sustainability Report 2003 Canon Sustainability Report 2003 4 93 94 95 96
ニコン レポート 2014
 NIKON REPORT 2014 2014 20143 2014 20153 CSR CONTENTS 02 04 06 08 09 14 Next 100 - Transform to Grow 18 18 20 22 FPD 24 26 28 30 31 32 FOCUS CSR 34 CSR 36 38 39 41 42 CSR 44 46 48 52 57 58 60 61 01 P.67
つばきグループ コーポレートレポート2013
 TSUBAKI CORPORATE REPORT 213 213 2 2 3 4 6 8 9 1 12 14 16 19 2 2 24 FOCUS ON 26 3 TOPICS 31 32 34 36 38 41 44 45 46 1 48 212 5 51 http://www.tsubakimoto.jp/ http://www.tsubakimoto.jp/ 212 25 GRI 3G3 212
NX10_150223J16AB_0116.ai
 Park NX10 www.parkafm.co.jp Park Systems The Most Accurate Atomic Force Microscope Park NX10 Park NX10 Park Systems The Most Accurate Atomic Force Microscope Park NX10 nm 12 8 4 0 Park Systems The Most
01
 Honda Environmental Annual Report Honda 2OO6 Commitment to the future 02 http://www.honda.co.jp/csr http://www.honda.co.jp/investors/annualreport http://www.honda.co.jp/philanthropy/report http://www.honda.co.jp/safetyinfo/action
アニュアルレポート2003
 ..................................... 1............................. 2 6 8 10 12 14............................ 16..................... 20.............................. 21.........................................
ParkOptions&ACC_2001_Jap.ai
 Park AFM www.parkafm.co.jp Park AFM 02 Park Systems Enabling Nanoscale Advances 04 06 08 10 11 12 14 15 16 18 19 03 Park AFM SmartScan TM 04 Park Systems Enabling Nanoscale Advances 05 Park AFM 06 Park
9BBH3A8_P0000
 02 Yamaha CSR Report 2007 03 Yamaha CSR Report 2007 04 Yamaha CSR Report 2007 Yamaha CSR Report 2007 05 06 Yamaha CSR Report 2007 Yamaha CSR Report 2007 07 08 Yamaha CSR Report 2007 09 Yamaha CSR Report
 REFORM FOR THE NEXT 100 YEARS Strengthening Our Management Foundation for Sustainable Growth 2017 IT LT FT e 2019 11100 100 100 2025 3 KAIKAKU 2019 for NEXT100 100 3 3 100 2017 12 2025 2017 01 2017 9

三菱日立パワーシステムズのグループ会社について
 2014 年 1 月 28 日 三菱重工業株式会社 株式会社日立製作所 三菱日立パワーシステムズのグループ会社について 国内 9 社 海外 49 社 計 58 社のグループが発足 三菱重工業株式会社と株式会社日立製作所が設立する火力発電システム事業会社である三菱日立パワーシステムズ株式会社は 2014 年 2 月 1 日の発足に伴い 国内 9 社 海外 49 社 計 58 社からなる三菱日立パワーシステムズグループを発足させます
アニュアルレポート2015
 215 http://www.nagase.co.jp/ : : : 55-8668 1-1-17 TEL 6-6535-2114 13-8355 5-1 TEL 3-3665-321 46-856 3-14-18 TEL 52-963-5615 NAGASE Business Model 46 NAGASE 3.9% 2.1% R&D 14.5% 19.7% 1.1% 2153 7,597 22.1%
NNA Since 1989
 NNA Since 1989 NNA 2011 1945 NHK 17 1 9 199578 1 1989 8 2016 4 7,000 1 2017 19.5 189 UFJ NNA JAPAN CO., LTD. 1989 8 WIN HONEST PLANNING LIMITED 1992 6 1994 9 1995 4 6 8 1996 8 10 1998 1 4 WebNNA PLUS 1999
ares_018
 THE ASSOCIATION FOR REAL ESTATE SECURITIZATION May-June. 2003 1 3 5 11 20 35 37 38 44 58 65 72 80 91 95 104 107 112 2 ARES SPECIAL ARES SYMPOSIUM 2005 November-December. 2005 3 ARES SPECIAL 4 5 November-December.
THE INTAGE WAY SDI 1964 SCI CONTENTS FEATURE 18 FEATURE INTAGE HOLDINGS Inc.
 Renovation and Innovation 2015 201532 55 THE INTAGE WAY 1960 196032 507 SDI 1964 SCI 1970 1960 1973 CONTENTS 02 04 06 12 12 14 15 16 FEATURE 18 FEATURE INTAGE HOLDINGS Inc. POS 20153 439 2015 2000 2001
XBRL導入範囲の拡大
 資料 3 XBRL 導入範囲の拡大 金融庁総務企画局企業開示課 2007 年 2 月 15 日 対象書類の拡大1.. 今後の XBRL 導入範囲の拡大検討 今次開発では 有価証券報告書等ののみに XBRL を導入する計画である 将来的には 情報へのニーズ 技術仕様等の醸成状況等を踏まえ XBRL 化が効果的な情報を対象に導入範囲の拡大を検討することが適当である 対象範囲の拡大 有価証券報告書 半期報告書
SEIKO EPSON CORPORATION
 2004 Digital Image Innovation SEIKO EPSON CORPORATION SEIKO EPSON CORPORATION 1 2 SEIKO EPSON CORPORATION TFT 1 Print Image Matching SEIKO EPSON CORPORATION 3 4 SEIKO EPSON CORPORATION 15 10 10 9 9 18
GC-X3
 GC-X3 Digital Still Camera GC-X3 STILL CAMERA LYT0667-001A 1 28 1 4 2 3 2 30 1 2 3 2 3 34 1 4 38 1 2 4 5 39 3 ;: 3 1 2 3 4 2 6 8 16 16 18 18 19 20 22 24 25 26 27 28 29 30 31 32 32 33 34 35 36 37 38 39
川崎汽船 社会・環境レポート 2008
 1 2 3 ➊ ➋ ➌ ❶ ❷ ❸ ❹ ❺ ➊ ➋ ➌ O UTLINE OF B USINESS ➊ ➋ ➌ ➍ ➎ C ORPORATE G OVERNANCE AND R ISK M ANAGEMENT F OR B ETTER R ELATIONSHIP WITH S OCIETY ➊ ➋ ➌ ➍ ➎ ➏ ➐ ➑ ➊ ➋ ➌ ➍ I N T E R V I E W I
untitled
 TURKMENISTAN AFGHANISTAN PAKISTAN KAZAKHSTAN UZBEKISTAN KYRGYZSTAN TAJIKISTAN NEPAL BHUTAN INDIA LAOS BANGLADESH THAILAND MONGOLIA CAMBODIA MALAYSIA NORTH KOREA SOUTH KOREA TAIWAN PHILIPPINES AUSTRALIA
 2004 2004 41 2005 331 Exceed Your Vision VisionExceed 14......................... 01... 04................. 08......................... 12............................. 14......................... 16........................
 1991.7.1 1949.6.1 1945.12.1 1953.9.3 1945.9.3 1945.3.8 21.7.3 1986.9.1 196.3.8 1969.5.15 1992.3.19 1988.3.24 22.6.1 1943.2.18 1943.3.29 1965.8.31 197.6.1 1952.2.12 195 194 197 196 198 199 1995 2 & 2 1
DENSO(総合)日本語
日本語") Automotive Environment Safety Comfort Convenience NonAutomotive Home & Industry New Business Corporate Social Responsibility Corporate Citizenship DENSO GROUP INFORMATION CORPORATE DATA 1 4 5 6 1 1 19491216
Automotive Environment Safety Comfort Convenience NonAutomotive Home & Industry New Business Corporate Social Responsibility Corporate Citizenship DENSO GROUP INFORMATION CORPORATE DATA 1 4 5 6 1 1 19491216
RISO P ‘C’³
 RISO REPORT 2000 1 2 3 4 5 6 T O P I C S 7 8 T O P I C S 39 100,000 12,000 6,000 80,000 60,000 40,000 20,000 10,000 8,000 6,000 4,000 2,000 5,000 4,000 3,000 2,000 1,000 0 0 0 H8/3 H9/3 H10/3 H11/3 H12/3
環境報告書
 2001 A A Canon Bretagne S.A. France Taiwan Canon Opto(Malaysia) Sdn.Bhd. Malaysia Canon Hi-Tech(Thailand) Ltd. Canon Engineering (Thailand) Ltd.
untitled
 671-1281 1239 079-273-7584 FAX079-273-7911 108-8230 2-18-1 JR 03-6711-8110 FAX03-6711-8138 http://www.daicel.co.jp C S R 2009 TAC 19198 100 TAC POM TAC TAC POM OA POM 0.1 Environmental, Safety and Social
untitled
 ANNUAL REPORT 28 28 3 28 3 1. 1, 35.4% 2. 11.7% 8.1% 3. 17.9% 29.3% 4. Contents 2 4 6 1 12 14 7 1 16 1 18 2 28 3 2 21 22 23 & 24 CSR 26 28 29 57 58 59 Annual Report 28 1 2728 3 28 27 28 336,864 31,88 $
aishin00_100608
 www.aisin.co.jp 21.9.23 15, 3rd 1991.7.1 1949.6.1 1945.12.1 1953.9.3 1945.9.3 1945.3.8 21.7.3 1986.9.1 196.3.8 1969.5.15 1992.3.19 1988.3.24 22.6.1 1943.2.18 1943.3.29 1965.8.31 197.6.1 1952.2.12 195 194
h1
 A N N U A L R E P O R T 2 1 4 C T C グ ル ープ は I T を 活 用 して I N D E X CTC理念体系 第1章 CTCの成長を支える4つの強み 持 続 可 能 な 社 会 づ くり に 貢 献 して い ま す トータルソリューションプロバイダ 3 マルチベンダー 4 豊富な顧客基盤 5 強固な財務基盤 6 第2章 経営方針 重点施策 CTCプリンシプル
UNI_AR04_J_Cover
 Unicharm Corporation Annual Report 2004 1 2 8 10 12 13 14 16 17 39 40 41 Unicharm Annual Report 2004 1 2004 2003 2002 2004 240,110 223,169 206,707 $2,265,189 30,727 25,793 18,974 289,878 16,240 12,879
EDINET 提出書類 株式会社三栄建築設計 (E0405 訂正有価証券報告書 表紙 提出書類 有価証券報告書の訂正報告書 根拠条文 金融商品取引法第 24 条の 2 第 1 項 提出先 関東財務局長 提出日 2019 年 1 月 16 日 事業年度 第 25 期 ( 自 2017 年 9 月 1
 表紙 提出書類 有価証券報告書の訂正報告書 根拠条文 金融商品取引法第 24 条の 2 第 1 項 提出先 関東財務局長 提出日 2019 年 1 月 16 日 事業年度 第 25 期 ( 自 2017 年 9 月 1 日至 2018 年 8 月 31 日 ) 会社名 株式会社三栄建築設計 英訳名 SANEI ARCHITECTURE PLANNING CO.,LTD. 代表者の役職氏名 代表取締役専務小池学
2005年3月期中間事業報告書
 2004 Vol. 4 NRI 2005 3 2004 4 1 2004 9 30 NRI Dream up the future. Dream up the future. NRI NRI 2 3 5 7 10 11 13 15 17 1 NRI 2005 3 2004 4 2004 9 IT 1,151 123 129 68 20 NRI 2004 11 2 2003 3 2004 3 2005
 1 20 10 1 21 3 31 1 20 10 1 21 3 31 437444 20 10 121 3 31 1 1 20 10 1 3420 10 121 3 31 4 OEM 100 1 3,097 71 5,495 4 3 90 1414118 41 7 14 19 3 68 9 95 4 66187 95 269 2 PNDGarmin LtdAV 4 2008 2009 3 3 2
(訂正・数値データ修正)「平成29年5月期 決算短信〔日本基準〕(連結)」の一部訂正について
「平成29年5月期 決算短信〔日本基準〕(連結)」の一部訂正について") 平成 29 年 7 月 25 日 各 位 会社名 三協立山株式会社 代表者名 代表取締役社長 山下 清胤 ( コード番号 5932 東証第一部 ) 問合せ先 経理部長 吉田 安徳 (TEL0766-20-2122) ( 訂正 数値データ訂正 ) 平成 29 年 5 月期決算短信 日本基準 ( 連結 ) の一部訂正について 平成 29 年 7 月 12 日 15 時に発表いたしました 平成 29 年
平成 29 年 7 月 25 日 各 位 会社名 三協立山株式会社 代表者名 代表取締役社長 山下 清胤 ( コード番号 5932 東証第一部 ) 問合せ先 経理部長 吉田 安徳 (TEL0766-20-2122) ( 訂正 数値データ訂正 ) 平成 29 年 5 月期決算短信 日本基準 ( 連結 ) の一部訂正について 平成 29 年 7 月 12 日 15 時に発表いたしました 平成 29 年
1994 1/ Action Action SE15 P.24 Epson Group Sustainability Report 21 38
 1998 Action7 26 Action21 25 29 SE15 21 4 SE15 215 21 EC-1 P.25 P.53 CO2 CS CS 25 Epson Group Sustainability Report 21 37 1994 1/1999 6 1 2 3 4 5 Action7 1998 25 Action21 26 29 215 SE15 P.24 Epson Group
The Value Of Interships - Adecco Asia White Paper 2015_no1
 Creating Value From Internship Programmes An Adecco Asia White Paper April/May 2015 Introduction 3 4 5 6 The Adecco Asia Network: China Hong Kong Japan Malaysia Singapore South Korea Taiwan Thailand Vietnam
 財務ハイライト 売上高 営業利益 中間期 百万円 1, 通期 96,773 1, 8,536 当期純利益 中間期 百万円 8, 通期 8, 87,256 1 株当たり当期純利益 中間期 中間期 円 通期 円 5, 6,758 75, 6, 通期 2 6, 153.55 4,295 4,5 5,452 141.57 15 4,652 5, 39,279 42,666 46,113 47,566 4,
P001-052.indd
 Quality of Life 1 TEIJIN CSR Report 2014 2 TEIJIN CSR Report 2014 CONTENTS 3 5 9 15 21 23 25 26 28 37 38 41 42 29 30 34 35 36 43 44 45 49 50 51 52 http://www.teijin.co.jp/csr/ WEB 3 TEIJIN CSR Report 2014
株式会社良品計画_会社案内 2019(日本語)
") Corporate Profile 219 English 198 12 47, 29 9 19893 217 5, 6ROE15% 4 219 4 MUJI Diner MUJI HOTEL GINZA 17 8424 26 3 3 3989 443 https://ryohin keikaku.jp/ 1989 6 1979 5 MUJI HOUSE MUJI (HONG KONG) CO.,
Corporate Profile 219 English 198 12 47, 29 9 19893 217 5, 6ROE15% 4 219 4 MUJI Diner MUJI HOTEL GINZA 17 8424 26 3 3 3989 443 https://ryohin keikaku.jp/ 1989 6 1979 5 MUJI HOUSE MUJI (HONG KONG) CO.,
コーポレート ガバナンスに関する報告書の主な開示項目 コーポレート ガバナンスに関する報告書 記載項目 ( 内訳 ) 記載上の注意 基本的な考え方 ( 記載例 : コーポレート ガバナンスについての取組みに関する基本的な方針 目的 ) Ⅰ コーポレート ガバナンスに関する基本的な考え方及び資本構成
 記載上の注意 基本的な考え方 ( 記載例 : コーポレート ガバナンスについての取組みに関する基本的な方針 目的 ) Ⅰ コーポレート ガバナンスに関する基本的な考え方及び資本構成") 資料 3 関連するデータ等 平成 26 年 10 月 20 日 ( 月 ) コーポレート ガバナンスに関する報告書の主な開示項目 コーポレート ガバナンスに関する報告書 記載項目 ( 内訳 ) 記載上の注意 基本的な考え方 ( 記載例 : コーポレート ガバナンスについての取組みに関する基本的な方針 目的 ) Ⅰ コーポレート ガバナンスに関する基本的な考え方及び資本構成 企業属性その他基本情報 資本構成
資料 3 関連するデータ等 平成 26 年 10 月 20 日 ( 月 ) コーポレート ガバナンスに関する報告書の主な開示項目 コーポレート ガバナンスに関する報告書 記載項目 ( 内訳 ) 記載上の注意 基本的な考え方 ( 記載例 : コーポレート ガバナンスについての取組みに関する基本的な方針 目的 ) Ⅰ コーポレート ガバナンスに関する基本的な考え方及び資本構成 企業属性その他基本情報 資本構成
第4章インタビュー調査結果
 4 1 1 1 3 1 2 3 2 3 3 4 1 2 1 2000 9 10 30 4 2 2 3 1 3-27 - a 4-1- 1 X Z 9 3-4 - 28 - b 4-1- 2 c - 29 - 4-1- 3 a 4-1- 4 X - 30 - b 4-1- 5 Z 50% 100% 100% - 31 - 2 3 4-1- 6 Z vs 3 3 2-32 - 36 a b c - 33
 CSR Report Corporate Social Responsibility Report 2010 48 27 30 20 30 30 22331 223 221947725 291954113 689,500 23,781,394 1,295656 23, 775 738 565 2,630 34,837 26,637
ニコンCSR報告書2009
 Nikon CSR REPORT 29 CSR 1 Nikon CSR REPORT 29 2 Nikon CSR REPORT 29 3 5 7 15 17 17 19 21 23 23 25 27 29 29 35 39 42 42 46 47 53 55 59 68 69 7 28 CSR CSR CSR 293 CSR 1 2841293 31 2961 48 2 GRI 3 27 GRI
191590-21 -21 20051 2 Industrial automation and control business PAGE 16 Test and measurement business PAGE 18 New and other businesses PAGE 20 Conten
 New action strategies for growth 191590-21 -21 20051 2 Industrial automation and control business PAGE 16 Test and measurement business PAGE 18 New and other businesses PAGE 20 Contents YOKOGAWA Enterprise
JXH_AR15_4C_0909.indd
 Steady Progress 2015 2015 3 Page 2 2... 4... Page 9 10... 12... 2015 14... 2 16... 5 18... (2020 19... 19... 25... 30... 2 http://www.hd.jx-group.co.jp/ir/ Annual Report 2015 Page 35 Page 51 36... 38...
Traditional View The Red that You ve never seen CYAN : 10 MAGENTA : 100 YELLOW : ADK VISION VI Visual Identity ADK ADK Active Red Ac
 2014 2014 12 THE DIFFERENCE IN RED Traditional View The Red that You ve never seen CYAN : 10 MAGENTA : 100 YELLOW : 90 2013 ADK VISION 2020 2014 VI Visual Identity ADK ADK Active Red Active Red ADK BLACK
1 2 3 Shin-Etsu Shin-Etsu Polymer Sustainability Report 2017
 信 越 ポリマ グ ル ープ サ ス テ ナビ リティレ ポート 2 0 17 Shin-Etsu Polymer Sustainability Report 2017 1 2 3 Shin-Etsu 1 2 3 4 5 6 7 8 9 10 11 2 Shin-Etsu Polymer Sustainability Report 2017 2001 2017 2012 2017 Web URL http://www.shinpoly.co.jp/environment/report/
株主の皆様へ 82 平成 29 年 4 月 1 日 平成 29 年 9 月 30 日 6981
 株主の皆様へ 82 平成 29 年 4 月 1 日 平成 29 年 9 月 3 日 6981 株主の皆様へ To Our Shareholders 平素は格別のご高配を賜り厚くお礼申し上げます 第 82 期 ( 平成 3 年 3 月期 ) の中間報告書をお届けするにあたり 当社グループの業績概要についてご報告申し上げます 代表取締役会長兼社長 / 17,5 2 9.8 92.2 93.5 92.6
C O N T E N T S 1. 2. 3. 4. 5. 6. 7. 8. 9. 10. 11. 12. 13. 14. 15. 16. 17. 18. 2009 Annual Report
 C O N T E N T S 1. 2. 3. 4. 5. 6. 7. 8. 9. 10. 11. 12. 13. 14. 15. 16. 17. 18. 2009 Annual Report 1 1 2009 Annual Report 1. 2. 2 2 2009 Annual Report 3 3 2009 Annual Report 3. 1980 1991 1992 1993 1994
18年度石見美術館年報最終.indd
 A Annual Report Annual Report B 1 Annual Report Annual Report 2 3 Annual Report Annual Report 4 Annual Report 5 Annual Report 6 7 Annual Report Annual Report 8 9 Annual Report Annual Report 10 11 Annual

E-EV EEV-A Zero-molding [ ] E-DU Zero-molding Zero-molding Zero-molding100% E- [ ] 3 Zero-molding Zero-molding imple & Quick Precise & table mar
![E-EV EEV-A Zero-molding [ ] E-DU Zero-molding Zero-molding Zero-molding100% E- [ ] 3 Zero-molding Zero-molding imple & Quick Precise & table mar](/thumbs/85/92048893.jpg "E-EV EEV-A Zero-molding [ ] E-DU Zero-molding Zero-molding Zero-molding100% E- [ ] 3 Zero-molding Zero-molding imple & Quick Precise & table mar") umitomo Network in JAPAN () () () () () () () () () () () () 141-602 2-1-1 Tel: 03-6737-288 Fax: 03-6866-184 141-602 2-1-1 Tel: 03-6737-276 Fax: 03-6866-176 263-0001 731-1 Tel: 0-420-1471 Fax: 0-420-191
umitomo Network in JAPAN () () () () () () () () () () () () 141-602 2-1-1 Tel: 03-6737-288 Fax: 03-6866-184 141-602 2-1-1 Tel: 03-6737-276 Fax: 03-6866-176 263-0001 731-1 Tel: 0-420-1471 Fax: 0-420-191
<4D F736F F D F990B C B835E92F990B3816A817595BD90AC E82528C8E8AFA81408C888E5A925A904D816B93FA967B8AEE8F80816C C8B816A817682CC88EA959492F990B382C982C282A282C481A3312E646F6378>
 各位 平成 30 年 10 月 31 日 会社名株式会社丸順代表者名代表取締役社長齊藤浩 ( コード番号 3422 名証第二部 ) 問合せ先取締役経営企画部長棚橋哲郎 (TEL 0584482832) ( 訂正 数値データ訂正 ) 平成 30 年 3 月期決算短信 日本基準 ( 連結 ) の一部訂正について 平成 30 年 5 月 10 日に発表しました 平成 30 年 3 月期決算短信 日本基準
JP_00-1 Front cover
 Next Generation Solution for Geotechnical and Tunnel Engineering About MIDAS IT http://www.midasuser.com 01 We Analyze and Design the Future Business Areas http://www.midasuser.com 02 MIDAS MISSION MIDAS
 b b b b b b b b b b b b b b b b b b b b b b b b b b b b b b b b b b b b b b b b b b b b b b b b b b b b b b b b b b b b b b b b b b b b b b b b b b b b b b b b b b b b b b b
あいおいニッセイ同和損保の現状2013
 CUSTOMER FOCUSED INTEGRITY TEAMWORK INNOVATION PROFESSIONALISM D MS&AD 201371 MS&AD MS&AD MS&AD MS&AD MS&AD 2 3 13 4 15 MS&AD 201371 MS&ADMS&ADMS&ADMS&AD MS&AD7 MS&AD MS&AD 2010 2013 401K ART 2013 20131
ごあいさつ PFI
 Chodai Report ごあいさつ 50 1 2017201851 2017 11 PFI 201850 50 50 2018 30 7 第 51 期の事業活動について 51 2017 10 12018 9 30 2016 PFI10 40 PPP/PFI PFI 110 25 2 51 51 50 28,969 26,661 1,716 1,689 1,071 1,060 23,897 22,990
Since
 Since 1885 16.4 15.6 14.2.8 39.4 13.6 21 211 212 213 214 8,88 227 186,164 181,869 184,412 197,495 21,995 11,466 11,67 15,474 16,899 22,1 1, 24, 3,54 5,686 7,518 9,615 17,467 8,88 8,37 8,288 8,29 8,319
2
 2 金子雄二 3 4 5 6 Machine Tools 7 Industrial Machines 8 Food Machines 9 Others 10 LED 11 Sodick s Creativity 12 ISO9001 :2008 13 Sodick Growth Potentials Sodick Europe Ltd. Suzhou Sodick Special Equipment
1963 1 2 8 12 18 20 22 23 24 6 25 30 54 55
 2007 1963 1 2 8 12 18 20 22 23 24 6 25 30 54 55 200720063 2007 2006 2007/2006 2007. 118,139 105,408 12.1% $1,000,754 56,344 46,405 21.4 477,289 32,796 31,502 4.1 277,813 11,836 10,085 17.4 100,267 4,333
untitled
 Tohoku Electric Power Co., Inc. CSR Report 2012 01 Tohoku Electric Power Co., Inc. CSR Report 2012 01 03 05 07 08 09 11 12 13 38 39 41 43 44 45 15 17 18 19 22 29 31 33 34 35 36 37 47 49 52 53 54 55 02
コーポレート・データ_損保ジャパン日本興亜の現状2016
 184 186 188 190 191 193 194 195 198 2016 183 2014 9 9 NKSJ 11 2015 2016 3 5 10 SOMPO 5 2002 7 7 2003 2004 2005 8 12 4 7 9 DC100% 4 6 10 12 PICC Holding Company 4 6 7 7 7 10 11 2010 2011 3 OJSC IC ROSNO
CONTENTS 8100 GDP
 The Monthly NNA 20143 12 5? CONTENTS 8100 GDP CONTENTS DATA 12 10 POS 8100 Q9 1 10 Question 5 1 3 6 30 59 ASEAN 13 12 1 2 3 39.9% 38.4% 31.1% 28.8% 4.4% 4.7% China Thailand Indonesia Vietnam India 24 2
ニコンレポート2016
 NIKON REPORT 216 216 216 3 1 2171 19171 216 3Next 1 - Transform to Grow 6 216 2171215 1 http://www.nikon.co.jp/profile/museum/ ABOUT NIKON 2 4 6 BUSINESS STRATEGY 8 9 14 16 BUSINESS PERFORMANCE 18 22 216
GR-DX307
 GR-DX307 140 140 R 27 LYT1308-001A 2 1 2 1 5 2 4 3 R 41 1 2 3 3 1 3 4 2 R 52 1 2 3 4 1 2 3 2 1 3 4 r r 5 6 P p 5 6 1 3 2 4 r f 5 2 1 3 4 R 105 R 107 M R 76 83 R 164 R 8 R 38 R 52 R 69 7 8 R M M M 9 R 107
 214 社会 環境報告書 Social & Environmental Report 24 27 27 21342143 2144 TEL6-6466-6662FAX6-6463-1394 URL http://www.dnt.co.jp/... 2... 4... 6... 8... 9... 1... 11... 13... 14... 16... 17... 18... 2... 21...
GR-DX117
 GR-DX117 138 138 R 25 LYT1313-001A 2 1 2 1 5 2 4 3 R 39 1 2 3 3 1 3 4 2 R 50 1 2 3 4 1 2 3 2 1 3 4 r r 5 6 P p 5 6 1 3 2 4 r f 5 2 1 3 4 R 103 R 105 M R 74 81 R 162 R 8 R 36 R 50 R 67 7 8 R M M M 9 R 105

CSRレポート2930
 CSR REPORT 2009 CSR REPORT 2009 CSR REPORT 2009 CSR REPORT 2009 CSR REPORT 2009 CSR REPORT 2009 CSR REPORT 2009 CSR REPORT 2009 CSR REPORT 2009 15 8 14 34 39 5 85 CSR REPORT 2009 CSR REPORT 2009 CSR REPORT
hyou1.eps
 CSR 2007 2007 CSR 1 Contents 3 How many? How much? 18 19 20 21 24 23 25 27 28 29 30 31 32 33 34 36 35 39 41 43 46 48 9 13 17 5 7 2 3 4 5 6 63 7 75 29,000 56 35 2002 3,949 2002 394 2002 8,343 2003 4,142
Microsoft Word - 10 統計 参考.doc
 参考 統計 主要輸入国の 1 日当たりの原油輸入量 原油の世界貿易マトリックス (140 ページ ) の中から輸入額が大きい日本 米国 中国等を選び 1 日あたりの原油輸入量を比較したのが表 - 1 である 貿易統計で使われている原油の数量単位は統一されていない 米国はバレル (Bbl) 日本はキロリットル (KL) の容積表示 EU 諸国やインドのメトリック トン (M. Ton) 中国や韓国のキログラム
DNT2013
 ... 2... 4... 6... 8... 1... 11... 13... 14... 16... 17... 18... 2... 21... 22... 24... 27... 28... 3... 32 24 27 27 21242133 2134 TEL 6-6466-6662FAX 6-6463-1394 URL http://www.dnt.co.jp/ 213 1 2 213 3
ソネット・エムスリー株式会社
 :000_2_0344605521609.doc :2004/08/07 9:55 :04/08/12 14:28 1 1 2 3 2 3 :000_4_0344605521609.doc :2004/08/10 4:27 :04/08/12 14:28 :000_4_0344605521609.doc :2004/08/10 4:27 :04/08/12 14:28 000_header_0344605521609.doc
 21 20183 20185 18/317/3 1 21 1-1 4 1-2-1 21 5 1-2-2 21 6 2 20183 2-1 8 2-2-1 9 2-2-2 10 2-3 11 3 20193 3-1 13 3-2 14 4 4-1 16 4-2 17 4-3-1 18 4-3-2 19 4-3-3 20 4-3-4 21 4-3-5 22 4 4-4-1 23 4-4-2 my DIY
JP_00-1 Front cover
 Next Generation Solution for Geotechnical and Tunnel Engineering About MIDAS IT http://www.midasuser.com 01 We Analyze and Design the Future Business Areas http://www.midasuser.com 02 MIDAS MISSION MIDAS
優れたコンテンツの創造と 海外展開について
 124 GDH GDH DVD DVD BB GDH GONZO+ GONZO TV 24 ANNA SUI Grand Palais SAMURAI7 TV 2 DVD35,000 MoMA Samurai 7 GONZO GONZO GONZO+ 1 Breaking The Habit Linkin Park MTV GONZO T V Spike TV Spike TV 9 Namco Namco
名称未設定-2
 2 0 0 4 2000 2001 2002 2003 3,000 3,000 8,000 10,000 C O N T E N T S 3-4 5-6 7-8 9-13 41-45 46-48 14 49-54 55-56 15-16 57-62 63 17 18-20 21-22 23-27 64 65 28 66 67-81 29-30 31 32 33-34 35 36 37 38 39-40
1) IT IR CSR 120 DAIWA SECURITIES GROUP ANNUAL REPORT 2010
 IT IR CSR 120 DAIWA SECURITIES GROUP ANNUAL REPORT 2010") p120 p126 p130 p131 p133 DAIWA SECURITIES GROUP ANNUAL REPORT 2010 119 1) 2010 7 1 IT IR CSR 120 DAIWA SECURITIES GROUP ANNUAL REPORT 2010 121 DAIWA SECURITIES GROUP ANNUAL REPORT 2010 CEO COO SMBC PI
p120 p126 p130 p131 p133 DAIWA SECURITIES GROUP ANNUAL REPORT 2010 119 1) 2010 7 1 IT IR CSR 120 DAIWA SECURITIES GROUP ANNUAL REPORT 2010 121 DAIWA SECURITIES GROUP ANNUAL REPORT 2010 CEO COO SMBC PI
Briefs Topics Regional Business May
 Mizuho Bank, Ltd., Hong Kong Corporate Banking No.1 China ASEAN Research & Advisory Vol. 52 M a y 2016 Briefs & Editorial Topics Regional Business Philippines Vietnam India Malaysia Singapore China Taiwan
&HLDGS. 211 プロフィール - Ario 業績概要 世界の小売業データ 国内の小売環境 3, 1, 2, グループ事業戦略 主要事業会社の営業データ 会社データ 5,
 - 199 2 & 21 11 212 2 39 212 5 1,m 2 Ario 13 1 3 7 16 27 Ario35 23 Ario28 212 2 16 212 &HLDGS. 211 プロフィール - Ario 業績概要 世界の小売業データ 国内の小売環境 3, 1, 2,999 5 999 499 グループ事業戦略 212 2 主要事業会社の営業データ 844 12 1 8 4 2
seven&i_j
 - Ario 199 2 & 211 2 38 211 3 21 11 1,m 2 1 1 3 7 27 Ario27 23 117Ario 4 211 2 16 211 プロフィール &HLDGS. 21 業績概要 - Ario 世界の小売業データ 国内マーケットシェア 3, 1, 2,999 5 999 499 国内の小売環境 (211 2) グループ事業戦略 831 12 1 8 4 2 919
Annual Report 2009
 Creating New Value 1 3 5 7 9 11 25 25 28 31 33 35 76 77 79 80 43 54 55 56 75 43 45 48 51 53 1 3 9 11 13 37 37 38 39 40 41 17 P3~6P12Q2P25~36P43~49 P51~74 P14~15Q4Q5P17~24P27 P30P32P34P36 P16Q6Q7 P6P10P12Q1P18P25~36
注記事項 (1) 期中における重要な子会社の異動 ( 連結範囲の変更を伴う特定子会社の異動 ) : 無 新規 社 ( 社名 ) 除外 社 ( 社名 ) (2) 会計方針の変更 会計上の見積りの変更 修正再表示 1 会計基準等の改正に伴う会計方針の変更 : 有 2 1 以外の会計方針の変更 : 無 3
 期中における重要な子会社の異動 ( 連結範囲の変更を伴う特定子会社の異動 ) : 無 新規 社 ( 社名 ) 除外 社 ( 社名 ) (2) 会計方針の変更 会計上の見積りの変更 修正再表示 1 会計基準等の改正に伴う会計方針の変更 : 有 2 1 以外の会計方針の変更 : 無 3") 平成 29 年 3 月期決算短信 日本基準 ( 連結 ) 平成 29 年 4 月 28 日 上場会社名 ヤマトホールディングス株式会社 上場取引所 東 コード番号 9064 URL http://www.yamato-hd.co.jp/ 代表者 ( 役職名 ) 取締役社長 ( 氏名 ) 山内雅喜 問合せ先責任者 ( 役職名 ) 専務執行役員財務戦略担当 ( 氏名 ) 芝﨑健一 TEL 03-3541-4141
平成 29 年 3 月期決算短信 日本基準 ( 連結 ) 平成 29 年 4 月 28 日 上場会社名 ヤマトホールディングス株式会社 上場取引所 東 コード番号 9064 URL http://www.yamato-hd.co.jp/ 代表者 ( 役職名 ) 取締役社長 ( 氏名 ) 山内雅喜 問合せ先責任者 ( 役職名 ) 専務執行役員財務戦略担当 ( 氏名 ) 芝﨑健一 TEL 03-3541-4141