大和ハウスグループ アニュアルレポート2009
|
|
|
- のぶあき すみい
- 4 years ago
- Views:
Transcription

1 CEO COO CFO 18
2 19
3 Dear Stakeholders Building a New Era with Heart 20
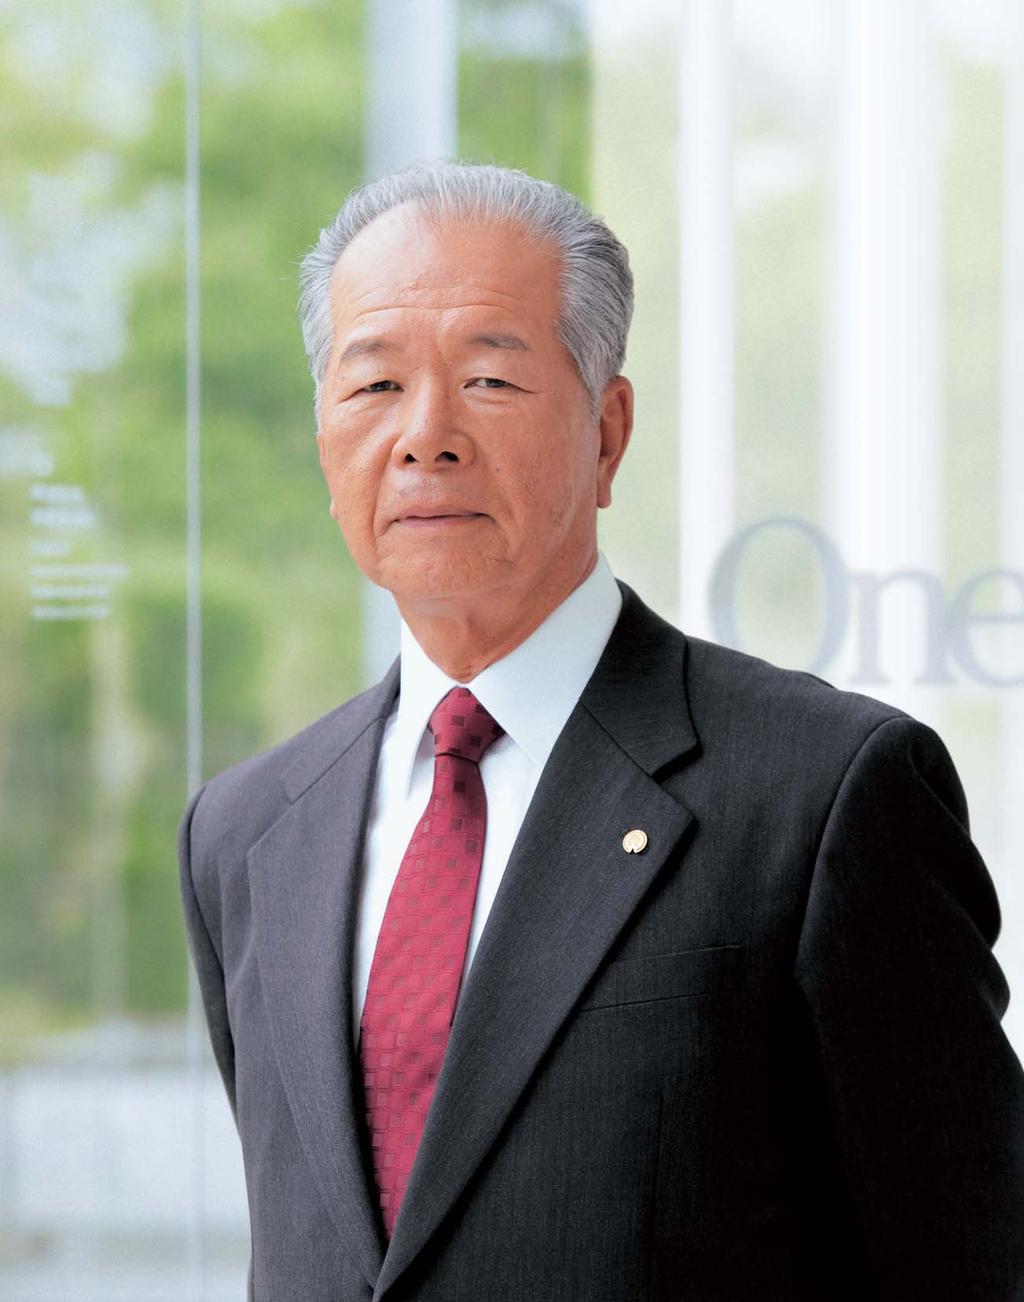
4 Challenge % GDP % 1 6, % % % ROE 0.7%9.0% CEO Daiwa House Group Annual Report
5 Group Performance /2008 1,690,956 1,709,254 1,618, % 73,580 89,120 85, % 39,855 61,290 89, % 4,170 13,079 46, % 1,810,573 1,791,052 1,630, % 607, , , % % 1 1, , , % % % ROE % ROA % % , ,365 1,528 1,618 1,709 1, Daiwa House Group Annual Report 2009
6 1.1% down 6.3% 4.5% % down 31.0% 46.9% 6 ROE 1.3 down % 2008 In JAPAN GDP 3.2% 3.5% % 3.5% 3 3.2%4.7% 0.3% 103 9, up 3 1.1% 1 2 ROE % , % , , , , Daiwa House Group Annual Report


7 Business Outline % % 6.3% 5, % 4.5% 9, % % % % % , % % % 24 Daiwa House Group Annual Report 2009


8 % 5.6% % 1.4% % % % 0.4% 1, % % % % % Daiwa House Group Annual Report
9 Share Information , ,900,000, ,921,851 35, % 36, , G 29, , UFJ 15, , , , , , % 10,000, ,646, ,000, ,856, ,000 85,973, ,000 25,994, ,000 34,774, ,000 3,676, % 46.2% 0.9% 10.6% 27.3% 15.0% % % 45.0% 42.6% 8.2% 4.2% 26 Daiwa House Group Annual Report 2009
10 2,500 2,000 1,500 1, ,000 90,000 60,000 TOPIX TOPIX 2,000 1,500 1, , ,055 2,260 2,055 1,330 1,141 1, ,040 1, , , , , TOPIX , ,330 9 TOPIX , PER PBR Daiwa House Group Annual Report
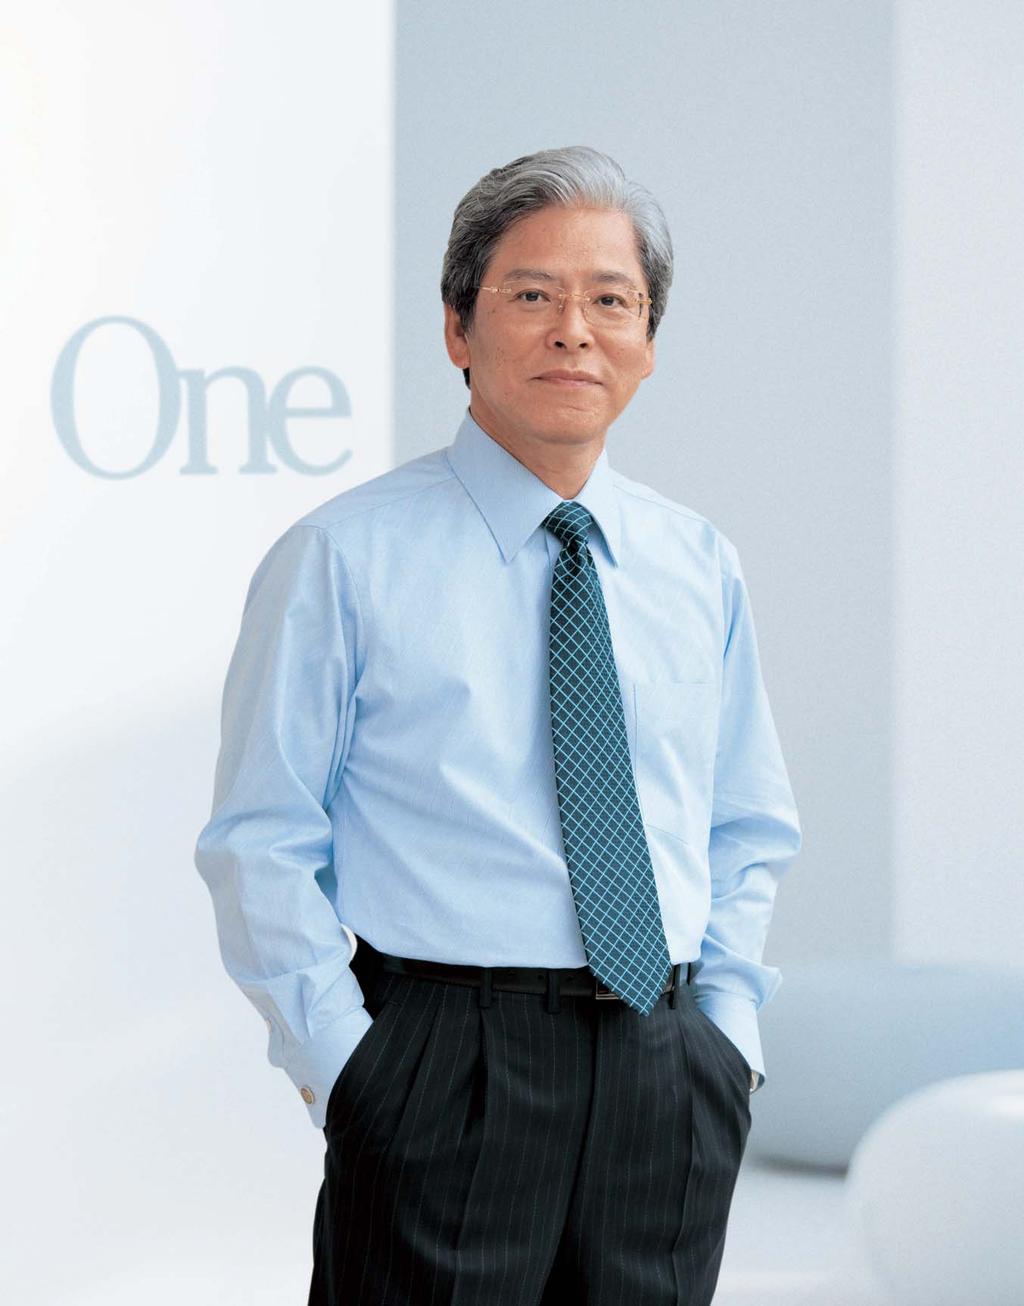
11 Message from the CEO Heart Makes All the Difference 28 Daiwa House Group Annual Report 2009
12 29


13 NY London % Down TOPIX 36.2% Down NY 38.0% Down FTSE 27.0% Down DAX 30.4% Down CAC % Down 30.9% Down Daiwa House Group Annual Report 2009


14 ,000 CO2 CO2 % % Osaka San Diego New York IMF CO CO2 Daiwa House Group Annual Report
15 Housing 80 5, Business m 2 98% Life 32 Daiwa House Group Annual Report 2009


16 1 6, , Housing 1 Business , Life 23 m Daiwa House Group Annual Report
17 Daiwa House Group Annual Report 2009

18 1CYBERDYNE HAL TM 40% 2007 CEO Daiwa House Group Annual Report
19 36
20 Message from the COO Let s Move Hearts! Challenge Daiwa House Group Annual Report
21 Challenge % % CAGR Daiwa House Group Annual Report 2009
22 % , % 45% % % 1 % % Daiwa House Group Annual Report
23 CO % up 528, % down 81 68, , Daiwa House Group Annual Report 2009
24 77.6% 13.1% % 77.6% 66.4% 13.1% % % % 56.0% 51.0% 28.7% % 3 Daiwa House Group Annual Report
25 CO2 LED ,330,000 30, Daiwa House Group Annual Report 2009

26 4,600 3, Challenge COO Daiwa House Group Annual Report
27 Message from the CFO Our Sources of Strength , Daiwa House Group Annual Report 2009
28 45
29 2008 D/E 20081, % 3,445 D/E , , , , , ,611 1,006 11,493 1,202 7, , , ,726 1,116 8,305 1,732 6, , , ,000 1, , , , , , , ,199 1, ,445 1, Daiwa House Group Annual Report 2009
30 0.50 1,000 D/E ,098 1, , , , , , , , ,098 0 D/E( ) 2.5 A B 2.0 A C B B C A A + AA + Daiwa House Group Annual Report
31 D/E ,800 4,700 4,600 3, NOI 7.0%IRR 8.5% M&A M&A 300 4, ,800 1,200 3, , Daiwa House Group Annual Report 2009

32 3 J-REIT J-REIT 3 J-REIT J-REIT J-REIT J-REIT J-REIT 1 7,000 1 CFO Daiwa House Group Annual Report
33 Group Companies Daiwa House Group Annual Report 2009

34 75% 99.6% 95.3% 73.5% 60% 33% Daiwa House Group Annual Report


35 Presidents of Principal Subsidiaries Daiwa House Group Annual Report 2009


36 ESCO SC 25 ESCO 3S Daiwa House Group Annual Report


37 Daiwa House Group Annual Report 2009


38 DIY No.1 Daiwa House Group Annual Report


39 NAS J-REIT 56 Daiwa House Group Annual Report 2009


40 Daiwa House Group Annual Report


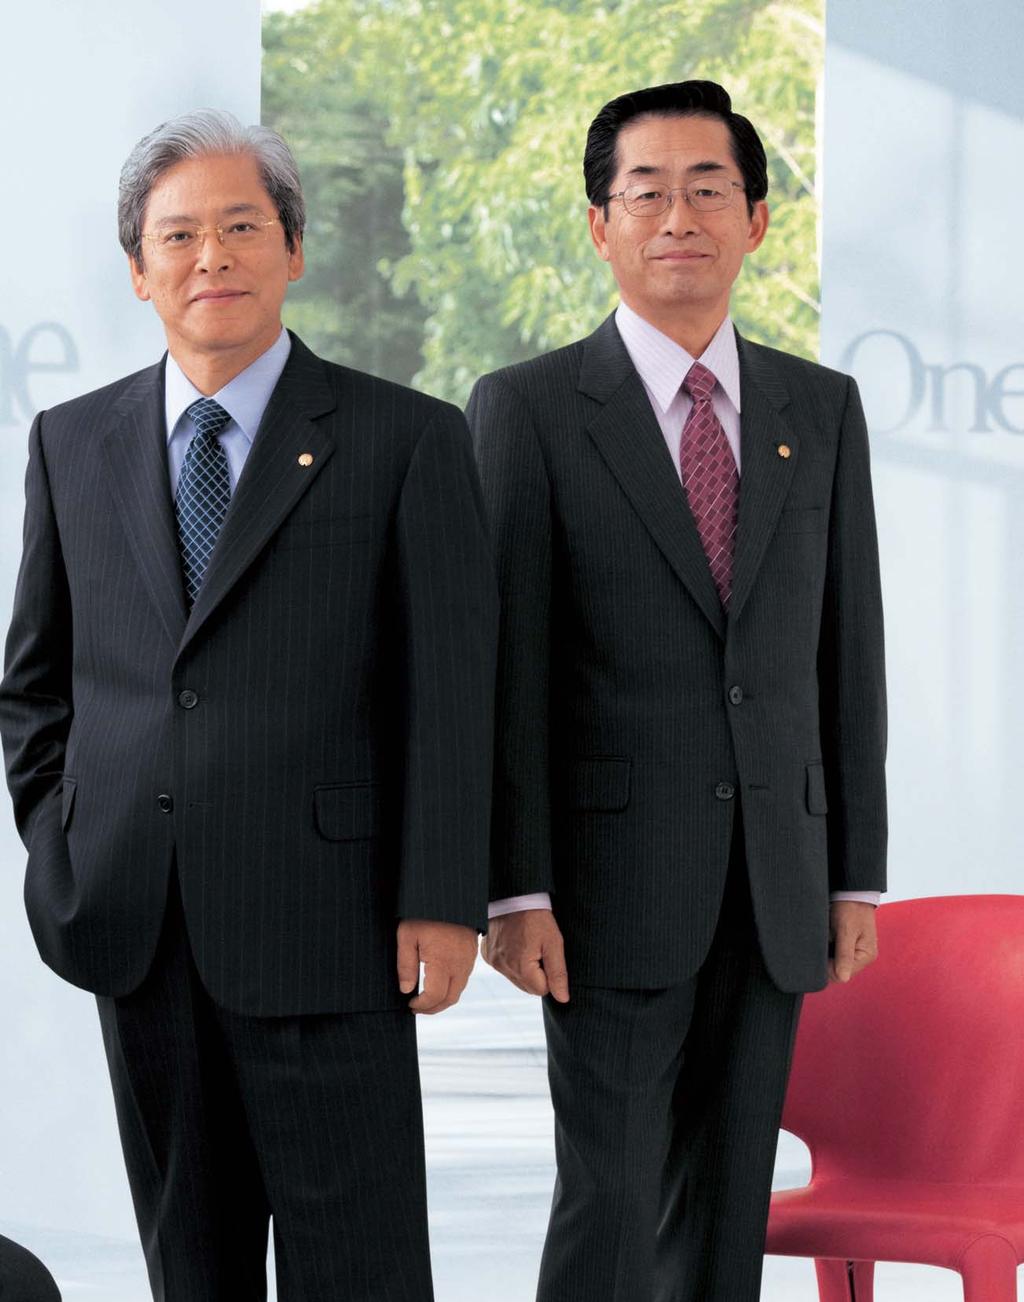
41 ne One Daiwa House Group Annual Report

42 One Daiwa House Group Annual Report

43 HAL TM 1 ne One Daiwa House Group Annual Report

44 Daiwa House Group Annual Report Robot Suit HAL CYBERDYNE
大和ハウスグループ アニュアルレポート2006
 Heart goes on 26 Contents 1 8 1 14 16 18 Vision 24 3 36 4 41 43 44 Commitment 58 Action 73 14 16 19 136 anywhere 2 Daiwa House Group anytime 3 anyone 5 We Build Hearts 8 Daiwa House Group Dear Stakeholders
株式会社フジテレビジョン
 66 184118930 Fuji TV Report Cover Contents 2 Top Message 3 Top Interview 6 Corporate Business Plan 7 Fuji TV Outline 10 Special Report 11 Consolidated Financial Statements 13 Non-Consolidated Financial
大和ハウスグループ アニュアルレポート2007
 2007 Bring on the Future At a Glance 3.7 3.8 4.2 28.8 (%) 59.5 Challenge 2005 2004 2005 2006 1 3,659 1 5,289 1 6,184 742 1,030 893 ROE 7.9% 8.2% 7.5% 2006 2007 3.2% up 11,596 11,233 15,289 16,184 5.9%
(6) (111) (148) (129) (169) CAPCOM ANNUAL REPORT
 (111) (148) (129) (169) CAPCOM ANNUAL REPORT") 62 63 65 69 71 72 73 74 91 61 CAPCOM ANNUAL REPORT 213 22 26 276 143 92 13 113 73 122 (6) (111) (148) (129) (169) 23 24 25 27 28 29 21 211 212 213 CAPCOM ANNUAL REPORT 213 62 63 CAPCOM ANNUAL REPORT 213
62 63 65 69 71 72 73 74 91 61 CAPCOM ANNUAL REPORT 213 22 26 276 143 92 13 113 73 122 (6) (111) (148) (129) (169) 23 24 25 27 28 29 21 211 212 213 CAPCOM ANNUAL REPORT 213 62 63 CAPCOM ANNUAL REPORT 213
平成22年12月期(第9期)決算説明資料
決算説明資料") MID 9 22 7 1 22 12 31 MID http://www.midreit.jp/ 2 MID 3 70% 70% 21 OBP OBP IMP Value Up NOI MID MID MID MID MID MID MID 5 23 1 31 92.75 MID MID MID 100 MID 23 1 31 MID MID22 3 22400 22 3 22 9 22 4 22
MID 9 22 7 1 22 12 31 MID http://www.midreit.jp/ 2 MID 3 70% 70% 21 OBP OBP IMP Value Up NOI MID MID MID MID MID MID MID 5 23 1 31 92.75 MID MID MID 100 MID 23 1 31 MID MID22 3 22400 22 3 22 9 22 4 22
4% P % 11.1%1, % %1, %1, % 3.5%1, % %1, % Santen Ph
 Financial Section 11 5 54 56 58 59 6 63 http://www.santen.co.jp/ja/ir/document/securities.jsp Santen Pharmaceutical Co., Ltd. Annual Report 215 49 4% 215 3 214 3 P.8 2 98.4% 11.1%1,592 62 12.6% 25 69 1.6%1,618
平成21年12月期(第7期)決算説明資料
決算説明資料") MID 7 21 7 1 21 12 31 MID http://www.midreit.jp/ MID 2 3 70% 70% 21 OBP OBP IMP Value Up NOI MID MID MID MID MID 27 MID MID MID URL http://www.mid.co.jp/ 2009 3 5 21 10 21 12 MID MID MID LCM Life Cycle
MID 7 21 7 1 21 12 31 MID http://www.midreit.jp/ MID 2 3 70% 70% 21 OBP OBP IMP Value Up NOI MID MID MID MID MID 27 MID MID MID URL http://www.mid.co.jp/ 2009 3 5 21 10 21 12 MID MID MID LCM Life Cycle
untitled
 Report 214 21412 FEATURE-1 1 HORIBA FPD HORIBA Report 214 2 FEATURE-1 HORIBACSR HORIBA HORIBA 1945 195 1955 196 1965 197 1975 1945 1953 197 1974 1971 195 ph 1964 M EXA 19771978 3 1,53 172 198 1985 199
C O N T E N T S 1. 2. 3. 4. 5. 6. 7. 8. 9. 10. 11. 12. 13. 14. 15. 16. 17. 18. 2009 Annual Report
 C O N T E N T S 1. 2. 3. 4. 5. 6. 7. 8. 9. 10. 11. 12. 13. 14. 15. 16. 17. 18. 2009 Annual Report 1 1 2009 Annual Report 1. 2. 2 2 2009 Annual Report 3 3 2009 Annual Report 3. 1980 1991 1992 1993 1994
18年度石見美術館年報最終.indd
 A Annual Report Annual Report B 1 Annual Report Annual Report 2 3 Annual Report Annual Report 4 Annual Report 5 Annual Report 6 7 Annual Report Annual Report 8 9 Annual Report Annual Report 10 11 Annual

コマツAR (本文)
") 01 04 p14 p16 Face to Face Innovation through Teamwork 07 13 p24 p28 22 p18 p30 p32 30 34 p20 37 89 90 92 ON THE RECORD 2 2,430 18.5% 3,328 36.0% 01 14.8 % 1.9 3,222 36.2% 2,087 26.8% ON THE MOVE 14.8%
01 04 p14 p16 Face to Face Innovation through Teamwork 07 13 p24 p28 22 p18 p30 p32 30 34 p20 37 89 90 92 ON THE RECORD 2 2,430 18.5% 3,328 36.0% 01 14.8 % 1.9 3,222 36.2% 2,087 26.8% ON THE MOVE 14.8%
IT /
 Corporate Outline 212 1 2 3 4 6 9 1 11 12 13 15 16 18 22 23 24 IT / 26 28 32 36 38 4 41 42 43 44 45 &HLDGS. &HLDGS. 46,6 15,6 &HLDGS.1 4,8 1,7 プロフィール 185 164 196-188 1,64 8 5 2 4 2 3-14,5 173 176 26 486-469
& IT/ IT
 C O R P O R A T E O U T L I N E 2 8 &-3 25 9 1 1 IT/7 1 2 3 4 6 8 1 11 12 13 14 16 2 21 22 IT 24 25 28 32 34 36 37 38 39 4 41 42 43 44 45 46 &HLDGS. &HLDGS. &HLDGS.1 35, 13, 2,8 1,4 76 97 69-6 7 3 2 2
株式会社フジテレビジョン
 67 194119930 Cover 2 Top Message 3 Top Interview 6 Topics 7 Fuji TV Outline 11 Consolidated Financial Statements 13 Non-Consolidated Financial Statements 14 Corporate Social Responsibility Report 15 Group/Network

平成21年6月期(第6期)決算説明資料
決算説明資料") MID 6 21 1 1 21 6 30 MID http://www.midreit.jp/ MID 2 3 70% 70% 21 OBP OBP IMP Value Up MID NOI AETOS MID MID MID MID MID 27 U R L http://www.mid.co.jp/ 2009 3 5 6 7 6 4 20 1 1 20 6 30 5 20 7 1 20 12
MID 6 21 1 1 21 6 30 MID http://www.midreit.jp/ MID 2 3 70% 70% 21 OBP OBP IMP Value Up MID NOI AETOS MID MID MID MID MID 27 U R L http://www.mid.co.jp/ 2009 3 5 6 7 6 4 20 1 1 20 6 30 5 20 7 1 20 12
 18725 136 2008 3 4 6 8 10 16 18 24 40 41 6 42 43 54 59 75 76 77 CSR 30 34 38 200620072008 3 4.27,235 26.9635 1.68.8 ROE2.69.2 1234.0 1 2006 2007 2008 2008/2007 2008 670,957 694,594 723,485 +4.2% $7,220,409
LIFULL アニュアルレポート 2017
 LIFULL LIFULL ANNUAL REPORT 2017 Contents 2 4 6 12 16 Vision and Strategy 18 LIFULL 20 LIFULL Value Model 22 22 24 26 28 28 30 30 34 CFO&CSO Fact Data 38 40 3 41 42 44 45 2017 4 1 LIFULL ANNUAL REPORT
1 2
 ( ) ( ) ( ) 1 2 59 2 21 24 275 43 3 26 486 103 27 28 98 105 104 99 1 48 25 29 72 14 33 11-10 3 11 8 14,663 4 8 1 6.0 8 1 0.7 11-6 27 19 22 71 5 12 22 12 1,356 6 4,397 3 4 11 8 9 5 10 27 17 6 12 22 9
Annual Report 2018 アリアンツ生命保険会社の現状
 Annual Report 218 [21741218331] Annual Report 218 Content 1 2 217 3 4 217 6 6 1 13 14 5 17 18 32 51 55 63 Annual Report 218 18978,8 284 2187 1 Annual Report 218 2183 URL Allianz Life Insurance Japan Ltd.
ROE
 26 49 41 26 1,074 159 3 1,074 1,200 26 10 10 11 10 589 54.8% 159 26 10 10 11 10 86 54.1% 26... 1... 2... 2... 2... 3... 5... 6... 6... 7 ROE... 9... 10... 11... 11... 13... 14... 14... 15... 15... 16...
Microsoft Word - ②(添付資料)家庭の夏期節電実態調査の結果について
家庭の夏期節電実態調査の結果について") CO 2 1. 2012 CO 2 CO 2 CO 2 2. 2012 9 28 10 1 8,241 CO 2 3. (1) 2012 2.7%CO 2 1% 1 2 5.8% 3.7% (2.8%)(2.8%) 6 4 5% 1 3 7 5%3 (2) 2012 32%2011 21 (39%)(38%)(37%) 8 2011 (+17.9 ) (+11.9 )(+9.3 )2012 8 (-14.9
CO 2 1. 2012 CO 2 CO 2 CO 2 2. 2012 9 28 10 1 8,241 CO 2 3. (1) 2012 2.7%CO 2 1% 1 2 5.8% 3.7% (2.8%)(2.8%) 6 4 5% 1 3 7 5%3 (2) 2012 32%2011 21 (39%)(38%)(37%) 8 2011 (+17.9 ) (+11.9 )(+9.3 )2012 8 (-14.9
7532_05arj.pdf
 Don Quijote Evolving with Customers 25 25 P ROFILE 1989 1 24 DonQ 22 1725 6 C ONTENTS 2 4 7 14 33 35 Distinctive Advantages uijote 3 1,m 2 3 5m 2 24 3 1 U.S. 6 31 25 24 25 232,778 192,84 $2,14 1,814 1,611

CONTENTS Summer 2016
 2016 Summer 2015.4.1 >>> 2016.3.31 CONTENTS 2 3 9 13 15 17 18 1 Summer 2016 Message from the CEO President Yuichi Takahashi Summer 2016 2 3 Summer 2016 Summer 2016 4 5 Summer 2016 6 Summer 2016 7 Summer
14 6 153
 10 152 14 6 153 154 155 ESCO ESCO ESCO ESCO ESCO ESCO 34 ESCO ESCO ESCO ESCO ESCO ESCO ESCO 156 ESCO ESCO ESCO ESCO ESCO ESCO ESCO ESCO ESCO 157 ESCO 158 159 ESCO 160 161 162 2010 CO 163 164 ( ) 165 166
株式会社フジテレビジョン
 FUJI TV REPORT 66 184119331 COVER Contents 2 Top Message 3 Top Interview 7 Fuji TV Outline 11 Corporate Social Responsibility Report 13 Special Report 15 Consolidated Financial Statements 18 Non-Consolidated
1) IT IR CSR 120 DAIWA SECURITIES GROUP ANNUAL REPORT 2010
 IT IR CSR 120 DAIWA SECURITIES GROUP ANNUAL REPORT 2010") p120 p126 p130 p131 p133 DAIWA SECURITIES GROUP ANNUAL REPORT 2010 119 1) 2010 7 1 IT IR CSR 120 DAIWA SECURITIES GROUP ANNUAL REPORT 2010 121 DAIWA SECURITIES GROUP ANNUAL REPORT 2010 CEO COO SMBC PI
p120 p126 p130 p131 p133 DAIWA SECURITIES GROUP ANNUAL REPORT 2010 119 1) 2010 7 1 IT IR CSR 120 DAIWA SECURITIES GROUP ANNUAL REPORT 2010 121 DAIWA SECURITIES GROUP ANNUAL REPORT 2010 CEO COO SMBC PI

26.2月号indd.indd
 No.639 334,300 44.7 840,700 885,000 669,700 705,000 631,700 665,000 6 1.40 12 1.55 460,000 2.95 415,000 395,000 172,200 172,200 140,100 140,100 6 1.225 0.645 12 1.375 0.645 2.600 1.290 12 10

総合チャート集(株価・為替・商品・金利・REIT等)
") 21 12 17 2 5 7 9 1 WTI NY S&P MLP S&P BDC 11 12 13 1 15 REIT 1 1 22, 21,37.3 2, 1, 1, 1, 12, 1,,, 2,1.51 22, 27 1 121 12 2 2, 1/9 2, 2,12. 27 1 121 12 2 3, 1/9 2,73.5 2, NY 3 1, 1, 1,, 9/3 7,173.1 / 2
21 12 17 2 5 7 9 1 WTI NY S&P MLP S&P BDC 11 12 13 1 15 REIT 1 1 22, 21,37.3 2, 1, 1, 1, 12, 1,,, 2,1.51 22, 27 1 121 12 2 2, 1/9 2, 2,12. 27 1 121 12 2 3, 1/9 2,73.5 2, NY 3 1, 1, 1,, 9/3 7,173.1 / 2
The Chain of Choice FC2008 FC Q&A Being the Chain of Choice for Franchise Owners FC FC Q A CSR
 Our Overriding Goal 2008 2008 2 01 02 03 04 12 The Chain of Choice FC2008 FC Q&A Being the Chain of Choice for Franchise Owners FC 18 21 22 24 26 27 71 72 73 2008FC Q A CSR The Chain of Choice FC CVS FC

untitled
 http://www.arte-hd.com 0 1 15 15 2.3 35 1515 1214 2.3 1214 p16 15 2 2001 (14) 2002 (15) 168 2003 (16) 2004 (17) 2004.8) 2005 (18) ROE 2006 (19) SD2007.1 NYNY2006.7 M&A M&A 3 2007 (20) 2008 (21) [81] 67.8

TG(.a)AR05_...I
AR05_...I") Winning thevalue Challenge 2005 Contents 01 Face-to-Face with Customer Value 06 07 08 10 15 Enhancing Value Every Day 24 Our Basis for Solidifying the Value 31 60 61 D y n a m i c, R e l i a b l e Face-to-Face
Winning thevalue Challenge 2005 Contents 01 Face-to-Face with Customer Value 06 07 08 10 15 Enhancing Value Every Day 24 Our Basis for Solidifying the Value 31 60 61 D y n a m i c, R e l i a b l e Face-to-Face
 Lipper Market Weekly 6,000 7,000 8,000 9,000 10,000 11,000 12,000 09/03/30 09/05/05 09/06/10 09/07/16 09/08/21 09/09/28 09/11/03 09/12/09 10/01/14 85 90 95 100 105 ( ) 01 2010/2/19 2010/2/12 2010/1/29
【アニュアルレポート】
 Unparalleled Innovation and Customer Satisfaction For Local Communities in Japan and Increasingly Overseas 2012 2012 3 457 BIZ-e- 6 AA Yamato Holdings Co., LTD. 2 4 5 12 14 16 16 18 BIZ- 20 22 e- 24 26

0506jh.pdf
 6 3 9 6 3 12 31 6 3 1-8212 4 5 171-858 7 7 12-77-696 25 1 1 UFJ http://www.donki.com/ir/ 12-86-449 24 2-6-1163-235 35. 3-5381-7532. 3-5381-766 http://www.donki.com 25 24 7 125 6 3 P1 P3 P5 P6 P7 P9 P1
18 5 25 (1) (2) 18 5 25 (CFO) (CFO) (CAO) (CAO) 18 5 25 1
 (2) 18 5 25 (CFO) (CFO) (CAO) (CAO) 18 5 25 1") 18 4 12 & 3382 TEL0362383000 18 4 12 18 5 25 - 18 5 25 (1) (2) 18 5 25 (CFO) (CFO) (CAO) (CAO) 18 5 25 1 2 18 5 25 3 18 5 18 (1) (2) 18 5 18 18 5 18 4 18 5 18 5 6 18 5 18 (1) (2) 18 5 18 ( ) ( ) ( ) 18
18 4 12 & 3382 TEL0362383000 18 4 12 18 5 25 - 18 5 25 (1) (2) 18 5 25 (CFO) (CFO) (CAO) (CAO) 18 5 25 1 2 18 5 25 3 18 5 18 (1) (2) 18 5 18 18 5 18 4 18 5 18 5 6 18 5 18 (1) (2) 18 5 18 ( ) ( ) ( ) 18
02 CSR REPORT 09
 02 CSR REPORT 09 CSR REPORT 09 03 04 CSR REPORT 09 CSR REPORT 09 05 06 CSR REPORT 09 REPORT 01 CSR REPORT 09 07 REPORT 02 08 CSR REPORT 09 REPORT 03 CSR REPORT 09 09 MESSAGE 10 CSR REPORT 09 MESSAGE CSR

『赤すぐ』『妊すぐ』<出産・育児トレンド調査2003>
 79.9 1.6 UP 86.6% 7.0 UP 61.3% 12.7UP 18-24 3 66.6 3.0 UP 38.7 0.7 UP 14.8 1.9 UP 13.3 0.3UP 4 1 024 1.23 0.01down Topics 5 79.9 1.6UP 7.0 UP 12.7U 3.5 0.4 UP 3.4 0.4 UP 6 73.1% 5.7 UP 75.0% 71.2% 7 53.9%
Q A Q A 1
 IHI Report Q A Q A 1 Q A Q A To Our Shareholders 2 706 803 42 9 1,030 790 66 17 1,894 1,716 55 103 3 Business Review by Segment 1,350 57 45 1,310 704 34 16 755 103 31 16 41 763 16 10 554 4 Performance
Annual Report 2015 アリアンツ生命保険の現状
 Annual Report 215 [21441215331] Annual Report 215 Content 1 2 214 3 4 214 6 6 1 13 14 5 17 18 32 52 56 64 Annual Report 215 189125 78,5 284 2157 1 Annual Report 215 2153 URL Allianz Life Insurance Japan
80% No.1 3... 1... 2... 5... 5... 9... 13... 14... 22... 22... 23... 24... 26... 27... 53... 54
 2005 2005 3 Looking ahead 80% No.1 3... 1... 2... 5... 5... 9... 13... 14... 22... 22... 23... 24... 26... 27... 53... 54 20052004 3 2005 3 2004 3 2005/2004 2005 3... 92,696 89,858 3.2% $ 863,175... 18,982
2014度事業報告書p000_018.indd
 2014 Junior Chamber International Japan Annual Report 2014 Junior Chamber International Japan 2014 Junior Chamber International Japan Annual Report 2014 Junior Chamber International Japan Annual Report
STRENGTH Business Portfolio ALM 6 Sony Financial Holdings Inc. 2018
 STRENGTH Business Portfolio ALM 6 Sony Financial Holdings Inc. 2018 11Visa Sony Bank WALLET Sony Financial Holdings Inc. 2018 7 Consistently Strong GROWTH 1 5,036 668 SFH 3 31 1 2004 4 2007 10 1 ALM 2005
4 4 4 4 4 4 4 4 4 4
 s s s s 4 4 4 4 4 4 4 4 4 4 4 4 4 4 4 4 4 4 4 4 1 Small Business Information Shiga No.534 1 2 3 4 6 7 8 9 10 12 13 14 16 17 18 19 20 2 8/30 8/31 9/4 3 4 5 6 7 URL http://www.ps.web-sanin.jp/~sbmc/index.htm

OVERVIEW Our Sustainability ALSOK 1 ALSOK 1 P P.12 3 P.26 4 ALSOK 8 P.9
 CSR REPORT 2013 CSR 2013 2331 OVERVIEW Our Sustainability ALSOK 1 ALSOK 1 P.10 2 7 2 P.12 3 P.26 4 ALSOK 8 P.9 ALSOK ALSOK CSR 5 P.8 6 6 P.19 7 3 4 P.18 5 8 P.20 ALSOK CSR Report 2013 1 OVERVIEW Our Corporate
19..-H1-H4...qx3
 e e e e x avex avex avex avex avex avex avex avex avex avex avex avex avex av vex avex group avex avex avex avex holdings avex avex avex avex avex inc. avex avex avex avex avex avex avex avex avex avex
 1 2003 7 2005 6 2 1 2000 2002 2003 80.052 86.7 39 26.374 3 3 2 2 8 500 8 2008 6.4 10.3% 10 2008 3 11.7 10.6 9.9 9.3 3 1998 100 1999 3 71.2 2005 2007 17.9 14.1 1989 4 20 6 4 2004 1 4 5 5 ROA ROE 5 6 60
アニュアルレポート 2000
 2000 2000 3 3 31 1 : : 1 1 1999 2000 2000/1999 2000..................... 6,804,182 6,686,661 1.7% $63,082............................... 348,212 240,627 30.9 2,270............................. 377,691
01 Dear Our Shareholders
 avex group holdings inc. 21st Semiannual Business Report '07.04.01- '07.09.30 エイベックス グループ ホールディングス株式会社 第21期 中間報告書 自 平成 19 年 4 月 1 日 至 平成 19 年 9 月 30日 01 Dear Our Shareholders 02 Dear Our Shareholders 21th
パソナ '0808.qxd
 2007612008531 2 4 6 CSR 8 11 12 14 15 18 20 21 1 2 2007123 200 2 TOP MESSAGE One Pasona 6 PFCWEB One Pasona 30 10 One Mission,One Pasona 20088 STRATEGIES FOR THE FUTURE 10 90 1,300 = > = = = = = = = =
 1 2 4 6 8 10 12 20 22 26 28 30 34 36 42 44 46 48 50 54 56 58 60 62 64 2 3 4 5 6 12,403 3,253 26.2% 3,539 28.5% 1,934 15.6% 2,283 18.4% 487 3.9% 907 7.3% 7 OSAKA 810,000 1102 644 54 135 976 32,000 Amazon.co.jp
年次報告書2008年3月期
 Reliability in a Challenging Environment Creating Value for Clients Creating Value for Business Partners Creating Value for Society ORIX is generating medium- and long-term growth by enabling value creation

600, % 500, , , % 400, , , , , , , , ,795 25,849 29, % 100% 170,054 50
 2003 20031113 N CEO 2003 20031113 600,000 300% 500,000 512,276 464,057 250% 400,000 300,000 200,000 100,000 0 284,932 270,810 224,121 180,710 177,795 25,849 29,200 150% 100% 170,054 50% 45,084 0% 1998
NIKON REPORT2018
 3 31 216 3217 3IFRS 29 21 211 212 213 214 879,719 785,499 887,513 918,652 1,1,494 98,556 (561,642) (552,49) (575,536) (567,) (663,59) (63,568) (269,892) (246,944) (257,924) (271,571) (295,983) (287,46)
短信-1.PDF
 ROE 3 A B C A B MA 14 12 2 1 4 2 2,245 ( 192 ) 448 ( 54 ) 396 ( 108 ) 181 459 ( 159 ) 107 51 309 341 244 388 661 2,279 5,590 90 740 15 3 31 14 3 31 14 9 30 % % % 2,239,549 3,315,424 1,075,875 2,901,303


untitled
 2 6 26 http://www.nitto.co.jp/ 2 3 5 7 9 12 13 15 17 19 21 22 23 24 25 26 27 28 29 3 31 33 34 35 37 41 42 http://www.nitto.co.jp 1 2 3 4 http://www.nitto.co.jp/ 2,712 386 6,263 475 2,514 3,274 6,263 52
215 GDP 215 % UFJ % UFJ GDP *
 5 211 212 213 214 215 82.19 94.5 12.92 12.17 112.68 35,2 36,342 37,534 42,29 41,432 18,45 18,168 18,786 21,816 21,135 969 951 1,84 1,114 1,17 9,642 1,422 11,63 13,86 13,25 2,255 2,882 3,62 3,529 3,63 3,747
製品カタログ")
8% No
 Our vision... 24 24 3 8% No.1 3... 4 23-25... 6... 6... 8... 12... 14... 15... 16... 24... 25... 26... 28... 29... 53... 54... 55 for growth Santen Annual Report 24 1 for the future 2 Santen Annual Report
maiji2007_cover_j_0907
 27 CORPORATE PHILOSOPHY THE MEIJI DAIRIES GROUP CONTRIBUTES TO A HEALTHY AND HAPPY DAILY LIFE FOR OUR CUSTOMERS BY OFFERING NEW LEVELS OF VALUE IN FOOD. CONTENTS 2 4 6 1 1 11 12 13 14 16 18 19 2 22 23
文明no18.indb
 No.18, 20131-16 27 1997 2000 1 60 1993 53 53 20 2000 12 4 4 4 1960 GDP 2627% 1960 50% GDP 50% 70% GDP 70% 30% 20 50% 55% 60% 4 3 2003 50% 11 111 15 1946 1969 23 46 60 15 15 1960 15 11 2 1960 4.2% 3% 5%
.\...o...p*
 3311 2004 2003 2002 2004/2003 1... 220,331 212,241 214,838 3.8... 156,501 147,017 141,794 6.5... 9,824 12,810 13,370 23.3... 54,005 52,414 59,672 3.0... 52,955 51,001 59,698 3.8... 22,419 6,026 18,225
untitled
 Change and Innovation 214 213 1 215 3 Change and Innovation 3 resilience 2 13 23 43 67 Overview 2 4 6 8 1 12 213 1 213 215 Management Strategy 14 16 Our Operations 24 26 28 3 32 34 36 4 42 CSR & Governance
年次報告書2008年3月期
 P60 P107 3 1 3 2 3 12008 3 2 5 1 2008 3 78,592 290,743 227,020 23,521 128,616 88,445 16,756 300,361 1,154,054 78,592 105,465 227,020 23,521 15,747 7,389 16,756 129,885 1 604,375 106,140 185,278 112,869

untitled
 C O N T E N T S 02 06 07 08 09 11 12 14 16 17 18 2 0 0 8 W I N T E R 105 No. 20082 SG2009 President & CEO Teruo Asada 10312008220089 20082 Top Message 120082 2 1,064 1,392 46%5241,657 1,000 5 32%261 45
")


2
 from One 1 2 24 2 3 4 30 4 5 47 13 6 7 34 2 13 8 34.................................. 9 15-1-5 15-1-4 10 11 12 12 13 14 15 A ( 1) A A 2 B B 16 2 2 17 3 C C 18 3 19 ( ) 15 2 5 ( 56 2 16 20 2 5 ) (1) (2)


ニュースリリース 野村ホールディングス 組織の一部改正と役員・社員の異動について (PDF)
") News Release 2009 3 12 8604 2009 3 12 CEO: 1. 3 31 2. 3 31 3. 4 1 﨑 4. 4 1 (1) CEO CEO (2) 﨑 Deputy CEO CEO 2 Deputy CFO CEO COO N.V. CEO LIMITED CEO 5. 4 1 6. 4 1 3 2009 3 12 CEO: 1. 4 1 (1) (2) 7 3 2
News Release 2009 3 12 8604 2009 3 12 CEO: 1. 3 31 2. 3 31 3. 4 1 﨑 4. 4 1 (1) CEO CEO (2) 﨑 Deputy CEO CEO 2 Deputy CFO CEO COO N.V. CEO LIMITED CEO 5. 4 1 6. 4 1 3 2009 3 12 CEO: 1. 4 1 (1) (2) 7 3 2

キヤノンマーケティングジャパングループ CSR報告書 情報セキュリティ報告書
 1 Canon Marketing Japan Group 2 3 9 11 15 23 29 41 51 53 55 57 59 62 63 65 67 5 Corporate Social Responsibility Report 2008 2 3 Canon Marketing Japan Group Corporate Social Responsibility Report 2008 4
untitled
 1 Report 3 4 8 10 14 16 Topics 18 18 19 19 20 20 21 21 22 23 Information 25 25 2013.9 No.80 1 2 2013.9 No.80 Report 2013.9 No.80 3 4 2013.9 No.80 2013.9 No.80 5 6 2013.9 No.80 2013.9 No.80 7 8 2013.9 No.80
1 1907 10 8 4 30 5 1935 1 2 3-1 4-3 1: 1907 9 25 6 1868-1904 2 7 1985 431 1940 1940 4 1935 12 1902 5 6 7 2
 2007.03 1-26 432 1936 1 1938 11 1945 2 736 1939 40 3 1 (1911 7 2004 13-27 2 2001 91-101 3 1983 28 1999 1532 2000 218 1980 3 1 1907 10 8 4 30 5 1935 1 2 3-1 4-3 1: 1907 9 25 6 1868-1904 2 7 1985 431 1940

untitled
 Report 1 2 2 3 5 7 10 12 14 Topics 16 17 18 19 20 21 Information 25 25 Report 2015.9 No.86 1 2 2015.9 No.86 2015.9 No.86 3 4 2015.9 No.86 2015.9 No.86 5 6 2015.9 No.86 2015.9 No.86 7 8 2015.9 No.86 2015.9
CEO Passion for the Best 217 CEO 22 No Passion for the Best
 18 CEO 29 CFO 31 37 38 4 42 44 45 46 216 17 CEO Passion for the Best 217 CEO 22 No.1 2 3215 4 3 Passion for the Best 217 18 216 Passion for the Best 217 215 216 217 1 No.1 2 3 M&A 1 ROE: 1% 2 75% 1215
P. 2 P. 4 P. 5 P. 6 P. 7 P. 9 P.10 P.12 P.13 P.14 P.14 P.15 P.17 P.18 P.20 P P P P P.25 P.27 P.28 Copyright 2016 JAPAN POST BA
 201729 3 1 2016 8 12 P. 2 P. 4 P. 5 P. 6 P. 7 P. 9 P.10 P.12 P.13 P.14 P.14 P.15 P.17 P.18 P.20 P.21 10 P.22 11 P.23 12 P.24 13 P.25 P.27 P.28 Copyright 2016 JAPAN POST BANK CO., LTD. All Rights Reserved.
P. 2 P. 4 P. 5 P. 6 P. 7 P. 9 P P.11 P.14 P.15 P.16 P.16 P.17 P.19 P.20 P.22 P P P P P P P P P
 201628 3 2016 5 13 P. 2 P. 4 P. 5 P. 6 P. 7 P. 9 P.10 2016 P.11 P.14 P.15 P.16 P.16 P.17 P.19 P.20 P.22 P.23 10 P.24 11 P.26 12 P.27 13 P.28 14 P.28 15 P.29 16 P.30 17 P.31 P.33 P.34 Copyright 2016 JAPAN
AIG_pamph_hyousi2016_FUJI
 2016412017331 2017 2017 19187418 559 8,243 23,283 4,131 http://www.fujikasai.co.jp/ 2017331 111 CONTENTS 2 01 4 8 10 14 15 19 20 22 23 24 28 30 31 33 38 40 43 2017 AIG CEO 5 AIG AIU 2018112 AIG ACTIVE
Copyright 2017 JAPAN POST BANK CO., LTD. All Rights Reserved. 1
 Copyright 2017 JAPAN POST BANK CO., LTD. All Rights Reserved. 1 Copyright 2017 JAPAN POST BANK CO., LTD. All Rights Reserved. 2 60 50 40 30 20 10 0 20173 20183 Copyright 2017 JAPAN POST BANK CO., LTD.
第3世代入浴施設の考察と提言
 http//www.americaseikatsu.net/bathroom.html StudyUK http://www.studyuk.jp/uklife9.html AKITA http://www.norte.co.jp/yu/index.html 2002 3 20 2000 2003 3 14 2004 8 19 http://www.komenet.jp/gnk/index.html
Contributes to The Health of Individuals Worldwide
 ANNUAL REPORT 2008 Annual Report 2008 Our Contribution to Financial and Social Responsibility Contributes to The Health of Individuals Worldwide 2 4 10 16 17 20 22 29 30 32 37 38 40 47 54 64 66 70 102
YAMADA Business Consulting OUR POLICY YAMADA Business Consulting TOP MESSAGE 01 02
 YAMADA Business Consulting OUR POLICY YAMADA Business Consulting TOP MESSAGE 01 02 YAMADA Business Consulting ROUND-TABLE TALK YAMADA Business Consulting ROUND-TABLE TALK ROUND- TABLE TALK 01 03 04 YAMADA
86 DNA EPS EPS EPS EPS EPS EPS EPS EPS 80
 Section 02 18 19 86 DNA 1 2 3 2021 3 EPS 130 1960 1966 1991 1 EPS 103.2 2006 3 EPS 70.4 2007 3 EPS 12.9 2009 3 EPS 31.9 2011 3 2 EPS 86.4 2015 3 EPS 58.9 2017 3 EPS 80.2 1EPS 1931 1973 1 1980 1 1990 1