|
|
|
- こうご ふくだ
- 9 years ago
- Views:
Transcription
1 Annual 2002 Report
2
3 Financial Highlights ,581,399 2,750,418 2,680,611 19,372 28,402 26,494 11, $ , , ,220 6,807 4,030,596 4,232,011 4,172,459 30, ,681,406 1,848,710 1,810,842 12,618 28,129 18, $ $ , , ,981 5,955 2,738,973 2,884,547 2,793,067 20, ,140 27,837 25,620 1

4 To Our Shareholders 2
5 To Our Shareholders 3
6 To Our Shareholders 4
7 Current Topics 5
8 Products and Services at a Glance 69.4% 32.1% Products and Services at a Glance 9.5% 13.6% 4.7% 21.3% 9.6% 14.2% 4.7% 14.4% 2.1% 2.0% 6 7

9 8 9 Operation Highlights Operation Highlights

10 Operation Highlights Operation Highlights 10 11
11 12 13 Operation Highlights Operation Highlights

12 Business Review Business Review 1.3% 1.5% 11.0% 21.6% 5.7% 59.0% 14 15

13 16 17 Business Review Business Review

14 18 19 Business Review Business Review 0.6% 26.2% 43.1% 30.1%

15 20 21 Business Review Business Review

16 22 23 Business Review Business Review

17 Environmental Considerations Environmental Considerations 24 25
18 Research and Engineering Research and Engineering g/m Al (5 11%) 5%NaCl Mg (0 3%) Si Mg mass% 26 27
 Si 0 1 2 3 4 Mg mass% 26")
19 Research and Engineering Support of Music Culture and Sports 28 29

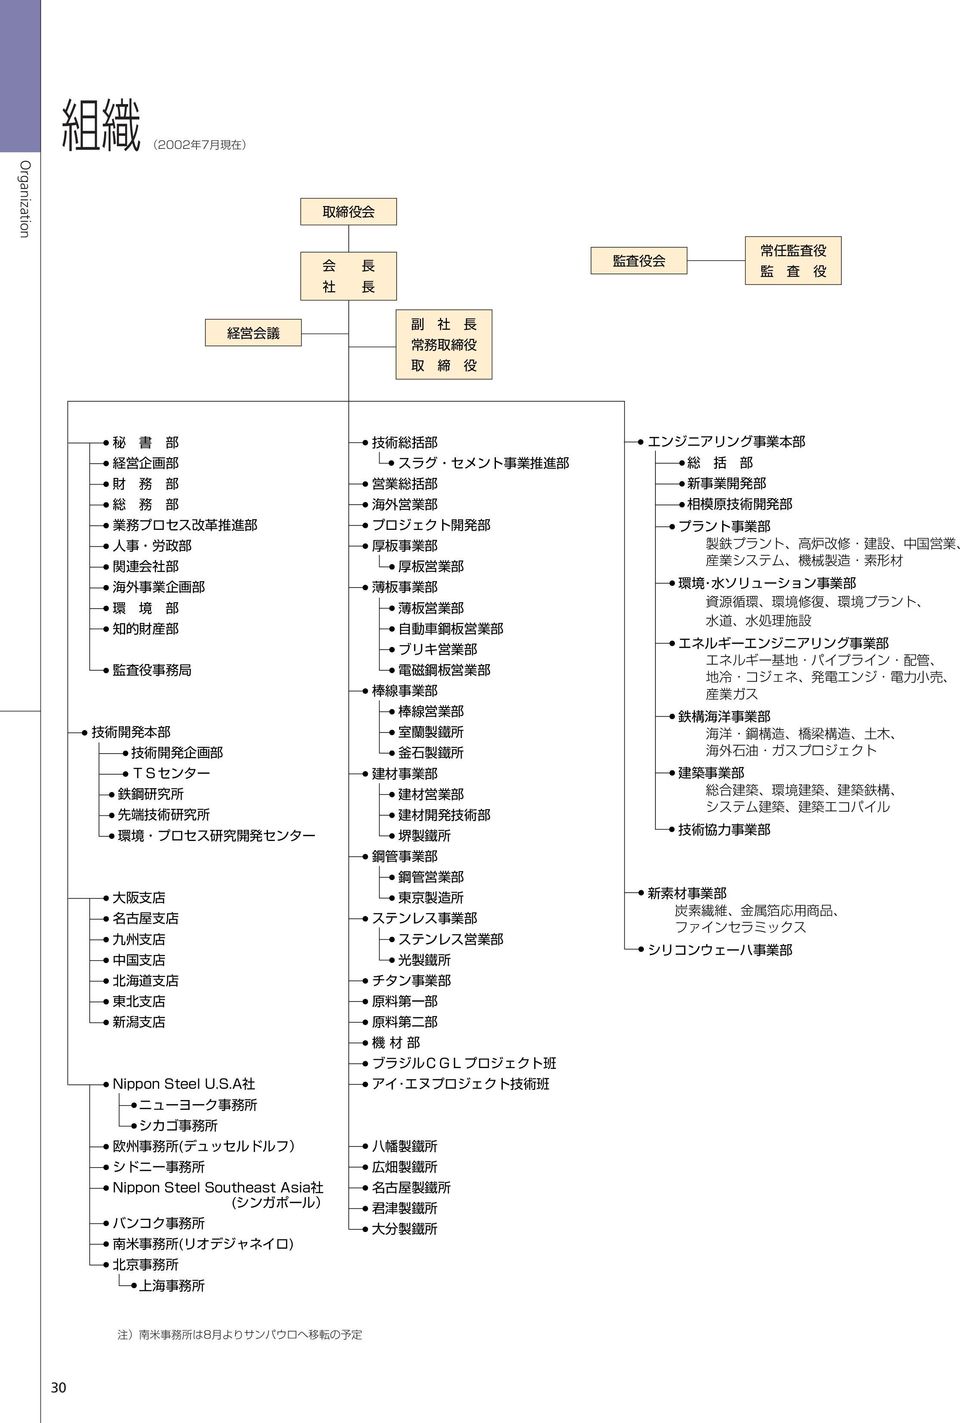
20 30 Organization
21 31 Chronology
22 Executive Management 32
23 FINANCIAL STATEMENTS
24 Ten-Year Summary Ten-Year Summary ,581,399 2,750,418 2,680,611 2,759,409 3,076,531 3,061,288 2,954,869 2,881,097 2,749,434 2,951,423 73, , ,296 92, , , ,429 92,269 10, ,964 16, ,374 64,687 15,282 86,537 80, ,593 12,193 36,725 29,022 25,079 49,403 2,171 14,096 39,234 25,148 56,961 17,863 59, ,402 26,494 11,173 11,478 5,945 3,450 54,538 3,971 54,093 1, , , , , , , , , ,882 1,045,444 4,030,596 4,232,011 4,172,459 4,489,753 4,670,669 4,509,536 4,527,304 4,547,466 4,346,286 4,475, , , , , , , , , , , , , , ,994 2,016,174 2,101,686 2,277,938 2,549,064 2,640,750 2,484,261 2,439,526 2,385,821 2,401,541 2,304, ,828,206 1,962,019 1,877,582 1,743,018 2,040,444 2,015,666 1,993,867 1,998,367 1,960,783 2,200, , , , , , , , , , , , , , , , , , , , , , , , , , , , , , , , ,445 61,251 59,440 56, , , , , , , ,231 (208,754) (196,745) (192,776) (349,005) (359,284) (355,498) (368,408) (362,329) (386,975) (395,366) 2,581,399 2,750,418 2,680,611 2,759,409 3,076,531 3,061,288 2,954,869 2,881,097 2,749,434 2,951, , ,536 73,257 65, , , ,135 63,013 53,480 79,263 9,913 7,287 12,209 11,972 10,610 35,510 28,158 33,992 48,190 37,781 15,576 16,320 20,787 16,975 15,766 10,379 11,574 8,378 5,263 8,140 11,806 10,590 5,119 10,559 3,278 10,504 9,770 5,311 19,333 26,491 26,504 13,748 1, ,000 9,782 17,796 16,066 2,624 4,468 4,629 1,731 1,384 1,262 1,120 (4,826) (6,159) 9,729 (2,240) 9,385 (2,430) 73, , ,296 92, , , ,429 92,269 10, , ,681,406 1,848,710 1,810,842 1,918,538 2,205,019 2,184,805 2,099,750 2,090,580 2,158,779 2,368, ,776 42,606 50, ,954 84,711 64,698 11,214 18,349 28,884 28,129 18, ,393 19,906 24,741 9,438 30,904 4, , , , , , , , , , ,979 2,738,973 2,884,547 2,793,067 3,051,391 3,150,110 3,145,249 3,145,269 3,229,979 3,229,945 3,335, , , , , , , , , , , , , , , , , , , , ,583 1,240,474 1,205,352 1,273,687 1,464,531 1,457,895 1,509,132 1,446,531 1,544,065 1,701,664 1,690, ,806,981 6,806,981 6,806,981 6,806,981 6,889,904 6,889,904 6,889,903 6,889,903 6,889,903 6,889, / / / / / / / / / / ,140 27,837 25,620 23,201 26,619 25,706 26,173 26,565 25,123 25,320 25,487 26,226 24,566 22,751 25,378 24,747 25,620 25,314 24,338 24,085 26,312 26,789 25,633 24,026 26,580 25,871 25,684 25,374 24,440 24, ,370 18,918 19,816 21,414 22,560 24,527 27,583 31,072 34,619 36,
25 Consolidated Statements of Income and Retained Earnings Consolidated Balance Sheets ,303,950 1,369,332 65,382 1,743,646 1,711,631 32,014 74, ,470 45, , ,954 4, , ,188 51, , ,281 58,183 1,255 4,842 3, ,000 20,000 96, , ,553 24, , ,000 2,492 40,331 30,320 10, , ,032 23, , ,851 47,357 5,318 5,318 ( )1,205 ( )2,893 1, , ,045 26,126 2,726,645 2,862, ,033 1,314,241 1,477, ,011 1,801,648 1,772,755 28, , , , , ,441 5, , ,765 3, , ,139 16, , ,169 6,422 27,922 28, ,162 76,429 26, , ,341 7, , ,907 5,023 92,557 81,781 10,775 49,253 68,541 19,288 15,474 27,147 11,672 36,713 39,440 2,726 5,226 6,936 1,710 3,057,888 3,188, ,997 10,248 18,240 7,991 1,970 1,970 65,557 63,430 2, ,522 1,062, , , , , , , , ,044 1, , ,518 41,123 36,759 4,364 7,488 5,675 1,813 64,686 71,596 6, , ,282 39,717 ( )11,519 ( )13,136 1,616 54,898 94,187 39,289 ( )18,822 ( )23,491 4, , ,696 72,524 ( )21 ( ) , ,695 72,545 4,030,596 4,232, ,415 4,030,596 4,232, , ,581, ,750, ,018 2,245,335 2,305,538 60, , ,234 19,214 2,508,355 2,587,773 79,417 73, , ,600 7,047 9,612 2,564 1,335 1,335 14,174 19,165 4,991 21,222 30,114 8,891 32,904 39,215 6,310 12,452 12,452 32,163 42,169 10,005 77,521 81,384 3,863 56,298 51,270 5,027 16, , ,628 15,626 15, ,234 26,439 24,205 22,367 68,705 46,338 14,690 14,690 1,023 1,023 54, ,977 57,058 7,732 5,255 2,477 72,952 10,376 62,576 8,134 6,981 1,153 6, , , ,349 5,851 26,228 26,228 1,259 2,774 1,514 3,255 3,255 2,183 2,183 3,132 3,132 96, ,948 77,203 25, , ,483 19,062 55,371 36,309 15,257 35,803 20, ,340 3,822 28, , , , ,671 15, ,210 10, ,185 1,185 11,483 10, , ,282 39,
26 Consolidated Segment Information Consolidated Statements of Cash Flows ,079 49, , ,987 7,047 9,612 32,904 39,215 3,174 14,384 2,197 2,309 12,452 1,335 1,562 26,102 72,336 7,073 6, ,409 22,367 68,705 7,279 12,555 15,894 15, ,035 12,970 3,255 53,870 2,124 17,601 27, ,525 30,858 45, , ,009 8,396 12,143 33,674 39,740 55,864 16, , , ,791, , , , ,087 53,507 2,581,399 2,581,399 36,463 49,304 9,942 77,988 27,311 7, ,754 (208,754) 1,828, , , , ,398 61,251 2,790,154 (208,754) 2,581,399 1,804, , , , ,894 59,794 2,718,841 (210,485) 2,508,355 23,482 9,913 15,576 10,379 10,504 1,457 71,312 1,731 73,044 2,963, , , ,898 72, ,858 4,194,152 (163,556) 4,030, ,693 2,008 4,754 17,264 1,160 7, ,701 (365) 197, ,202 1, ,442 1,720 19, ,763 (3,961) 195, ,925, , , , ,758 52,806 2,750,418 2,750,418 36,653 42,835 10,466 70,243 29,912 6, ,745 (196,745) 1,962, , , , ,670 59,440 2,947,163 (196,745) 2,750,418 1,846, , , , ,900 58,667 2,785,902 (198,129) 2,587, ,536 7,287 16,320 11,574 9, ,260 1, ,644 3,091, , , ,117 64, ,762 4,414,935 (182,923) 4,232, ,955 2,042 5,108 18,947 1,192 7, ,346 (358) 206, ,610 2,288 4,773 10,939 1,658 16, ,094 (2,745) 157,348 5,897 39,791 14,650 32, , ,014 28,917 26,054 3,750 10, , ,313 39,647 97,985 96,000 20,000 86,785 50, ,169 92, ,823 63,207 10,210 10,441 1, , ,686 4,184 5, ,731 49,592 49, , , , ,
27 Non-Consolidated Statements of Income and Appropriation of Retained Earnings Non-Consolidated Balance Sheets , ,750 16, , ,474 49,479 16,411 36,134 19,722 5,140 5, ,082 8,746 2, , ,317 10, , ,511 27, , ,526 14,080 68,659 71,573 2, ,000 20,000 96,000 97, ,824 6, , ,000 5,000 72,070 84,212 12,142 82,950 61,504 21,445 61,880 70,301 8, ,919 37, , ,491 1, , ,274 7,428 4,430 6,277 1,846 35,044 52,112 17,067 83,169 40,028 43,141 3,587 3, ,700 19,500 7,200 5,318 5,318 52,342 41,142 11,200 3,367 2, ,774 6, ( )1,475 ( )1, ,000,463 1,122, , , , ,000 1,919,178 2,047, ,617 98,729 98,729 1,252,277 1,213,977 38, , ,097 40, , ,532 6,122 48,800 86,700 37, , ,508 3,468 78,013 76,422 1, , ,306 22,512 46,949 62,738 15, ,382 3, ,780 15, ,945,416 2,017,789 72, , ,993 8,906 81,461 71,854 9, , , , ,524 8,287 17,074 8, , ,798 1,022 1,593 1, , ,518 6,693 15,086 8,392 99,302 98,280 1, ,681, ,848, ,303 1,483,813 1,541,924 58, , ,338 23,475 1,649,676 1,731,262 81,586 31, , ,717 14,416 12,959 1,457 9,821 13,105 3,284 24,238 26,065 1,827 24,139 27,270 3,130 31,125 37,465 6,339 55,265 64,735 9,470 31,027 38,670 7, , ,074 4,794 5, ,016 21,392 20,375 22,265 67,115 44,850 14,690 14,690 42,767 94,245 51,477 84,780 7,535 77,244 6,319 5,317 1,001 93,866 93,866 5,162 5,162 26,228 26,228 3,255 3,255 91, ,366 50,266 47, , , ,800 40,100 20,200 27,500 7,300 28, , ,485 20,553 8,049 12,504 7,575 26,405 33, , ,802 39, , , ,130 2,093 2, , , , , ,712 8, , ,036 5,217 4,914 4, ,000 20,000 5,264 5, ,575 26,405 33,980 31,253 34,730 3,477 ( 28,129) (18,355) ( 46,485) ( )7,982 ( )9,753 1,770 49,792 84,630 34,838 49,792 84,630 34,838 ( )21 21 ( ) , ,757 73,200 2,738,973 2,884, ,573 2,738,973 2,884, , ,575 26,405 33, ,584 11, ,000 20,000 23,914 38,664 14,750 1,022 1,022 10,210 10, ,035 6,207 1, ,797 20,553 12,
28 Principal Subsidiaries and Affiliates 80.0% 60.9% 83.0% 9,255 8,769 5, % 100.0% 70.0% 1, Principal Subsidiaries and Affiliates 54.4% 3,497 Nippon Steel International Finance PLC 100.0% % 2,238 Nippon Steel Southeast Asia Pte. Ltd % % 2, % 2, % 2, % 1, % 1, % 55.0% 90.3% 1,500 1,500 1, % % 8,604 Nippon Steel U.S.A., Inc % % 6,000 Nippon Steel Australia Pty. Limited 100.0% % 5,537 Siam Nippon Steel Pipe Co., Ltd. 63.3% % 5,468 Nippon Steel Development Canada Ltd % % 4, % 9, % 3, % 2, % 2, % 1, % 1, % 1, % % 1, % 754 The Siam United Steel (1995) Co., Ltd. 36.3% 9, % % 40, % 13, % % 11, % 6, % 2, % 6,
29 Directory 44
30 Investor Information 45
31
株式会社幸楽苑
 35th Business Report http://www.kourakuen.co.jp/ To Our Shareholders Management Report CONTENTS 1 2 3 6 7 8 9 11 14 15 16 17 1 2 Management Strategy 3 4 5 6 Management Strategy Commentary Information 7
9104
 01 To Our Shareholders 02 03 Consolidated Financial Statements 12,000 8,878 9,039 9,102 9,972 11,300 8,000 5,636 4,000 0 2001/3 2002/3 2003/3 2004/3 2004/9 2,000 1,500 1,600 1,000 500 530 373 334 905 742
Q A Q A 1
 IHI Report Q A Q A 1 Q A Q A To Our Shareholders 2 706 803 42 9 1,030 790 66 17 1,894 1,716 55 103 3 Business Review by Segment 1,350 57 45 1,310 704 34 16 755 103 31 16 41 763 16 10 554 4 Performance
ozu_no98_H.qxd (Page h1)
") To Our Shareholders CONTENTS 1 2 3 4 56 78 911 112 13 14 TM 1 2 Group Corporate Information Segment Information 3 4 Topics Topics1 Topics2 Topics3 5 6 8 Special Contents 7 Financial Statements [Consolidated]
To Our Shareholders CONTENTS 1 2 3 4 56 78 911 112 13 14 TM 1 2 Group Corporate Information Segment Information 3 4 Topics Topics1 Topics2 Topics3 5 6 8 Special Contents 7 Financial Statements [Consolidated]
maiji2007_cover_j_0907
 27 CORPORATE PHILOSOPHY THE MEIJI DAIRIES GROUP CONTRIBUTES TO A HEALTHY AND HAPPY DAILY LIFE FOR OUR CUSTOMERS BY OFFERING NEW LEVELS OF VALUE IN FOOD. CONTENTS 2 4 6 1 1 11 12 13 14 16 18 19 2 22 23
Otsuka-people creating new products for better health worldwide Contents 02 03 07 08 11 13 15 16 17 01
 3 Otsuka-people creating new products for better health worldwide Otsuka-people creating new products for better health worldwide Contents 02 03 07 08 11 13 15 16 17 01 To Our Shareholders Otsuka-people
株式会社フジテレビジョン
 67 194119930 Cover 2 Top Message 3 Top Interview 6 Topics 7 Fuji TV Outline 11 Consolidated Financial Statements 13 Non-Consolidated Financial Statements 14 Corporate Social Responsibility Report 15 Group/Network
 Contents FY2011 Highlight Financial Data Business Outline Of ZOZOTOWN To Overseas Customers Business Outline Of Affiliated Companies About Us Appendix : Notice of the 14th Annual General Meeting of
Corporate Philosophy Otsuka-people creating new products for better health worldwide
 ANNUAL REPORT 2013 Corporate Philosophy Otsuka-people creating new products for better health worldwide 00 13 44 Contents 02 14 48 03 16 54 04 22 59 06 30 76 08 36 78 10 38 79 12 41 Group Structure ur
untitled
 1 Report 3 4 8 10 14 16 Topics 18 18 19 19 20 20 21 21 22 23 Information 25 25 2013.9 No.80 1 2 2013.9 No.80 Report 2013.9 No.80 3 4 2013.9 No.80 2013.9 No.80 5 6 2013.9 No.80 2013.9 No.80 7 8 2013.9 No.80
20140410_044059441_qu0005yw0ycgh0zdox3yf455_0.pdf
 avex group holdings inc. 22nd Semiannual Business Report '08.04.01-'08.09.30 Dear Our Shareholders 02 History of avex 22nd Semiannual Business Report H i s t o r y o f a v e x 03 Semiannual Financial Highlights
FINANCIAL FACT BOOK 2002 CONTENTS CONTENTS Sales Data Net Sales Sales Composition Sales by Region Profit Data Cost Composition & Operating Income/Net
 FINANCIAL FACT BOOK 2002 FINANCIAL FACT BOOK 2002 CONTENTS CONTENTS Sales Data Net Sales Sales Composition Sales by Region Profit Data Cost Composition & Operating Income/Net Sales Gross Profit Margin
エイベックス株式会社
 avex 16th Annual Business Report '02.4.1- '03.3.31 Dear Our Shareholders 01 >>>16th Annual Business Report 16th Annual Business Report >>> 02 03 >>>16th Annual Business Report Annual Financial Highlights
NEC THE INTERNET SOLUTION PROVIDER NEC NEC 12 NEC 16 NEC NEC NEC NEC NEC NEC
 NEC CORPORATION NEC NETWORKS NEC SOLUTIONS THE RIGHT STRENGTHS FOR THE INTERNET ERA NEC ELECTRON DEVICES NEC THE INTERNET SOLUTION PROVIDER NEC 1 2 6 10 NEC 12 NEC 16 NEC 20 24 54 55 56 NEC NEC NEC NEC
サステナビリティ報告書
 Living and Working together for the common good. 1 Canon Sustainability Report 2003 Canon Sustainability Report 2003 2 3 Canon Sustainability Report 2003 Canon Sustainability Report 2003 4 93 94 95 96
ゼリア新薬工業株式会社
 C O N T E N T S TOP INTERVIEW Q A Q A Q A 10.9 22.9 66.2 ZERIA Pharmaceutical Co.,Ltd. 1 TOP INTERVIEW Q A 2 ZERIA Pharmaceutical Co.,Ltd. ZERIA Pharmaceutical Co.,Ltd. 3 Q A Q A Q A Q A R&D III II I II
19..-H1-H4...qx3
 e e e e x avex avex avex avex avex avex avex avex avex avex avex avex avex av vex avex group avex avex avex avex holdings avex avex avex avex avex inc. avex avex avex avex avex avex avex avex avex avex
Financial Highlights 15, 3, 3, 13, ,152 2,524 2,611 12, 2,5 2,5 17,425 19,792 2,15 1,424 2, 1,861 2, 9, 1,5 1,5 6, 1,71 1, , , 5
 lnterim Business Report 第 64 期中間報告書 21 年 4 月 1 日から 21 年 9 月 3 日まで 証券コード :7537 Financial Highlights 15, 3, 3, 13,165 124,152 2,524 2,611 12, 2,5 2,5 17,425 19,792 2,15 1,424 2, 1,861 2, 9, 1,5 1,5 6, 1,71
日本軽金属株式会社
 Contents Corporate Information Company Name : Nippon Light Metal Company, Ltd. Established : March 30, 1939 Paid-in Capital : 39,084,654,715 President and CEO : Shigesato Sato Listed since : May 1949 Stock
untitled
 financial report - 1 - - 2 - - 3 - - 4 - - 5 - - 6 - - 7 - - 8 - - 9 - - 10 - - 11 - - 12 - - 13 - - 14 - - 15 - - 16 - - 17 - - 18 - - 19 - - 20 - - 21 - - 22 - - 23 - - 24 - - 25 - - 26 - - 27 - -
A Message From President 2 Kanamoto examiner vo.18
 vol.18 2000.11.1 2001.10.31 contents A Message From President News Headline Report & Interview Annual Report 2001 At A Glance 2 3 4 6 14 Corporate Data Stock Price Range And Volume Investor Information
アニュアルレポート2003
 ..................................... 1............................. 2 6 8 10 12 14............................ 16..................... 20.............................. 21.........................................

GC-X3
 GC-X3 Digital Still Camera GC-X3 STILL CAMERA LYT0667-001A 1 28 1 4 2 3 2 30 1 2 3 2 3 34 1 4 38 1 2 4 5 39 3 ;: 3 1 2 3 4 2 6 8 16 16 18 18 19 20 22 24 25 26 27 28 29 30 31 32 32 33 34 35 36 37 38 39
UFJ
 UFJ UFJ () UFJ UFJ 2002 7 2 82 UFJ 2002 9 UFJ 2002 7 22 83 84 UFJ 1 2 3 4 1 2 16 15 14 90 6 5 2002 7 22 85 UFJ 1 2 DC 1 2 3 4 3 2 1 3 2 1 2 1 2002 7 22 UFJ 2002 7 22 CEO 188 2 7 2 UFJ UFJ p 86 p 18 1 2002
2004. 5 NIPPON STEEL MONTHLY 2
 1 NIPPON STEEL MONTHLY 2004. 5 2004. 5 NIPPON STEEL MONTHLY 2 3 NIPPON STEEL MONTHLY 2004. 5 2004. 5 NIPPON STEEL MONTHLY 4 5 NIPPON STEEL MONTHLY 2004. 5 2004. 5 NIPPON STEEL MONTHLY 6 7 NIPPON STEEL
Our Mission / Business Field
 Our spirit will go on. Our Mission / Business Field Ships & Oceans Logistic Systems Construction of Social Infrastructure Energy Systems Advanced Machinery Systems Plant Engineering Environment-Related
 1991.7.1 1949.6.1 1945.12.1 1953.9.3 1945.9.3 1945.3.8 21.7.3 1986.9.1 196.3.8 1969.5.15 1992.3.19 1988.3.24 22.6.1 1943.2.18 1943.3.29 1965.8.31 197.6.1 1952.2.12 195 194 197 196 198 199 1995 2 & 2 1


ペトロルブインターナショナル株式会社
 Petrolub Report 1 2 New Products BP X-COOL for Import Cars BP X-COOL for Sports BP X-COOL for Racing 3 4 Sales Promotion 5 6 Financial Statements 5 039 578 5 191 730 2 352 981 2 949 291 1 746 153 1 284
aishin00_100608
 www.aisin.co.jp 21.9.23 15, 3rd 1991.7.1 1949.6.1 1945.12.1 1953.9.3 1945.9.3 1945.3.8 21.7.3 1986.9.1 196.3.8 1969.5.15 1992.3.19 1988.3.24 22.6.1 1943.2.18 1943.3.29 1965.8.31 197.6.1 1952.2.12 195 194
業績報告|ディスクロージャー│チューリッヒ|Business Report 2008 会社概要編
 V ision Statement Contents 03 04 06 08 09 10 12 13 16 19 20 23 Greeting from Our CEO - Makoto Ozeki Zurich Insurance Company, Japan Branch Profile Zurich Financial Services Group Profile Financial Highlights
 At TOKYO GAS CO., LTD. Annual Report 2001 For the year ended March 31, 2001 The Frontier Of Change 2001 2000 1999 2001.......................................... 1,086,771 992,255 997,767 $ 8,835,537........................................