はじめに 世界的なエネルギー需要の増大に伴い 中長期的なエネルギー需給の逼迫 不安定化や 化石燃料の消費による二酸化炭素排出量の増加がもたらす地球温暖化が懸念されている 省エネルギー 再生可能エネルギー導入等 ( 以下 省エネルギー等 という ) はこれを解決する有力な手段として 世界各国が協力して
|
|
|
- ありさ ひめい
- 6 years ago
- Views:
Transcription
1 平成 26 年度国際エネルギー使用合理化等対策事業 インドにおける運輸部門に係る省エネルギー等政策共同研究事業 報告書 平成 27 年 2 月 一般財団法人日本エネルギー経済研究所
2 はじめに 世界的なエネルギー需要の増大に伴い 中長期的なエネルギー需給の逼迫 不安定化や 化石燃料の消費による二酸化炭素排出量の増加がもたらす地球温暖化が懸念されている 省エネルギー 再生可能エネルギー導入等 ( 以下 省エネルギー等 という ) はこれを解決する有力な手段として 世界各国が協力して推進する必要がある 日本は世界でも有数の先進的な省エネルギー等技術やそれら技術を育んだ政策 制度等のノウハウを有しており 世界的な省エネルギー等の推進のため 率先して国際的イニシアティブを発揮することが期待されている インドにおいては 省エネルギー及び環境保全対策を進める余地 必要性が大きい 他方 同国では 現在 運輸部門で消費される燃料価格を政府が決定しており 自動車用燃料価格は政策的に低く抑えられている このような燃料価格政策をもって 運輸部門の省エネルギー等の推進 環境保全対策が阻害されていると考えられる 加えて 現在の補助制度の原資は 政府による石油債権の発行及び国営石油会社による負担で成り立っているが 昨今の原油価格の高止まりや燃料需要の増加によって 将来的に補助制度による財政への影響が拡大することが見込まれる こうした補助制度に用いられている政府資金を 省エネルギー等の促進に振り替えることは インド国内のみならず世界規模でのエネルギー需給安定化の観点から 極めて有益である 2013 年 9 月の日印エネルギー対話においては 自動車に限らず運輸部門において 同対話の下に設置された省エネルギー作業部会や各種調査事業を通じて 日印関係者間で定期的に情報共有及び意見交換を行うとともに 優れた省エネ技術を普及させていく上での課題及びその解決策を議論することが合意されている このような背景を踏まえ 本調査においては 運輸部門における省エネルギーの普及び促進事業及びエネルギー政策についての共同研究を実施し 当該国における今後の省エネルギー等の推進に資するエネルギー政策の在り方等に関する政策を提言することを通じて 世界のエネルギー需給バランスの安定化やエネルギー効率の大幅な改善に資することを目的とする 2015 年 2 月一般財団法人日本エネルギー経済研究所 1
3 目次 1. インド運輸部門 概況 運輸需要 エネルギー消費量 運輸部門の燃料補助政策及び省エネ政策動向 燃料補助金 燃費基準 排出基準 インド運輸部門の課題 グジャラート州における燃料消費実態と省エネ行動に関するアンケート調査 概要 目的 方法 分析結果 アンケート対象者の属性 二輪及び乗用車の保有 利用状況 乗用車の購入段階における燃費選好 燃料価格の変動による行動変化 公共交通の利用 政策への示唆 モデル分析 シナリオ分析の枠組み シナリオ分析の主要結果 BAU ケース シナリオの主要結果 シナリオ別乗用車エネルギー需要見通し比較 政策への示唆 鉄道 概況 所管官庁及び関連企業 インド国鉄の概要 インド国鉄の省エネ等の取組 新政権の鉄道政策
4 貨物 旅客 遠隔地 北東部及びアンドラ プラデシュ州とテランガーナ州の開発 鉄道部門の政策課題 国鉄運営 省エネルギーに関する課題 PAT 制度の可能性 (Perform, Achieve and Trade) ワークショップ開催概要 政策提言 今後の課題 Appendix 1 アンケート質問票 Appendix 2 アンケート結果 参考文献
5 1. インド運輸部門 1.1. 概況経済成長が続くインドでは 旅客 運送需要が増加し続けており ガソリンや軽油などエネルギー消費量が増大している 図 1-1 に示すように インド経済は 1980 年代から平均 6% 程度で成長してきた 1991 年に経済成長率が一時的に 1% 以下の水準に落ち込んだが その後は平均 6% 程度を保っている 直近では 2010 年に初めて 10% 台の経済成長を達成したが 2012 年 2013 年は経済成長が足踏みしている 一人当たり実質 GDP は右肩上がりに上昇を続け 自動車の登録台数も増加し続けている 図 1-2 は 実質一人当たり実質 GDP と自動車登録台数の推移である 1961 年の一人当たり実質 GDP が 2,000 ドル台後半 総自動車登録台数が約 66 万台であった その後 2012 年には一人当たり実質 GDP は 10,000 ドルを超え 総自動車登録台数も 1 億 6,000 万台まで増加した このうち 総自動車登録台数の大半は二輪車である 図 1-3 に示すように 二輪車の登録台数が最も大きな割合を占め 直近では 1 億 1,500 万台が登録されている 乗用車について 図 1-4 に示すように SIAM(Society of Indian Automobile Manufacturers) の販売統計では 2012 年に 267 万台の自動車販売されており これは 2005 年比で 2.6 倍の水準にまで増加したことがわかる 一方で 乗用車の保有水準は 他の途上国と比較して低い水準にある 図 1-5 は 千人当たり自動車保有台数の比較である タイ インドネシア 中国と比較して インドの千人当たり自動車保有台数は 17 台 / 千人である GDP 成長率 (%) 図 1-1 経済成長率の推移 出典 : International Monetary Fund 4
6 180, , ,000 総自動車登録台数 ( 千台 ) 120, ,000 80,000 60,000 40,000 20, 一人当たり実質 GDP( $) 図 1-2 一人当たり実質 GDP と自動車登録台数の推移 出所 : World Bank World Development Indicator, Transport Research Wing, Ministry of Road Transport & Highways, Government of India, New Delhi ROAD TRANSPORT YEAR BOOK ( ) 総自動車登録台数 ( 千台 ) 180, , , , ,000 80,000 60,000 40,000 20,000 0 Two Wheelers Cars, Jeeps and Taxis Buses Vehicles Others 図 1-3 自動車登録台数の推移 出所 : Transport Research Wing, Ministry of Road Transport & Highways, Government of India, New Delhi ROAD TRANSPORT YEAR BOOK ( ) 5
7 3,000,000 2,500,000 2,430,105 2,769,629 2,679,194 販売台数 ( 台 ) 2,000,000 1,500,000 1,000,000 1,052,198 1,552,010 1,414,845 1,269,305 1,970, , 図 1-4 乗用車の販売台数の推移 出所 : Society of Indian Automobile Manufacturers 中国インドネシアタイインド 171 台 / 千人 図 1-5 千人当たり乗用車保有台数の比較 出所 : EDMC エネルギー 経済統計要覧
8 1.2. 運輸需要自動車の登録台数が増加し続けていることから明らかなように インドの運輸需要は伸び続けている 図 1-6 は貨物需要 図 1-7 は旅客需要の推移である インドの貨物需要は 1999 年に道路貨物が 4,670 億トンキロ 鉄道貨物が 3,050 億トンキロであったが 好調な経済成長によって 2011 年には道路貨物が 3 倍 鉄道貨物が 2 倍に増加した 道路貨物の運輸需要の伸びが顕著であり 相対的に鉄道からトラックにシフトしつつある インドは 詳細は後述するが 約 6 万 5,000 キロの鉄道網が整備されている一方で 鉄道の貨物料金が高く コスト面でトラックに遅れをとっている このため インドの鉄道は石炭 肥料 セメント等の製品が主要な貨物となっており その他はトラック輸送が担っている 旅客需要も 1999 年から道路旅客 鉄道旅客とも増加し続けており 貨物需要と同様に道路旅客の伸びが顕著である 1999 年は道路が 1 兆 8,316 億人キロ 鉄道が 4,307 億人キロだが 2011 年に道路が 3 倍 鉄道が 2 倍にまで増加した Road Transport Railways 億 tkm 図 1-6 貨物需要の推移 出所 : Transport Research Wing, Ministry of Road Transport & Highways, Government of India, New Delhi ROAD TRANSPORT YEAR BOOK ( ) 7
9 Road Transport Railways 億人 km 図 1-7 旅客需要の推移 出所 : Transport Research Wing, Ministry of Road Transport & Highways, Government of India, New Delhi ROAD TRANSPORT YEAR BOOK ( ) 1.3. エネルギー消費量インドの一人当たり実質所得が増加し 自動車登録台数が伸び続け 運輸需要が拡大するのと同時にエネルギー消費量も増加し続けている 特に インドの運輸部門で最も使用されているディーゼルの増加が著しい 図 1-8 は インドの運輸部門のエネルギー源別エネルギー消費量である 1980 年以降 インドの主要燃料はディーゼルであり 近年もディーゼル燃料の消費量が非常に大きく伸びている 図 1-9 に示すよう 道路輸送のエネルギー源別エネルギー消費量をみれば 大量のディーゼル燃料が消費され 年々増加し続けていることがわかる こうした傾向は 石油天然ガス省傘下の PPAC (Petroleum Planning & Analysis Cell) が公表している燃料油の消費データからもうかがえる 図 1-10 は PPAC が公表している月次のガソリンと軽油の消費量の推移である インド国内では ガソリンや軽油に補助金が支給され 政策的に低い価格に誘導されていたが 近年補助金が撤廃された しかし 2000 年以降の傾向を見る限り 補助金撤廃による消費量の変化は見えない 8
10 石炭 天然ガス LPG ガソリン ジェット燃料 ディーゼル 電力 80,000 70,000 60,000 50,000 ktoe 40,000 30,000 20,000 10, 図 1-8 運輸部門のエネルギー源別エネルギー消費量の推移 出所 : IEA Energy Balances of Non OECD 2014 天然ガス LPG ガソリン軽油 出所 : IEA Energy Balances of Non OECD 2014 図 1-9 道路輸送のエネルギー消費量 9
11 軽油 ガソリン 7,000 6,000 5,000 4,000 千 t 3,000 2,000 1, /4 2001/ /4 2002/ /4 2003/ /4 2004/ /4 2005/ /4 2006/ /4 2007/ /4 2008/ /4 2009/ /4 2010/ /4 2011/ /4 2012/ /4 2013/ /4 2014/10 出所 :Petroleum Planning & Analysis Cell 図 1-10 ガソリンと軽油の消費量の推移 1.4. 運輸部門の燃料補助政策及び省エネ政策動向インド政府は 運輸部門における道路交通 ( 乗用車 バス トラック 二輪車等 ) の分野において以下のような政策を実施している 長年にわたり燃料に対する補助政策を継続してきた 主に 低所得者層への支援として 政策的にガソリンや軽油の価格を低い水準に抑えてきたのである しかし 補助金支給は省エネの観点には逆行するものであり エネルギー消費を増加させる要因となっていた 所得水準に関わらず ガソリンや軽油の価格が国際市況や周辺国と比較して低位に維持されてきたため 自動車の保有率が高い高所得者層が消費量を増やすドライバーとなった 近年では中間層も乗用車の保有率が高まり 上述のように乗用車の販売台数 登録台数ともに大きく増加 エネルギー消費量も伸び続けている こうした状況に対し インド政府は燃費基準の導入を 2005 年から検討しており 2016 年からこれを導入することを 2014 年 1 月に公示した 乗用車の増加は大気汚染の原因となり 特に近年の急激な増加により大都市圏を中心とした深刻な大気汚染を発生させている インドでは 1990 年代から段階的に Bharat Stage(BS) と呼ばれる排出基準を導入 大気汚染対策を進めている 10
12 燃料補助金インドでは 長年にわたり燃料価格に対する補助政策によって統制価格が維持されてきた これは 農業従事者が輸送用や灌漑用ポンプ等で消費する石油製品や乗用車の燃料等 全石油製品に適用され 低所得者層への補助制度として機能していた 1960 年代に輸入平衡価格 (IPP, Import Parity Price) 方式をコストプラス方式の管理価格 (APM, Administered Pricing Mechanism) 方式として 全石油製品に適用された価格設定に変更しが 1970 年代は両方式の間で揺れ動いた そして 1997 年に APM を段階的に廃止することが決定され 4 年後の 2002 年に全廃されることになった そして 2002 年に LPG と灯油を除き APM が廃止されたが 国営石油会社による寡占市場のため 政府が価格決定に関与し続けた 具体的には 石油天然ガス省傘下の PPAC(Petroleum Planning Analysis Cell) が市場価格の動向を踏まえて必要に応じて価格改定がなされてきた この価格決定の際に 州政府は関与していないが 州政府は物品税等の燃料価格に上乗せされる税制の決定権限をもっている しかし 図 1-11 に示すように 国際価格は 2004 年から上昇し続け 2008 に 120 ドル /bbl の水準にまで達したが 統制価格は原油コストや精製コスト 経費の合計を下回る水準であった このため 政府 上流企業 国営石油会社がそれらの損失を補填していたが 国営石油販売会社 (Oil Marketing Company, OMC) の回収不足は 持続不可能な水準に達した 図 1-12 は軽油価格と補助金額の推移 図 1-13 は損失補てんのための政府 上流企業 国営石油会社の負担額である 図 1-12 に示すように 2008 年に市場価格が急激に上昇したことで統制価格との差が拡大し これによって巨額の補助金が投じられたことがわかる また 2011 年以降も同様の状況にある さらに 図 1-13 に示すように インド政府及び上流企業は 市場価格が上昇することで巨額の負担が生じており 最も負担が大きい 2013 年には 1 兆 6000 億ルピーに達した こうした状況に対し インド政府は諮問委員会を組織 補助金政策の見直しが議論されてきた 2006 年に Rangarajan Committee が燃料価格を市場価格にすべきと提言し 2010 年の Parikh Committee 2011 年に Nilekani Task Force そして 2012 年には Kelkar Commttee が同様の提言をインド政府に行っている こうした提言の背景として 政府の補助金負担による財政赤字を積み重ねたことで財政を圧迫していたことが挙げられる 図 1-13 に示したように 政府は石油債券を発行し 損失の補てんを行っているが その額は小さなものではない IISD(2012) や Rahul (2013) が指摘しているように 燃料補助金は本来低所得者層のための政策であったにもかかわらず 燃料を大量に所得するのは高所得者層であるため 結果的に高所得者層をより手厚く補助するものになっていた 結果として 2010 年にガソリン価格は規制緩和し ディーゼルについては 2012 年から段階的に補助金を減らし 2014 年 10 月には原油価格の急落を受けて完全に軽油補助金と 11

13 価格統制制度を廃止した 他方 灯油 LPG 肥料といった低所得者層と農業従事者がより必要とする物資については 補助金が継続することとなり より低所得者層向けの支援策として現在は存続している 140 原油価格 (Indian Basket, $/bbl) /4 2000/ /6 2002/1 2002/8 2003/3 2003/ /5 2004/ /7 2006/2 2006/9 2007/4 2007/ /6 2009/1 2009/8 2010/3 2010/ /5 2011/ /7 2013/2 2013/9 2014/4 2014/11 出所 :Petroleum Planning & Analysis Cell 図 1-11 原油価格 (Indian Basket) の推移 図 1-12 軽油価格と補助金の推移 出所 : Rahul Anand, David Coady, Adil Mohommad, Vimal Thakoor, and James P. Walsh (2013) The Fiscal and Welfare Impacts of Reforming Fuel Subsidies in India, IMF Working Paper 12
14 Rs. in Crore (1000 万ルピー ) 180, , , , ,000 80,000 60,000 40,000 20, 図 1-13 under-recovery の推移 インド政府による負担 (2009 年から石油債権を発行 ) OMCs の負担 ( 損失 ) 上流企業 (Oil, ONGC & GAIL) の負担 Total Under Recovery 180, , , , ,000 80,000 60,000 40,000 20,000 0 Rs. in Crore (1000 万ルピー ) 出所 : Ministry of Petroleum & Natural Gas, Government of India, Basic Statistics on Indian Petroleum & Natural Gas 燃費基準図 1-4 に示したように インド国内では年間 267 万台の乗用車が販売されており 大量のエネルギーを消費している しかし インド国内には燃費基準が導入されておらず 石油の大部分を輸入に頼るインドにとって 乗用車の燃費を向上させることは喫緊の課題である 電力省傘下の BEE(Bureau of Energy Efficiency) は 乗用車の燃費を改善するために 2005 年から 省エネ法に基づく燃費規制の導入を検討してきた 当初より BEE は自動車メーカーに対して 企業別平均燃費 (CAFC, Corporate Average Fuel Consumption ) を 2015 年から導入し 2020 年から CAFC を引き上げることを検討していた また 乗用車に対して 5 段階評価を含むラベリング制度の導入を検討 消費者が自動車を購入する際に参照できるように添付することを検討していた また 自動車燃費規制には 第一に車体重量とサイズを大きくすることへの逆インセンティブが必要であること 第二に不遵守の場合の罰則が必要であること そして第三に不遵守罰則が十分な抑止力となることが必要であるとした 加えて 燃費規制によって省エネを促進するためには 規制を野心的に設定しな 13


15 いと むしろ BAU よりも低水準で新車燃費を推移させることになりかねないため 慎重な目標設定も必要であるとしていた しかし 2011 年に BEE からコンサルテーションペーパーが公表され 2014 年 1 月に燃費基準が公示されるまで BEE が導入を検討してから 9 年の時間を要した これは 特に民族系メーカーが BEE が検討していた CAFC を達成することが難しいため 燃費基準の導入に反対したためである 2014 年 1 月に公示された基準値は 2016 年の CAFC が 18.2km/ リットル CO2 換算した場合に 129gm/km と設定された また 第 2 段階として 2021 年に CAFC を 21km/ リットル CO2 換算した場合に 113gm/km とした 1 この基準値については 販売される乗用車の主力が小型車のインド市場において 将来の経済成長によって消費者が大型車へ乗り換えが進んだ場合 小型車の販売比率が小さいメーカーには厳しい目標値になるとの見方がある 図 1-14 は BEE のワークショップ資料で示された燃費基準と各メーカーの対応状況である 図中に 2009 年 -10 年の燃費水準が示され 併せて第一段階 第二段階の燃費規制の水準が示されている これらの水準上に各メーカーの CAFC 値がプロットされている 同図から マルチスズキやホンダ等の小型車の比率が高いメーカーは既に 2017 年 -18 年の水準を達成していることがわかる 一方で トヨタやメルセデスベンツ マヒンドラ等のメーカーは 2012 年 -13 年の時点では燃費規制の水準に達していないことがわかる 出典 : ワークショップ発表資料 図 1-14 インドの燃費基準と各メーカーの燃費性能 1 REGD. NO. D. L /99 14

16 燃費基準と併せて BEE は燃費ラベルの添付を検討している 2009 年から SIAM が自主燃費ラベルを導入しているが これを置き換えるものになる ラベルには 自動車の燃費を 5 段階で評価し明示される 図 1-15 は 2011 年の BEE のコンサルテーションペーパーで示されたラベル案である 出典 :BEE(2011) CONSULTATION PAPER 図 1-15 インドの燃費ラベル案 排出基準インドでは 長年自動車の排気ガスによる大気汚染が大きな問題となってきた これは主に三つの方法で軽減することが可能である 第一に 燃焼する前の時点で燃料から汚染の原因物質 ( 硫黄分など ) を取り除くことで 排気ガスからの汚染物質を減少させることができる 第二に 自動車運転時に不要な燃料消費を減らすことで 排気ガスそのものを減少させることができる 第三に 排気ガスを社外に放出する前の時点でフィルター等を用いて大気中に汚染物質を除去することで大気汚染を防ぐ方法がある インドでは 排気ガス規制の導入や 都市部における圧縮天然ガス車 (CNG) を導入することで 排気ガス対策に取り組んできた 現在インドでは Bharat Stage(BS) と呼ばれる排気ガス規制が導入されており現在 インド全土で BS-III(EU の EURO3 に相当 ) が導入されており 主要都市では BS-IV(EURO4 相当 ) となっている 今後 BS-IV を全国展開するほか 主要都市から BS-V(EURO5) 相当が導入される 2014 年 5 月に発表された Auto Fuel Policy では 2017 年までに BS-Ⅳを全国に展開 主要都市での BS-Ⅴの導入を 2019 年からとしている これに伴って 燃料の品質を改善していくた 15
17 めに 製油所に対して総計 8,000 億ルピーの投資が必要である指摘している このための資金について 一部が燃料価格に含まれているが 製油所へのヒアリングしたところ 設備改修費用は自己負担を予定し 燃料価格には転嫁しない予定とのコメントがあった これは ガソリンや軽油への燃料補助金が撤廃されたことで 石油精製企業間の競争が促進されているといえる こうした取り組みの結果として ガソリンの硫黄分は 2000 年から 2010 年にかけて 2000ppm から 150ppm に減少し 軽油の場合 10,000ppm から 350ppm まで下げることができた 将来的に 段階的な排ガス規制が進むことで 大気汚染の改善が見込まれる 1.5. インド運輸部門の課題文献調査やヒアリング調査を踏まえ インドの運輸部門の省エネルギーを促進するための課題について整理する 1. 不透明な燃料価格の決定過程 原油価格の下落によって燃料補助制度が撤廃されたが 今後原油価格が上昇した場合に復活する可能性が残る この理由として 燃料価格への補助制度が低所得者層への支援という側面があり 常に政治問題となるためである 燃料価格に上乗せされる物品税は 州ごとに差がある このため 安い州の州境沿いに給油待ちの行列ができ 渋滞や燃費低下の原因となっている 連邦政府が現在 物品税の統一化に向けて州政府と交渉中である こうした燃料価格政策の不透明さは 自動車を購入する際の燃料選択に影響を与えている インドの多くの消費者は 自動車のランニングコストに敏感であり ガソリン 軽油 CNG LPG の価格の見通しが重要な要素となる 同時に 自動車メーカーにおいても 燃費が良く 環境性能の優れた自動車を開発するためのインセンティブが阻害されている 自動車メーカーのリソースは限られており 今後の消費者の燃料への選好を踏まえた 中長期的な観点から燃費が良く 環境性能の優れた自動車を開発するための投資を困難にしている さらに 運輸部門の省エネルギー 環境保全対策を阻害している 燃料価格が低く抑えられることで 需要側において燃費が良く 環境性能の優れた自動車 バス トラックへの買い替えが進まず 補助制度がそうしたインセンティブを抑制する省エネバリアとなっている 2. 原油価格下落による省エネ意識の後退 原油価格が下落したことで燃料補助制度の撤廃が決定されたが これによる燃料消費量の変化は大きくなかった インドでは 今後も経済成長が継続した場合 乗用車の保有率が上昇し 燃料消 16
18 費量が増加し続けると見込んでいる インドで導入が予定されている燃費規制の影響について 燃料供給事業者は今後も燃料需要が減少するとは想定していない こうした中で 原油価格の下落によるインド国内の燃料価格の下落は 省エネ意識を後退させる要因となる 3. 燃費規制と排ガス規制による自動車価格の上昇とインセンティブの欠如 BEE は 2017 年から燃費規制の第一段階を導入 2022 年から第 2 段階へ移行する 図 1-14 に示したように 第 2 段階の燃費規制は非常に厳しい水準であり 自動車メーカーが対応するためには技術開発が必要となる また インドは都市部を中心に大気汚染が深刻であり 1990 年代後半から段階的に排ガス規制が強化されてきた 燃料については 段階的に燃料品質の改善が進められている 今後は 規制強化に合わせて自動車に排ガス浄化装置の装備等 コストがかかる対策が必要となる また 一部のガスパイプラインが整備された州や大都市圏では CNG 車の普及促進策が導入されている こうした規制によって燃費水準の改善や大気汚染の改善が見込まれるが 規制に対応した自動車の価格を上昇させる 一方で インドの消費者は価格に敏感であり 燃費性能に優れた乗用車の普及を妨げる要因となってします また こうした乗用車の普及を促すためのインセンティブ制度がないため より安く燃費性能に劣る乗用車や中古車の購入が選択される 4. 道路インフラの容量不足と燃料品質の確保 インド国内では 年間 200 万台以上の乗用車が販売され これを超える台数の二輪車が販売されている このため 特に大都市圏を中心に昼間時間帯の渋滞が常態化いている このため インド政府は高速道路の整備などを進めているが 需要に追い付いていない こうした渋滞の頻発は 乗用車の燃費を悪化させる大きな要因の一つであり 交通流対策やモーダルシフトが必要である また インド国内に供給されている燃料の品質には課題がある 第一に BS-IV の燃料が都市部で販売されていても BS-IV が導入されていない地域で給油し 都市部に移動すると BS-IV 販売地域でも想定した大気汚染防止効果が得られないことが挙げられる この点からも全国で BS-IV を展開することが急がれている 第二に 製油所で BS-IV や BS-V を遵守した高品質な燃料が精製されても 燃料タンクやパイプライン ガソリンスタンドといったインフラ全体で油質を管理する制度や能力が無いため 消費されるまでに燃料が劣化するという問題がある これに対し インド政府としては Auto Fuel Policy の中で 油質に管理に注力していくとしている 17
19 5. 省エネ意識の啓発と教育 インドのドライバーは 自動車のランニングコストに敏感ではあるが 省エネには繋がっていない また ライセンスを取得する際に 安全かつ 効率的な運転とメンテナンスのための教育が不十分な状態である BEE は 燃費基準の導入とともに 燃費ラベルの導入を計画している これによって 消費者が自動車を購入する際に低燃費車を選択することを期待している 18
20 2. グジャラート州における燃料消費実態と省エネ行動に関するアンケート調査 2.1. 概要委託事業の一環として グジャラート州の二輪車 乗用車保有者の燃料消費実態及び省エネ行動に関するアンケート調査を実施した アンケート質問は Appendix 1 結果の詳細については Appendix 2 を参照されたい ここでは アンケート結果のうち インドの運輸部門の省エネ政策及び燃費性能に優れる乗用車の普及に関連する結果の概要を示す 目的インドの運輸部門では 今後の経済成長によって乗用車への需要が急激に増加すると予測されており 多くの自動車メーカーがインド市場に参入している 一方で インドは石油資源の多くを輸入に頼っており エネルギー安全保障を強化するためにも 国内の運輸部門に対する省エネ政策として乗用車の燃費規制の導入が重要となるが どの程度の燃料が消費されているのか どの程度の距離を走行するのか 保有状況や燃費 燃料価格への反応等といった燃料消費実態に関する知見は不足している さらに インドの消費者は燃料価格に敏感と言われているが 燃料価格の変動によってどの程度燃料消費量が変化するのかは定量的なデータが不足している そこで 本事業では インドグジャラート州において 二輪及び四輪保有者を対象としてアンケート調査を実施した その理由として グジャラート州はインドのモディ首相が州知事を務めていた時代に他の地域と比較して急速な発展を遂げた地域の 1 つであり 今後のインドの省エネ政策を検討する上で 典型的な地域の 1 つと捉えることができることが挙げられる 当然 インドの各地域に対してアンケート調査を実施することも検討したが 地域を増やすことに依る小サンプルの弊害を回避するために 特定の地域に絞る方針をとった 方法アンケート調査は グジャラート州の Ahamedabad, Anand, Bhavnagar, Rajkot, Baroda, Surat, Mehsana, Bhuj の 8 地域で実施 無作為に抽出された二輪車または乗用車を保有する 18 歳以上の成人を対象とし 調査員による聞き取り調査をおこなった アンケート表は Appendix 1 に示したように アンケート対象者に対して 属性 二輪車及び乗用車の保有 利用状況 燃料消費量 燃料費等の設問への回答を依頼した その結果 アンケートの回収数は 1109 であった 2.2. 分析結果 アンケート対象者の属性アンケート対象者の属性について 世帯人数 年齢階層 所得について以下に示す 19
21 図 2-1 は世帯人数である 4 人家族が最も多く 35% を占め ついで 5 人家族 6 人家族が多い 図 2-2 に回答者の年齢階層である 21~30 歳の回答者が最も多く ついで 31 歳 ~40 歳が多い また 全体として女性は少数である 図 2-3 に示す通り 所得別では 月間所得が 3 万 ~5 万ルピーの層が最も多く ついで 3 万ルピー以下の層が多い その他のアンケート結果も踏まえると アンケートの回答者は 都市部及び近郊に住む乗用車を保有できる裕福な層であり 夫婦と一人から二人の子供がいる若い世代が典型的な回答者となっている 度数 人 2 人 3 人 4 人 5 人 6 人 7 人 8 人 9 人 10 人 11 人 図 2-1 世帯人数 男性 女性 400 度数 ~20 歳 21~30 歳 31~40 歳 41~50 歳 51~60 歳 61 歳以上 図 2-2 年齢と性別 20
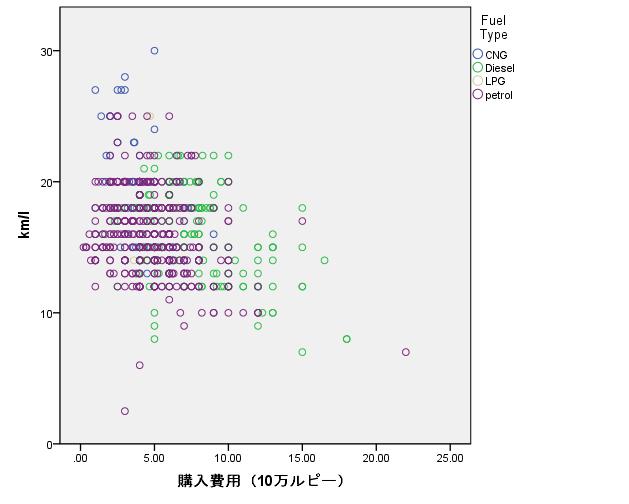
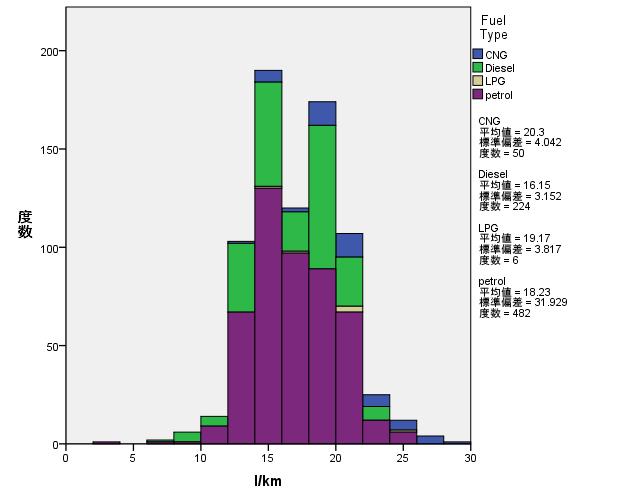
22 万ルピー以下 3 万 ~5 万ルピー 5 万 ~10 万ルピー 10 万 ~20 万ルピー 度数 20 万 ~50 万ルピー 図 2-3 所得階層 二輪及び乗用車の保有 利用状況二輪車及び乗用車の保有状況 及び利用状況についての設問への回答の概要を示す 表 2-1 は二輪車及び乗用車の保有状況をクロス集計したものである 回答結果から乗用車一台 二輪車一台 ~ 二台を所有している回答者が多数である このため 乗用車の保有者は 引き続き二輪車を保有していることがわかる 次に 回答者が所有する乗用車のメーカーについての回答結果を図 2-4 に示す インドの自動車メーカーシェアはマルチスズキが最も大きく 次いで韓国の現代自動車 インドのタタ自動車の順となる 今回のアンケート調査でも同じ傾向となっており マルチスズキが 46.79% と最も大きなシェアとなっている 次いで 現代自動車 タタ自動車のシェアが大きい結果となった また 保有している乗用車の燃料種別や購入価格 燃費についての設問への回答を図 2-5 に示す 横軸は購入費用 縦軸が燃費 点は燃料種別ごとに色分けしている 図 2-5 から ディーゼル車の購入費用がガソリン車よりも高い傾向にあることがわかる 一方で 燃費をみると ディーゼル車はガソリン車と同等 あるいは燃費が悪いことがわかる したがって 一般的にディーゼル車の方が燃費性能に優れ 先進国では大気汚染対策を施したクリーンディーゼルが普及しているが インドではガソリン車よりも燃費で劣るディーゼル車が高い価格で販売されているといえる このことは 図 2-6 に燃料別の燃費を示すように 今回の調査対象者の保有するガソリン車の燃費の平均値は 18.23km/l であるが ディーゼルは 16.15km/l であることからも指摘できる ただし 図 2-6 にあるように ガソリン車の燃費の分散は大きく 最頻値は 15km/l 21

23 台である 一方で ディーゼルの分散は小さく 最頻値は 20km/l 弱となっている このことから ディーゼル車については 旧型の燃費の悪い乗用車が使用されている可能性や車種ごとの差異が存在する可能性が示唆される こうした点について 図 2-7 にメーカー別 燃料別の燃費の分布を示す 表 2-1 二輪車と四輪車の保有状況 No. of four wheelers in the household 合計 No. of two wheelers in the household 合計 図 2-4 メーカー別保有状況 22
24 図 2-5 燃料別購入費用と燃費の散布図 図 2-6 燃料別燃費の分布 23

25 図 2-7 メーカー別 燃料別の燃費の分布 24
26 続いて 二輪車と乗用車の利用状況について示す 表 2-2 は それぞれの一週間の走行距離をクロス集計したものである 二輪車で最も多いのが週に 100km 程度という回答が多く 次いで 150km 200km となっている 乗用車では 100km が最も多く 次いで 250km が多い 今回のアンケート対象者の大部分が都市及び都市近郊に居住しているが その多くが週に 100km から 200km 程度の距離を二輪車または乗用車で移動していることがわかる こうした移動に必要となる燃料消費量と燃料費の月間平均を表 2-3 に示す アンケートの結果を見ると ガソリンの燃料消費量よりも軽油の消費量が多いことがわかる 一方で 燃料費をみると ガソリンの方が軽油よりも大きい この理由として グジャラートでは軽油価格がガソリン価格より低く 2014 年 10 月まで燃料補助金によって政策的に軽油価格が低位に据え置かれていたことが挙げられる また 燃料補助金撤廃後も 各種の税制等の要因によって軽油の方がガソリンよりも安価である さらに CNG をみると ガソリンや軽油よりもさらに燃料費が安い こうした点について 図 2-8 にガソリン消費量と燃料費 図 2-9 に軽油消費量と燃料費 図 2-10 に CNG 消費量と燃料費を示すように これらの傾きを見れば明らかである 表 2-2 一週間当たりの二輪車と四輪車の走行距離のクロス集計表 乗用車 Up to more 合計 二輪車 Up to more 合計 表 2-3 燃料別月間平均消費量と月間平均燃料費 月間平均燃料消費量月間平均燃料費 ガソリン 30.8 リットル ルピー 軽油 34.2 リットル ルピー LPG 34.9kg ルピー CNG 42.9kg ルピー 25
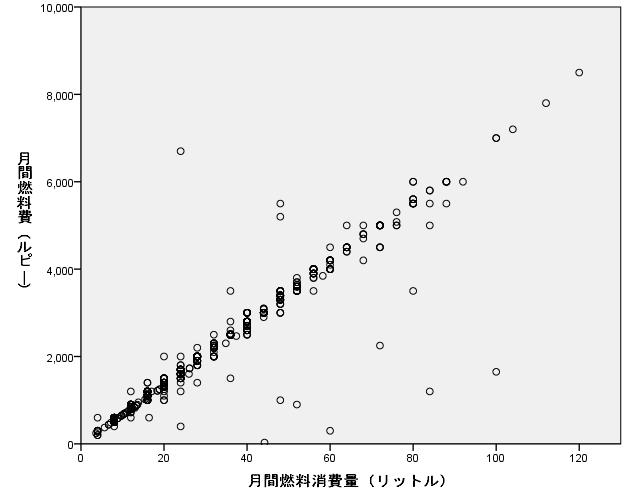
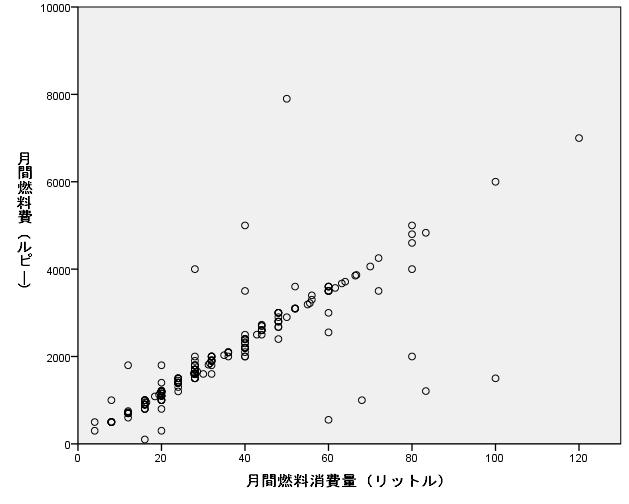
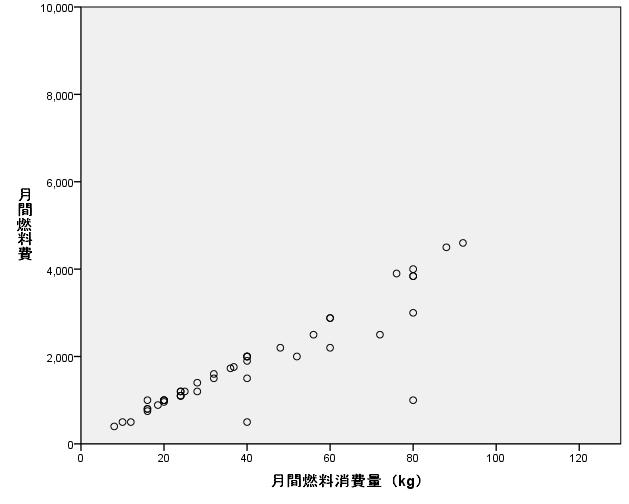
27 図 2-8 ガソリン消費量と燃料費の散布図 図 2-9 軽油消費量と燃料費の散布図 図 2-10 CNG 消費量と燃料費の散布図 26


28 あわせて 乗用車のメンテナンスについて質問した その結果 全体の 65% が 3 カ月に一度 30% が 6 カ月に一度 自動車をなんらかのメンテナンスあるいは修理に出している また 67% がメンテナンスや修理の際にメーカー公認のサービスセンターを利用し 30% がそれ以外の修理工場を利用していることがわかった また 年間のメンテナンス及び修理費用が 3000~5000 ルピーという回答が 46% で最も多く ついで 5000~1 万ルピーという回答が 45% を占めている 図 2-11 メンテナンス頻度 図 2-12 メンテナンス依頼先 図 2-13 年間メンテナンスコスト 27
29 乗用車の購入段階における燃費選好続いて 乗用車の購入段階における検討事項について質問した 図 2-14 は乗用車の購入理由を尋ねた結果である アンケート回答者 1109 名のうち 627 名が乗用車の購入または買い換えを検討しており その理由として 家族のニーズを満たすため という回答が最も多く 次いで 通勤 や 様々な社会的ニーズを満たすため といった回答が多かった こうした買い換えの際の予算と所得水準をクロス集計した結果が表 2-4 である 月収が 3 万ルピー以下では 30 万から 60 万ルピーが最頻値となっている また 月収が 3 万ルピーから 5 万ルピーの層も同様の水準が最頻値である 次に 自動車を購入する際 どの燃料を選択するか質問したところ 図 2-15 に示すように ガソリン車 ディーゼル車 そして CNG 車でほぼ三等分となった また 所得別に見ると図 2-16 のようにディーゼル車の購入を検討している回答者の所得が高い傾向にある さらに 図 2-17 に示すように 購入予算を多めに設定していた また 図 2-18 に示す通り ディーゼル車が現在の自動車利用状況において最も長距離を走行する傾向がある 他方 ガソリン車と CNG 車の間には 所得や購入予算の傾向に違いは見られなかった そして 乗用車の購入段階において重視する点として 価格や維持費用 メーカーや燃費など 17 の点について 5 段階で評価するように質問した その結果を 図 2-20 は所得水準別に整理し 図 2-21 は購入予算別に整理した (1 が最重視 5 が重視しない ) 当然 最も重視するのが初期費用としての自動車の価格であり メンテナンスやランニングコストのように価格やコストが重要な要素であることが確認された また こうした点は所得水準や購入予算で大きな差は無いと言える 性能面ではエンジンパワー 燃料のタイプ 頑丈さ そして実質燃費を重視している 加えて メーカーも購入時の重要な検討事項となっている しかし 所得水準や購入予算によってこうした点を重視するか否かには若干の差異が存在する 図 2-20 から 所得が少ない層は車体価格や燃費をより重要視していることがわかる さらに 図 2-21 に示す通り 自動車の購入予算を多めに設定している層の方が 燃費を重要視していることがわかる したがって 乗用車の購入段階において 消費者は価格を重視し 購入後のランニングコストに影響する燃料選択も含めて乗用車の購入を検討している 同時に 燃費も重視する点の 1 つであり 主に経済的要因によって燃費を重視している 燃費性能が優れた乗用車を選好する素地はあるが 予算上の制約によって その他の要因を優先していると考えられる また 新たに乗用車を購入する際にこれまでと同じサイズの乗用車を購入するかという問いに対して 大部分が異なるサイズを検討していると回答している このことは 将来的に小型乗用車から大型乗用車へと消費者の選好が移行していくことを示唆しており 今後の経済成長による所得の上昇は 燃費性能で劣る大型乗用車の普及によって全体的な燃費の悪化が予見される したがって 小型乗用車だけでなく 燃費性能に優れた大型乗用 28

30 車の普及を促すことが将来的な課題といえる 図 2-14 自動車の購入理由 表 2-4 所得と購入予算のクロス集計表 3.5 What is the price range in which you are looking to buy this new car? Less than More than Rs.3 Rs.3 to 6 Rs.6 to 10 Rs.10 to Rs.15 lakhs lakhs lakhs 15 lakhs lakhs 合計 0.7 Total Monthly Household Income Less than Rs 30,000 <Rs 30,000-50,000 <Rs 50, ,000 <Rs 100, , 合計
31 3 万ルピー以下 月間所得 3 万 ~5 万ルピー 5 万 ~10 万ルピー 万 ~20 万ルピー % 20% 40% 60% 80% 100% 購入予算 30 万ルピー以下 30 万 ~60 万ルピー 60 万 ~10 万ルピー 10 万 ~15 万ルピー 15 万ルピー以上 図 2-15 月間所得別自動車購入予算 30% 32% ガソリン車 ディーゼル車 CNG 車 38% 図 2-16 購入希望車種 ( 燃料別 ) ガソリン車 ディーゼル車 CNG 車 % 20% 40% 60% 80% 100% 3 万ルピー以下 3 万 ~5 万ルピー 5 万 ~10 万ルピー 10 万 ~20 万ルピー 図 2-17 購入予定車種と月間所得 30
32 ガソリン車 ディーゼル車 CNG 車 % 20% 40% 60% 80% 100% 30 万ルピー以下 30 万 ~60 万ルピー 60 万 ~10 万ルピー 10 万 ~15 万ルピー 15 万ルピー以上 図 2-18 購入予定車種と購入予算 ガソリン車 ディーゼル車 CNG 車 % 20% 40% 60% 80% 100% 50km 以下 100km 程度 250km 程度 500km 程度 750km 程度 1000km 以上 図 2-19 購入希望車種と現在の自動車走行距離 ( 週 ) 31
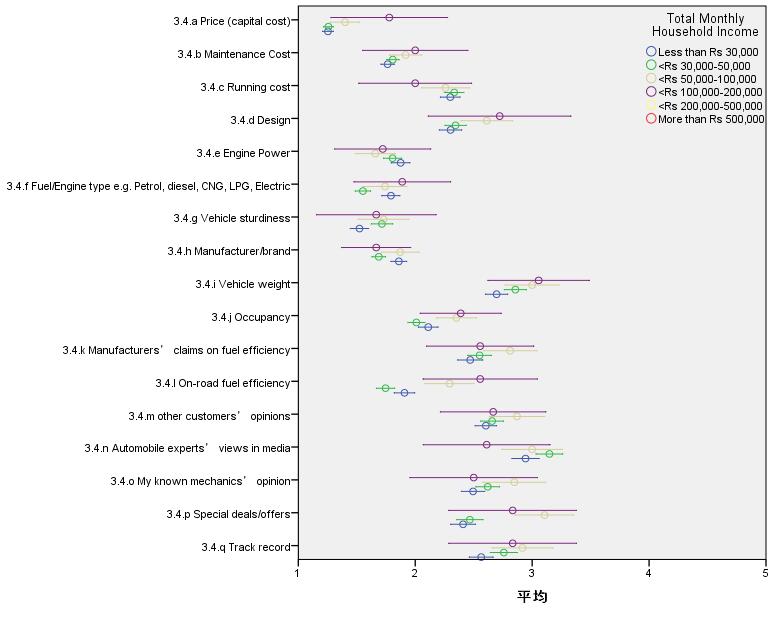
33 図 2-20 所得階層別自動車購入時に検討するポイント 32
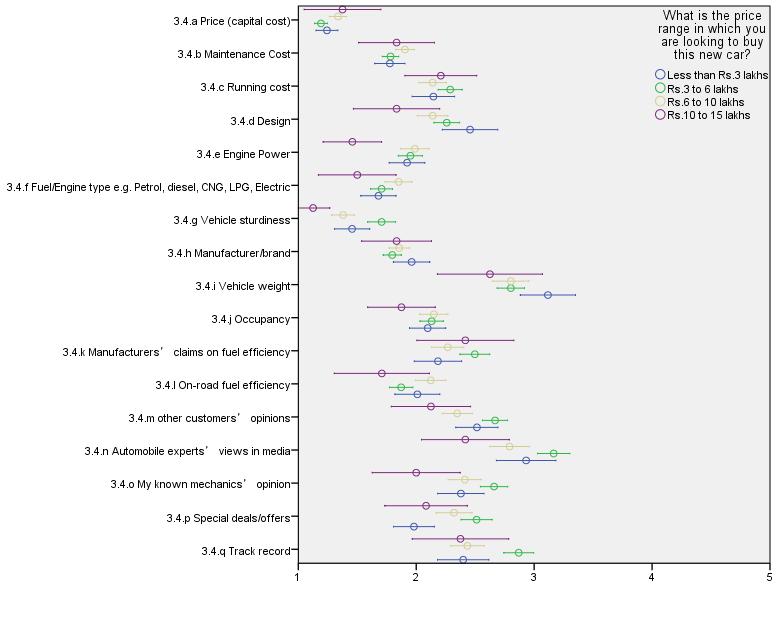
34 図 2-21 購入予算別自動車購入時に検討するポイント 33
35 燃料価格の変動による行動変化既に述べたように インドの燃料価格は国際市況価格の急落によって下落し 燃料価格高騰対策としての燃料補助金も撤廃された 一方で インドの消費者は燃料価格に敏感であり これが再度上昇したときにどのような行動変化があるのかを調査することは意味がある アンケートにおいて 燃料価格が上昇した場合にとる行動について 16 の選択肢を示し これらについて 5 段階での評価を尋ねた この結果を 図 2-22 に示す (1 が行動する可能性が最も高い 5 が行動しない ) 結果を見ると 燃料価格上昇した場合 燃料消費削減に何らかの対策をとる意識がり 所得が少ない方がより積極的に対策をとる傾向にあることがわかる 具体的な対策としては 燃費のいい運転方法に最も関心があることがわかった これは どの所得階層でも同様である 次いで 低燃費自動車への関心が高く 同時に乗用車の燃料を変更するために乗用車の買替えを検討すると示唆される ただし 乗用車の利用そのものを減らすたようなライフスタイルの変化には消極的である 自動車を手放すことは検討すらされないが 四輪車から二輪車にシフトするということにも消極的である さらに 近所同士での相乗りをするということにも消極的であるように 乗用車の利便性を損なうことは極力避けようとする意識が強いといえる したがって アンケートの結果から 省エネを促進するためには 乗用車の燃費性能を改善し 市場に普及させることの重要性が示唆される これは 多くの消費者が利便性を損なうことを避けようとしているからである また 燃費を向上させる運転方法への関心があることから インド版エコドライブを普及させるための啓発や教育が重要である 34
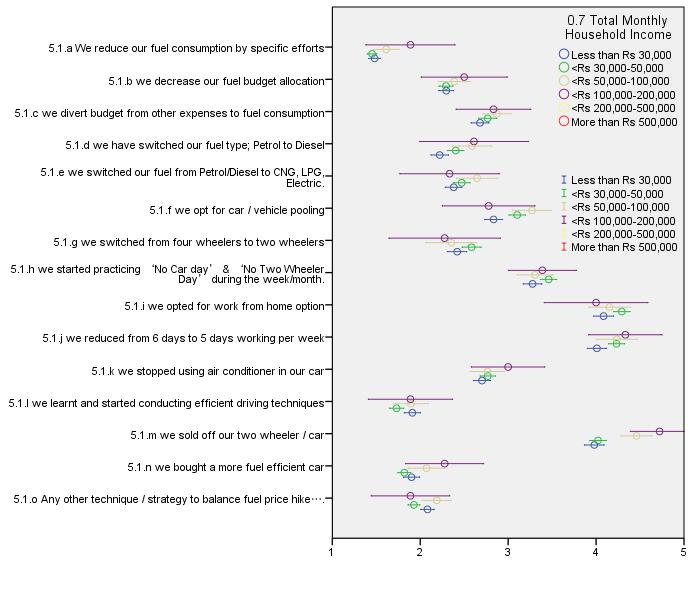
36 図 2-22 所得階層別燃料価格高騰対策 35


37 公共交通の利用最後に 現在の公共交通の利用頻度について質問した 結果を図 2-23 に示す 最も多くの回答者が 週に一度利用する と回答している 次いで 週に二度利用する という回答と 全く利用しない という回答がいずれも 16% ほどになっており 一週間に三回以上利用すると答えた回答者は 2% に満たない 最も利用されているのは オートリキシャー (58%) で 次いでバス (31%) となっている また 燃料価格が上昇した際に公共交通の利用を増やすかという質問の結果を図 2-24 に示す これに対して 63% が否定的な回答を示した このことは 二輪車または乗用車を所有している人にとっては 燃料価格が上昇しても 公共交通に乗り換えることで支出を抑えようとする意識は低いことがうかがえる したがって 今回の限定的な調査から 二輪車及び乗用車を所有している場合 燃料価格が上昇した場合であってもモーダルシフトの可能性が低いことが示唆される ただし グジャラート州では メトロを初めとする公共交通機関の整備が途上であり こうしたインフラが形成されることで モーダルシフトを検討する余地が生じる可能性はある 図 2-23 公共交通機関の利用頻度 図 2-24 公共交通機関へのシフト 36
38 2.3. 政策への示唆 アンケート調査の結果から次のような政策への示唆が得られた 1. 高価だが燃費の劣るディーゼル車の排除 インドではガソリン車よりも燃費で劣るディーゼル車が高い価格で販売されている ディーゼル車については 旧型の燃費の悪い乗用車が使用されている可能性や車種ごとの差異が存在する可能性が示唆される 燃料補助金撤廃後も 各種の税制等の要因によって軽油の方がガソリンよりも安価なため 燃費性能の低いディーゼルが残る余地が存在する 2. 燃費性能に優れた乗用車へのインセンティブ 自動車購入の際の初期費用も大きなファクターであり 低燃費自動車であっても初期費用の高い車種は敬遠されてしまう また 購入後のランニングコストに影響する燃料選択も含めて乗用車の購入を検討している このため 低価格で燃費性能に優れた乗用車の開発の促進や初期投資への経済的インセンティブを付与することで低燃費車の普及促進に大きく貢献する 3. 省エネ行動の啓発と普及 燃料価格が上昇しても 利便性を損なうような燃料支出を減らす行動を起こす意識は低い また 回答者の自動車利用が都市部での短距離移動がメインであるにも関わらず 公共交通の利用による燃料支出削減にも消極的である 一方で 低燃費の走行方法への関心は高く エコドライブの情報や講習会等で啓発と方法の普及が重要である 4. メンテナンスの際の啓発 インドの消費者の多くが定期的に自動車を修理やメンテナンスを行っている こうした機会をとらえ 消費者に対して燃費改善のための働きかけをする機会となる 37
39 3. モデル分析本章では燃料価格と消費者の乗用車選好の関係ならびにそれらの将来におけるエネルギー需要に与える影響を理解するために 分析モデルに基づいて得た試算結果について述べることとする 試算の前提として 燃料価格の変化と購入乗用車に関する消費者選好の変化に関して行ったアンケート調査を活用しモデル分析に反映させている なお アンケート調査の枠組み ならびにその結果については第 2 章で説明している 3.1. シナリオ分析の枠組み本分析ではアンケート結果に基づく燃料価格の変化に伴う消費者の乗用車選好への影響を TERI(The Energy and Resources Institute) の National Transport Demand and Energy Model に反映し 将来の乗用車エネルギー需要見通しを作成している TERI モデルはボトムアップ方式でエネルギー需要を分析するもので 旅客部門と貨物部門のエネルギー需要が分析可能である そのうち本分析で活用したのは乗用車モデルであり ストック燃費を新車販売と耐用年数から計算 走行距離を乗じエネルギー需要を求めるものである アンケート調査項目から 燃料価格の変化に関する9つの項目をシナリオ作成の前提として活用し それぞれの乗用車に関するエネルギー需要見通しを行う シナリオ分析にあたって 燃料別に異なる相対価格を以下の 9 つに関して想定した シナリオ 1.1: ガソリン価格がディーゼル価格よりも 25% 高価になった場合 シナリオ 1.2: ガソリン価格がディーゼル価格よりも 35% 高価になった場合 シナリオ 1.3: ガソリン価格がディーゼル価格よりも 50% 高価になった場合 シナリオ 2.1: ディーゼル価格がガソリン価格と同水準になった場合 シナリオ 2.2: ディーゼル価格がガソリン価格よりも 25% 高価になった場合 シナリオ 2.3: ディーゼル価格がガソリン価格よりも 50% 高価になった場合 シナリオ 3.1:CNG 価格がディーゼル価格と同水準になった場合 シナリオ 3.2:CNG 価格がガソリン価格と同水準になった場合 シナリオ 3.3:CNG 価格がガソリン価格よりも 25% 高価になった場合 アンケート調査では ガソリン乗用車 ディーゼル乗用車 CNG 乗用車に関する新車購入計画のある回答者に対して 各車種の燃料価格が変化した場合 購入車種を変更するか否かについて尋ねている 具体的にはガソリン乗用車を購入する計画がある回答者に対して ガソリン価格がディーゼル価格よりも 25% 上昇した場合 購入するのをディーゼル車 CNG 車 LPG 車 または電気自動車に変更する可能性とその場合の選好車種を尋ねるものである ガソリン乗用車の購入を変更しないと回答したものに対しては 追加的にガソリン価格がディーゼル価格と比較して 35% 上昇した場合の車種変更の可能性とその場合の選好を質問している 同様の質問をディーゼル乗用車 CNG 乗用車の購入計画のある回答者 38
40 に尋ねるものである アンケート結果は 年以降の車種構成の変化に反映させ エネルギー需要見通しを作成している この点は今後の検討課題とする グジャラート州で実施されたアンケート結果を前提とし インド全国の消費者が価格変化に同じ選好をもつと仮定した上で シナリオ分析を行っている点に留意されたい シナリオの前提となる 燃料価格別の水準は以下の通りである ガソリン :67.75 ルピー /liter ディーゼル : ルピー /liter CNG:44.90 ルピー /kg これらをキロカロリーベースに変換しガソリン価格を 1 としたディーゼルの価格は 0.76 CNG 価格は 0.4 となる ガソリンディーゼル CNG 図 3-1 燃料価格の相対水準比較 ( ガソリンを 1 とする ) インドにおけるガソリン乗用車 ディーゼル乗用車 CNG 車の燃費水準 ( ストックレベル ) 以下の通りである ガソリン乗用車 :18.23 km/liter ディーゼル乗用車 : km /liter CNG 乗用車 :20.3 km/kg これらをキロカロリーベースに変換しガソリン価格を 1 としたディーゼル車の燃費は 0.77 CNG 車は 0.98 となる 2 ガソリン ディーゼルのリッターから kcal への換算係数はそれぞれ 7,908(kcal/ リッター ) 9,095(kcal/ リッター ) であり 天然ガスの kg から kcal への換算係数は 9,000 (kcal/kg) とし相対価格水準を計算した 39
41 ガソリン車ディーゼル車 CNG 車 図 3-2 ストック燃費の比較 ( ガソリン乗用車を 1 とする ) 3.2. シナリオ分析の主要結果 BAU ケースインドの所得水準の向上と歩調を合わせ 将来的にも乗用車保有台数は継続して増加 現在の 1600 万台から 年には 8000 万台への自動車保有台数は増加する ( 図 3-3) 本分析において GDP は 年から 年まで 12 次 5 ヶ年計画で目標とする年率 9.2% で増加した後 年まで年率 8% で増加する想定とする BAU ケースにおける乗用車の燃料別車種構成は 年において ガソリン乗用車の占める割合が 66% と 年の 60% から拡大する一方 ディーゼル乗用車の割合は 年で 28% と 年の 36% から縮小する これはガソリンとディーゼルの相対的燃料価格差の解消 ならびにイニシャルコストの違いからガソリン車へのシフトが起きるとする見通しを反映するものである 乗用車 ( 百万台 ) 人キロ (10 億 ) 人キロ 80 乗用車ストック % 90% 80% 70% 60% 50% 40% 30% 20% 10% 0% 2% 3% 3% 2% 2% 2% 3% 3% 3% 4% 36% 35% 32% 30% 28% 60% 60% 62% 64% 66% 電気 LPG CNG ディーゼルガソリン 図 3-3 BAU ケース : 自動車保有台数見通し ( 左図 ) 燃料別乗用車エネルギー需要の割合( 右図 ) 40
42 2,000 PJ 1,800 1,600 1,400 1,200 1, 電気 LPG CNG ディーゼルガソリン % 2% 2% 2% 1% 2% 42% 41% 38% 36% 34% 55% 56% 57% 60% 62% 電気 LPG CNG ディーゼルガソリン 図 3-4 BAU ケース : 乗用車のエネルギー需要見通し ( 左図 ) 燃料別乗用車エネルギー需要 割合見通し ( 右図 ) BAU ケースにおいて 乗用車のエネルギー需要は 年の水準から年率 8.8% で増加 年にはほぼ 5 倍の 1,890 PJ に達する 燃料別ではガソリン需要が同期間に 6 倍の 1,171 PJ ディーゼル需要は 4 倍の 646 PJ に達する見通しである BAU ケースにおいて電気自動車や CNG 車のエネルギー需要は 年において全体の 3.9% を占める程度である 以下 シナリオごとの主要結果を提示する 詳細な分析結果は Appendix 3 を参照されたい シナリオの主要結果 シナリオ 1.1: ガソリン価格がディーゼル価格よりも 25% 高価になった場合シナリオ 1.1 では 2031 年における燃料別のエネルギー需要はガソリンの割合が 49% と 年の 55% から縮小する見通しである ディーゼル価格のガソリン価格に対する相対水準が小さくなることから 年 BAU と比較してディーゼルに対する選好も微増するため エネルギー需要に占める割合も同年 39% と微増する なお 本シナリオにおいて BAU 比で最も大きな消費者の選好変化が生じるのが CNG 車へのシフトであり 年におけるエネルギー需要では全体の 8% を占める 年における本シナリオのエネルギー需要は 相対的に燃費性能の優れた CNG の割合が増えることから BAU と比較して 2.5% 減の 1,843 PJ となる ( 図 3-5) 41
43 PJ 2,000 1,800 1,600 1,400 1,200 1, 電気 LPG CNG ディーゼルガソリン % 2% 3% 3% 4% 4% 6% 8% 42% 41% 39% 39% 39% 55% 56% 56% 51% 49% 電気 LPG CNG ディーゼル ガソリン 図 3-5 燃料別乗用車エネルギー需要の見通し ( 左図 ) 燃料別乗用車エネルギー需要の割合 ( 右図 ) シナリオ 1.2: ガソリン価格がディーゼル価格よりも 35% 高価になった場合シナリオ 1.2 ではシナリオ 1.1 と比較して ガソリン車から CNG 車への選好がより高まるアンケート結果を反映し エネルギー需要でも CNG の占める割合が 17% へと大きく拡大する ( 図 3-6) シナリオ 1.1 同様 相対的な燃費水準の良い CNG の割合が増えるため 年時点での乗用車エネルギー需要は BAU 比 7% 減の 1,758 PJ に達する PJ 2,000 1,800 1,600 1,400 1,200 1, 電気 LPG CNG ディーゼルガソリン % 2% 3% 4% 5% 7% 12% 17% 42% 41% 40% 42% 42% 55% 56% 54% 41% 34% 電気 LPG CNG ディーゼル ガソリン 図 3-6 燃料別乗用車エネルギー需要の見通し ( 左図 ) 燃料別乗用車エネルギー需要の割合 ( 右図 ) シナリオ 1.3: ガソリン価格がディーゼル価格よりも 50% 高価になった場合シナリオ 1.3 ではシナリオ 1.2 と比較して ガソリン車から CNG 車へのシフトは大きな変化はないとするアンケート結果を反映し エネルギー需要でも CNG の全体に占める割合は 17% とシナリオ 1.2 より微増するに留まる ( 図 3-7) エネルギー需要では 年において BAU と比較して 7.67% 減の 1,745 PJ となる 42
44 PJ 2,000 1,800 1,600 1,400 1,200 1, 電気 LPG CNG ディーゼルガソリン % 2% 3% 4% 5% 7% 12% 17% 42% 41% 40% 42% 43% 55% 56% 53% 40% 33% 電気 LPG CNG ディーゼルガソリン 図 3-7 燃料別乗用車エネルギー需要の見通し ( 左図 ) 燃料別乗用車エネルギー需要の割合 ( 右図 ) シナリオ 2.1: ディーゼル価格がガソリン価格と同水準になった場合シナリオ 2.1 では消費者のディーゼル車に対する選好が低くなるアンケート結果を反映し これを大きく代替するガソリン車のエネルギー需要に占める割合が 年で 64% と 年の 55% から増加する 乗用車の総エネルギー需要では ディーゼル車と比較して相対的に燃費の良いガソリン車の割合が増加することから 年時点で BAU 比 2.46% 減の 1,844 PJ に達する PJ 2,000 1,800 1,600 1,400 1,200 1, 電気 LPG CNG ディーゼルガソリン % 2% 2% 2% 2% 4% 5% 42% 41% 37% 32% 29% 55% 56% 58% 62% 64% 電気 LPG CNG ディーゼルガソリン 図 3-8 燃料別乗用車エネルギー需要の見通し ( 左図 ) 燃料別乗用車エネルギー需要の割合 ( 右図 ) シナリオ 2.2: ディーゼル価格がガソリン価格よりも 25% 高価になった場合シナリオ 2.2 ではガソリン需要の占める割合は 年時点で 67% へと増加する一方 ディーゼルの割合は同 22% へと縮小する 相対的に価格が安い CNG の割合は 年で 8% へと拡大する 乗用車のエネルギー需要は 年において BAU 比 5.24% 減の 1,791 PJ に達する 43
45 PJ 2,000 1,800 1,600 1,400 1,200 1, 電気 LPG CNG ディーゼルガソリン % 2% 3% 3% 3% 6% 8% 42% 41% 36% 27% 22% 55% 56% 58% 64% 67% 電気 LPG CNG ディーゼルガソリン 図 3-9 燃料別乗用車エネルギー需要の見通し ( 左図 ) 燃料別乗用車エネルギー需要の割合 ( 右図 ) シナリオ 2.3: ディーゼル価格がガソリン価格よりも 50% 高価になった場合シナリオ 2.3 ではガソリン需要の全体に占める割合が 年の 60% から 年の 68% へと増加する一方で ディーゼルの割合は 年で 21% へと低下 他方 CNG の割合は 8% へと増加する BAU と比較して本シナリオの 年における乗用車エネルギー需要は 6.56% 減の 1,766 PJ となる PJ 2,000 1,800 1,600 1,400 1,200 1, 電気 LPG CNG ディーゼルガソリン % 2% 3% 3% 3% 3% 6% 8% 42% 41% 36% 27% 21% 55% 56% 58% 64% 68% 電気 LPG CNG ディーゼルガソリン 図 3-10 燃料別乗用車エネルギー需要の見通し ( 左図 ) 燃料別乗用車エネルギー需要の割合 ( 右図 ) シナリオ 3.1:CNG 価格がディーゼル価格と同水準になった場合これまでのシナリオではガソリンのディーゼルに対する相対的な価格水準 及びディーゼルのガソリンに対する相対的な価格水準を見てきたが シナリオ 3.1 では CNG 価格がディーゼル価格と同水準となった場合を想定 消費者の選好変化を分析した 本シナリオでは CNG の価格優位性が保たれないため 年時点での乗用車エネルギー需要に占める割合も 3% に留まる 年時点での乗用車エネルギー需要は BAU と比較して 0.46% 増の 1,899 PJ となる 44
46 PJ 2,000 1,800 1,600 1,400 1,200 1, 電気 LPG CNG ディーゼルガソリン % 2% 2% 2% 2% 42% 41% 38% 37% 35% 55% 56% 57% 60% 62% 電気 LPG CNG ディーゼルガソリン 図 3-11 燃料別乗用車エネルギー需要の見通し ( 左図 ) 燃料別乗用車エネルギー需要の割合 ( 右図 ) シナリオ 3.2:CNG 価格がガソリン価格と同水準になった場合シナリオ 3.2 でもシナリオ 3.1 と同様に CNG のガソリンに対する価格優位性が維持されないため その乗用車エネルギー需要に占める割合も 年で 2% に留まる 年時点での乗用車エネルギー需要は 1,903 PJ となる (BAU 比 0.7% 増 ) PJ 2,000 1,800 1,600 1,400 1,200 1, 電気 LPG CNG ディーゼルガソリン % 2% 2% 2% 1% 2% 1% 42% 41% 39% 37% 36% 55% 56% 57% 60% 62% 電気 LPG CNG ディーゼルガソリン 図 3-12 燃料別乗用車エネルギー需要の見通し ( 左図 ) 燃料別乗用車エネルギー需要の割合 ( 右図 ) シナリオ 3.3:CNG 価格がガソリン価格よりも 25% 高価になった場合シナリオ 同様 シナリオ 3.3 においても CNG 価格の他燃料価格への優位性が保たれないため 需要も伸びず全体に占める割合としても 年時点で 2% に留まる 年時点での乗用車エネルギー需要は 1,899 PJ であり これは BAU と比較すると 0.48% 増の水準である 45
47 PJ 2,000 1,800 1,600 1,400 1,200 1, 電気 LPG CNG ディーゼルガソリン % 2% 2% 2% 1% 2% 1% 42% 41% 39% 37% 36% 55% 56% 57% 60% 62% 電気 LPG CNG ディーゼルガソリン 図 3-13 燃料別乗用車エネルギー需要の見通し ( 左図 ) 燃料別乗用車エネルギー需要の割合 ( 右図 ) 3.3. シナリオ別乗用車エネルギー需要見通し比較シナリオ別の乗用車エネルギー需要見通しを図 3-14 図 3-15 に比較する 図が示す通り 車種別選好の変化に応じ BAU と比較し 年時点での省エネルギー効果が期待できる 本分析で対象とした車種の中で 想定される燃費が最も悪いディーセル車の割合が小さくなるシナリオ 1.3 では BAU と比較して 年時点での省エネルギー効果が 7.7% に推計される PJ 2,000 1,800 1,600 1,400 1,200 1, BAU シナリオ1 シナリオ2 シナリオ3 シナリオ4 シナリオ5 シナリオ6 シナリオ7 シナリオ8 シナリオ9 図 3-14 シナリオ別乗用車エネルギー需要見通しの比較 ( 年 ~ 年 ) 46
48 PJ 1,950 1,900 1,850 1,800 1,750 1,700 1,650 1,890 1,843 1,758 1,745 1,844 1,791 1,766 1,899 1,904 1,899 図 3-15 シナリオ別乗用車エネルギー需要見通しの比較 ( 年 ) 3.4. 政策への示唆 年には 乗用車保有台数が現状から 5 倍となる 8,000 万台に達する見通しである このため インドにおいて その燃料選択は供給から消費 さらにはその結果としての CO2 排出等 様々なインプリケーションを有する 具体的には 燃料の選択は供給段階において 原油輸入の増加 国内石油精製施設の拡充 天然ガスパイプライン等のインフラ形成に対する大きな影響をもつ 同時に消費の結果として引き起こされる地域ならびに地球環境への影響ついて大きな示唆を持つ そこで ここまでのモデル推計によるシナリオ分析を基に得られた 主に省エネ政策への示唆を以下に集約する 1. 消費者の燃料価格の車種変更に対する弾力性の高さ 省エネルギーポテンシャル インドの消費者は 新車購入時の車種決定において 燃料価格に弾力的に反応することが明らかとなった 具体的には 新車の車種決定要因として燃料価格を重視する傾向にあると指摘できる シナリオ分析が提示する通り ガソリンならびに軽油の相対価格変化によって 消費者は新車購入に際してガソリン車やディーゼル車から CNG 車へ大きくシフトする見通しである 特に 著しく CNG 車へのシフトが進む見通しを提示したのは ガソリン価格がディーゼル価格よりも相対的に 35% 以上高価になった場合である 同様にディーゼル価格がガソリン価格よりも 25% 高価となった場合 ディーゼル車から CNG 車へのシフトが進む 燃料価格の変化による車種変更の弾力性の高さは 低価格で CNG 供給が行われているためである 今回のシナリオ分析では想定していないが 低燃費車 47
49 へのシフトを政策目標とする場合 初期投資コストを補助金支給等で行うことによってそのシフトを促進するポテンシャルを示唆するものである 2. エネルギー供給インフラ整備の必要性 分析から明らかな通り 燃料価格政策の変化は消費者の車種選好に大きく影響を与える このため 燃料別のエネルギー需要構成への変化に対するインフラ整備への影響も指摘できる 将来にわたる具体的なエネルギー供給見通しを描いていない場合 需要に牽引される形でのインフラ形成がなされ エネルギーセキュリティや環境対策のための政策手段が限られてしまう可能性がある 将来的な国内原油生産ならびに天然ガス生産の見通しを踏まえ 輸入確保ならびに国内供給インフラ形成など 統合的なアプローチから政策形成ならびに適切なインフラ形成計画を実現することが必要となる 48
50 4. 鉄道 4.1. 概況インドの鉄道は 大英帝国が植民地としてインドを統治していた時代に大部分が敷設された 1947 年に独立した後 パキスタンの分離独立に伴う印パ国境地域を中心とする鉄道網の再編以外に大々的な増設は行われていない このため 過去 60 年間の総延長の増加は 2 割程度に留まっている 現在 インドの鉄道網は 鉄道省とその管轄下にあるインド国鉄により運営されている インド国鉄が保有する車両のうちディーゼル車両が全体の 5 割を占めているが 今後は各路線の電化が進められていく予定である しかし 鉄道インフラの老朽化が深刻であり 設備更新が急がれている 貨物輸送については かつてはインドの貨物需要の大部分を占めていたが 現在のシェアは 3 割前後にとどまっている インド国鉄としては 少なくとも 5 割にすることを目標としている 主な貨物は石炭 鉄鉱石 セメントなどである 一方で 旅客輸送は 近年急速に増加している ただし 運賃は政策的に低く抑えられており インド国鉄の財政を圧迫する一因となっている 2014 年 7 月の政権交代で誕生したモディ政権は 何年も先送りにされてきた鉄道の運賃改定に乗り出すと報道されている 国鉄以外に 大都市では 急激に増加する旅客需要に対応するために地下鉄 ( メトロ ) の整備が急ピッチで進められている 既に カルカッタ チェンナイ デリー ムンバイ バンガロール グルガーオンで営業運転を開始しており 他の都市でも建設中 計画中のものが多数ある そして インド国鉄は長距離高速鉄道を計画中であり 年連邦予算にも関連予算が盛り込まれた 日本をはじめ フランスや中国がプロジェクトの獲得を目指している 4.2. 所管官庁及び関連企業インドの鉄道網は 鉄道省 (Ministry of Railways) 傘下の国鉄 (Indian Railways) が運営している 図 4-1 は インド国鉄の組織体制の概略である 鉄道大臣の下に鉄道委員会 (Railway Board) が設置され インドの鉄道政策の意思決定をおこなっている この下に 16 の地域に分割された地域会社と国鉄が運営するカルカッタメトロが位置付けられている インドの鉄道網と 17 ブロックの区分を図 4-2 に示す また インド国鉄は車両の生産部門を有している その他に 乗務員を養成するための教育機関や研究開発部門 さらにインド高速鉄道会社等の公営企業がある 49

51 鉄道大臣 鉄道副大臣 鉄道委員会 各地域の鉄道 1. 中央鉄道 2. 東部中央鉄道 3. 東海岸鉄道 4. 東武鉄道 5. 北部中央鉄道 6. 北東部鉄道 7. 北西部鉄道 8. 北東部辺境鉄道 9. 北部鉄道 10. 南部中央鉄道 11. 南東部中央鉄道 12. 南東部鉄道 13. 南西部鉄道 14. 南部鉄道 15. 西部中央鉄道 16. 西部鉄道 17. カルカッタメトロ 生産部門 Chittaranjan 機関車製作所 ディーゼル機関車製作所 旅客車両工場 鉄道車両工場 鉄道車輪工場 その他 中央鉄道電化機構 中央車庫近代化機構 インド国鉄プロジェクトマネジメントユニット インド国鉄代替燃料機構 インド国鉄大学校 公営企業 インド高速鉄道会社 RITES 等 図 4-1 インド国鉄組織図 出典 : 鉄道省資料からエネ研作成 図 4-2 インドの鉄道網及び 17 のブロック 出典 : 50
52 インドでは 国鉄が運営するカルカッタメトロ以外に 5 つの大都市圏でメトロが営業運転をおこなっており これらの運営は国鉄ではなく各メトロの運営会社がおこなっている さらに 7 都市でメトロの建設が進められており 17 都市でメトロの建設が計画されている 表 4-1 に インド国内のメトロ一覧を示す こうしたインド国内でのメトロの建設のうち カルカッタ チェンナイ ムンバイ バンガロール デリーに JICA が協力している 表 4-1 インドのメトロ一覧状況都市営業中カルカッタ チェンナイ デリー ムンバイ バンガロール グルガーオン建設中ジャイプール チェンナイ ハイデラバード ナビ ムンバイ コチ ラクナウ アーメダバード=ガンディナガー計画中ボパル ブバネーシュワル チャンディーガル インドール カンプール ルディヤーナー ナーグプル ナシク パンタ プネー スーラト スリナガー ヴィジャヤワダ ヴィシャーカパトナム ムンバイ グワーハーティー デリー首都圏 出典 :Indian Railways Statistical Publication インド国鉄の概要インド国鉄は毎年統計年鑑を公表している 表 4-2 は直近 10 年間のインド国鉄の総延長 車両数 運賃収入等である これらのデータはインド国鉄が管理する全てのデータが含まれているが 地域ごとのデータは公開されていない インド国鉄の路線の総延長は 1950 年時点で 53,596 キロメートル敷設されており 過去 60 年間で 1 万 2 千キロメートル延伸され 65,436 キロメートルとなっている 直近 10 年でみると 2,215 キロメートル延伸されており 継続的に延伸が進められていることがわかる 運用されている機関車を種別ごとに整理したものを図 4-3 に示す インド国鉄は主要路線の電化を進めており 直近では約 30% が電化されている このため 路線が拡大する中で 相対的にディーゼル機関車の増加よりも電気機関車の増加が大きい 2012 年時点で 5,345 両のディーゼル機関車 4568 両の電気機関車が運用されており さらに 43 両の蒸気機関車も運用されている 51
53 図 4-4 は旅客需要と旅客運賃収入の推移である インドの旅客需要は年々増加し続けており この 10 年で旅客需要が 2 倍に拡大している 一方で 旅客運賃は 政策的に低く設定されており 旅客需要に対する旅客運賃収入の伸びが低く 毎年の旅客運賃収入の変動も大きい 図 4-5 は貨物需要と貨物運賃収入の推移である 貨物需要は経済成長を背景として堅調であり 過去 10 年間で 1.7 倍に増加した これにあわせて貨物運賃収入も増加しており 特に 2012 年 -13 年に運賃を改定したことで 2003 年 -04 年と比較すると貨物運賃収入が 3 倍に増加している 図 4-6 は 2012 年 -13 年の貨物輸送の内訳である 図が示す通り 約 50% が石炭であり これはインドの主要な電源である石炭火力発電所向けの発電用石炭と鉄鋼部門向けのコークスである 次いで 鉄鉱石 セメントなどが約 10% を占めている したがって インド国鉄が取り扱う貨物の大部分は原材料で占められており 貨物運賃の値上げは 重工業部門だけでなく ほぼすべての部門の費用を押し上げることになることがわかる 一方で 鉄道の近代化や改修のために必要な資金を調達するために ある程度確実に回収可能な貨物運賃に偏っているともいえる こうした点は 図 4-4 図 4-5 に示したように インド国鉄の主要な運賃収入源が貨物であることからもわかる 2012 年 -13 年の時点で 運賃収入の内 6% が旅客 残り 94% が貨物である これは 旅客運賃が低く設定されているため これによる赤字を貨物運賃収入で賄っていることが一因となっている また こうした構造によって 鉄道インフラへの投資が滞っている 図 4-7 は 軽油消費量と電力消費量の推移である 直近 10 年で 軽油消費量は 31% 電力消費量は電化が進んだことで 46% 増加している 52
54 表 4-2 インド国鉄の概要 年度 総延長 ( キロメートル ) 63,221 63,465 63,332 63,327 63,273 64,015 63,974 64,460 64, 蒸気機関車 車両数 ディーゼル機関車 4,769 4,807 4,793 4,816 4,843 4,963 5,022 5,137 5, 電気機関車 3,004 3,065 3,188 3,294 3,443 3,586 3,825 4,033 4, 旅客数 ( 単位 : 百万人 ) 5,112 5,378 5,725 6,219 6,524 6,920 7,246 7,651 8, 交通量エネルギー消費量運賃収入 旅客交通量 ( 単位 : 百万人 km) 541, , , , , , , ,508 1,046, 貨物交通量 ( 単位 : 百万トン km) 石炭 ( 単位 千トン ) ディーゼル 2,060,396 ( 単位 : キロリットル ) 2,080,634 2,111,190 2,211,531 2,284,061 2,260,754 2,400, ,699,616 電力 ( 単位 : 百万 kwh) 9, , , , , , , , , , 旅客収入 ( 単位 : 千万ルピー ) 13, , , , , , , , , , 貨物収入 ( 単位 : 千万ルピー ) 27, , , , , , , , , , 出典 :Indian Railways Statistical Publication
55 蒸気機関車ディーゼル機関車電気機関車 車輌数 ( 両 ) ,769 4,807 4,793 4,816 4,843 3,443 3,004 3,065 3,188 3,294 4,963 5,022 3,586 3,825 5,137 5,197 4,033 4, 図 4-3 蒸気機関車 ディーゼル機関車 電気機関車の車両数 出典 :Indian Railways Statistical Publication ,200 5,543 5,656 5,349 6,000 1,000 4,903 4,718 4,941 5,000 旅客交通量 (10 億人キロ ) ,387 3,199 3,668 4,247 4,000 3,000 2,000 旅客輸送収入 ( 千万ルピー ) 200 1, 出典 :Indian Railways Statistical Publication 図 4-4 旅客交通量及び旅客収入 54
56 1,200 83,479 90,000 1, ,744 60,687 56,912 51,749 46,425 41,073 35,535 27,403 30,489 80,000 70,000 60,000 50,000 40,000 30,000 20,000 10, 貨物交通量 ( 百万トン km) 貨物収入 ( 千万ルピー ) 出典 :Indian Railways Statistical Publication 図 4-5 貨物交通量及び貨物収入 肥料, 4.6% その他, 12.2% 原油, 4.0% セメント, 10.5% 石炭, 49.2% 鉄鉱石, 11.1% 鉄鋼, 3.5% 穀物, 4.9% 出典 :Indian Railways Statistical Publication 図 4-6 貨物輸送量内訳 ( 年 ) 55
57 軽油消費量 電力消費量 = 図 4-7 軽油消費量と電力消費量の推移 ( = 100) 出典 :Indian Railways Statistical Publication インド国鉄の省エネ等の取組インド国鉄は急激に増加する輸送需要に対して 路線の拡張や容量の増加に取り組んでいる 同時にエネルギー消費量が急激に増加しており 図 4-7 に示したように 過去 10 年間のトレンドから考えれば 将来的にエネルギー消費量が増加し続けると考えられる このため エネルギー効率を改善する目的で 運転や整備等の自動化技術の開発 IT の活用した効率化に取り組んでいる また 単一の機関車による運行ではなく 出力の小さい複数機関車による運行に切り替えることでエネルギー効率を改善 編成の長大化 運行スケジュールの効率化等 運用面でも取組を進めている しかし 増加し続ける輸送需要への対応とインフラの近代化等が優先され インド国鉄の中で省エネへの取組は低調である また インドは鉄道省と国鉄が一体であるため 規制官庁による省エネルギー政策の推進というよりも 事業者の自主的な努力として省エネルギー施策が展開されている このため 現在行われている省エネ関連の取組がどの程度実施されているのか 実効性に課題が残る 省エネと同様に 消費するエネルギーを代替するために 太陽光エネルギーとバイオ燃料の導入が推進されている 太陽光パネルを駅舎や車庫といったインド国鉄所有建物の屋上に設置することが計画されている また バイオ燃料については ディーゼルとの混合率を 5% に引き上げることを目標としている 56
58 こうした状況の中 UNDP と GEF が資金を拠出し インドの鉄道省や電力省が鉄道部門でのエネルギー効率改善のためのプロジェクト 3 を 2011 年 9 月から開始している この計画では 鉄道部門でのエネルギー効率を改善するために エネルギー管理システムの導入や太陽光発電システムの導入 及び関連する技術の紹介などを予定している 4.5. 新政権の鉄道政策インド国鉄はこれまで国営の鉄道事業者として 営利のための鉄道運営よりも低所得者層向けの福祉という性格を持った経営を行ってきたため 効率性よりも公益性が優先されてきた 一方で 2014 年 7 月に就任したモディ首相は インフラとしての鉄道の充実のため 収入面では適正な運賃設定を原則とし 支出の面では直接投資 (FDI) と官民連携プロジェクト (Public Private Partnership) の活用によるインド国鉄の運営を推進していく意向である 貨物これまで 鉄道による貨物輸送は インドの貨物輸送シェアの 50% ほどを占めていたが 近年はシェアが低下し 30% 程度となっている この理由として 特に 4 大都市を結ぶ主要路線において線路容量がひっ迫していることが挙げられる 貨物は旅客よりも速度が遅く かつ旅客優先のため旅客の追い越し待ちをしなくてはならない こうした状況の中 旅客 貨物それぞれに最適なダイヤや運行が難しい状況が常態化している したがって 貨物の到着時間の見通しが立てられず 原材料のような一次産品以外はトラック輸送に移行したためである 一方で 鉄道輸送は環境面で注目されている 特に気候変動対策として大量の物資を少ないエネルギーで輸送することができる点で 鉄道輸送はトラック輸送よりも優れている そこで トラックによる道路輸送から 鉄道による集合運搬にモーダルシフトを行うことで交通部門のエネルギー効率を改善することを目指した政策が検討されている 具体的な施策として 年連邦予算には主に以下の項目が盛り込まれた 石炭輸送インフラ開発の迅速化により 1 億トンの輸送需要拡大 官民連携による物流センター及び海上交通とつなぐ港の建設を通じた他の輸送手段とのインターフェースの向上 試験的な空き車両の活用システムの構築 業界団体との連携による野菜と果物の輸送量の増加 牛乳用タンカーの建造 4 3 Improving Energy Efficiency in the Indian Railways System ing_energyefficiencyintheindianrailwaysystem.html
59 他にも第 12 次五カ年計画では コンテナ化の推進による貨物の積み替えの迅速化や大型車両の建造やこれまでよりも大きな重量を支えられる車輪の導入を目指している さらに 旅客と貨物双方の輸送量を増加させるためにはまず旅客輸送と貨物輸送を分離する必要がある このため 最も交通量の多い路線から優先的に貨物専用回廊 (Dedicated Freight Corridor) を建設する予定である 年連邦予算で デリーとムンバイをつなぐ西部貨物専用回廊とデリーとコルカタをつなぐ東部貨物専用回廊が承認された 旅客旅客鉄道は インド国鉄が低所得者層向けの福祉として機能している一面として 運賃が低く抑えられていることで 多くの人々の長距離移動の手段となっていることが挙げられる ただし 貨物と同様に ダイヤ通りに運行されておらず 遅延が多発している 一方で インド国鉄では バス等の道路交通や空路と対抗できるよう旅客の高速化が計画されている これは時速 160~200km を目指す既存路線の高速化と 時速 300km 超の新規路線からなる高速鉄道の 2 通りの方法が検討されている 現在 以下の既存路線の準高速化 (160km/h~200km/h) を計画中である デリー =アグラ チェンナイ=ハイデラバード デリー =チャンディーガル デリー =カンプール ムンバイ=アーメダバード ムンバイ=ゴア マイソール=バンガロール=チェンナイ ナーグプル=ラーイプル=ビラ スプル ナーグプル=シカンダラーバード これらのうちデリー =アグラ間の Gatimaan Express が 2014 年 11 月に開始予定であったが 鉄道安全委員会の許可が下りず 未だ運行開始できていない その他の路線については 年の連邦予算で予算が承認されている 時速 300km を超える高速鉄道について これを建設するために長期間にわたって検討されてきた 長い検討期間を経て 2009 年にインド国鉄は 鉄道ビジョン 2020 を発表し 計画を具体化する 6 路線を発表した このうち ムンバイ=アーメダバード間の路線についてフランスの Systra 社とインドの RITES 社 ( インド国鉄の子会社 ) によってプレフィージビリティースタディーが実施されている また 2013 年からは JICA によりより詳細な建設計画の内容についてフィージビリティースタディーを行っている 調査結果は 2015 年 5 月に発表される予定である 58
60 2014 年に入り 7 月にインド鉄道相がインド高速鉄道の最初の区間として ムンバイ= アーメダバード高速鉄道回廊を建設する意向を表明した 費用は 6 千億ルピーとの試算がなされているため 対内直接投資と官民連携型 (Public Private Partnership: PPP) も併せて利用することで資金確保を目指している 同計画に関連して 年の連邦予算のなかで 初期費用として 10 億ルピーが承認された 最終的には デリー ムンバイ カルカッタ チェンナイを高速鉄道でつなぐ Diamond Quadrilateral Network の建設を目指している 現在 日本 中国そしてフランスがインド高速鉄道への参入を目指している 遠隔地 北東部及びアンドラ プラデシュ州とテランガーナ州の開発長大な路線網が敷設されているインドにあって 鉄道インフラの発展が遅れている地域の開発が急がれている 特に 北東部 ( バングラデシュ ブータン ミャンマーそして中国に囲まれている地域 ) やデカン高原とその周辺に位置するアンドラ プラデシュ州と 2014 年 6 月にアンドラ プラデシュ州から独立したテランガーナ州の開発に重点的に資源を割いていくことが予定されている 4.6. 鉄道部門の政策課題 国鉄運営インド国鉄は 公益的な側面をもつ国営鉄道事業者であるが 近年はその非効率性が指摘され 改革の必要性が検討されている インド国鉄は 運賃収入 政府からの借り入れ 民間金融機関からの借り入れの 3 つの収入で運営されている しかし 現在の運賃収入は十分な水準ではなく 政府からの借り入れは返済できない状況にあり 民間からの借り入れは利子のみを返済する状況である このため インド国鉄は恒常的な赤字経営ではあるが 公益的な側面からそれが常態化している インドにおいて鉄道の旅客輸送は公共の福祉として安価な交通手段を提供するサービスとして位置付けられているため 収益を改善するために運賃改定が急務となっているが 値上げは政治的に機微な課題である しかし インド国鉄の旅客運賃の水準では運航費用の 7 割程度しか運賃を回収できておらず 年は旅客部門で 2,200 億ルピーの赤字となった 5 このため 旅客部門の赤字を埋め合わせるために 貨物運賃が高額に設定されている 運賃の改定について 前政権では支持率維持のために 運賃を低く抑えてきたが 新たに誕生したモディ政権では運賃を 14.2% 上げる決定をした 6 ただし この値上げ水準でも抜本的な収支改善に必要な水準にはほど遠い状況である 現状の運賃水準は 旅客輸送を増やした分だけ赤字を計上する構造になっているため 抜本的な収益構造の改革なしには輸送量の増加に対応するための投資を回収することは不可能である 5 12 th Five-year Plan, pp
61 さらに 収入面だけでなく 世界中どこの国鉄でも同じ課題に直面しているように 人件費 ( 給料及び年金 ) がインド国鉄の支出の 50% を占めている インド国鉄は 135 万人を雇用する巨大企業であるが 収益を改善するために人員を整理することは 雇用の確保という公共の要請により これを削減することが難しい さらに 大量の従業員を抱えているため これを支持層としている政治家の存在や強力な労働組合といった障害が存在している そして 最大の課題は 鉄道省が規制官庁であるとともに 鉄道の運営事業者でもあるため 規制を立案する組織として機能することが難しい点である 規制官庁である鉄道省とインド国鉄を分離することが課題とされており モディ首相はそれに取り組む意向を示している 省エネルギーに関する課題インド国鉄の支出に占める燃料費の割合は約 2 割と非常に大きな割合を占めている このため 燃料費を削減するためにエネルギー転換や省エネに取り組んでいる 路線の電化を進めることで 割高な軽油から安価な電力にシフトが進められている ただし 鉄道省内では 国全体では省エネにならないとする意見もある インドでは常に電力が不足しており 鉄道が電力使用量を増加させると グリッドから電力供給を受けられなくなった家庭や事業者が ディーゼル自家発電機を運転する必要に迫られる こうした発電機はディーゼル機関車よりも効率が低いため ディーゼルの使用が国鉄からそれ以外の自家発電に切り替わることで 結果としてより多くの軽油を消費することにつながる このため インド国鉄がディーゼル機関車を使い続けた方が インドの国全体での省エネルギーにつながるという意見がある また インド国鉄は省エネルギーのためにいくつかの施策を実施している しかし どの施策が どれだけエネルギー効率改善に寄与したかという点が把握されていない さらに どういったところでエネルギーが浪費されているかという点を詳細に把握していないため 省エネルギー施策を行うことが難しい状況にある したがって 現在のエネルギー消費実態について細かな分析が課題となっている そして インド国鉄について インドの運輸部門における位置付けが 国の方向性として必ずしも明確となっていない 鉄道は 貨物 旅客ともドアツードアの輸送ができないことが弱点であり 他の交通手段との連携が不可欠となる つまり 統合的な交通政策において 都市内の短距離輸送 都市間の長距離輸送等の明確な位置付けが必要となる 例えば 旅客輸送においては メトロが各地で建設されているが 最寄駅から目的地までの接続 (Last-mile connectivity) のための交通手段を検討する必要がある 貨物輸送には 他の輸送手段 ( トラック 船舶 飛行機 ) との貨物の積み替えを円滑に行うための物流ハブの建設が必要である また こうした他の交通手段との連携は複数の省庁や事業者との調整が必要である 60
62 PAT 制度の可能性 (Perform, Achieve and Trade) BEE はPAT と呼ばれる産業部門のエネルギー消費削減ベンチマークの設定とベンチマーク以上の省エネルギーを達成した事業者は超過分を他の業者に売却できる制度を推進している 現在 BEE 内では これをインド国鉄に適用し 17 の区画ごとに目標値を設定し 区画間で超過達成分を取引できる制度を検討中である ただし インド国鉄はこれに消極的で インド国鉄は鉄道部門を独占しているため PAT は成り立たないとしている また インド政府は省庁間の調整に極めて消極的である性質があるため BEE とインド国鉄との調整は難航することが予想される 61
63 5. ワークショップ開催概要 2015 年 1 月 28 日に 本共同研究の成果を共有するためのワークショップをグジャラート州の PDPU で開催した 当日のプログラムは 別添えを参照されたい ワークショップでは 弊所から本プロジェクトに関する紹介をした上で 簡潔に日本の運輸部門での成功について報告した 続いて 今年度共同研究を行った PDPU と TERI からそれぞれ研究成果について報告された PDPU の Pramod Paliwal 教授から 燃料価格政策や燃費規制 排ガス規制について関連する文献調査の結果から これらの政策のこれまでの経緯や方向性 及び市場調査の際に含意について報告があった 続いて Hemant Trivedi 教授からグジャラート州の二輪及び四輪保有者を対象とした燃料価格や省エネに関する市場調査結果について報告された 次に TERI の Sarbojit Pal 氏から 市場調査結果を活用し 2030 年台の自動車の燃料消費量の見通しについて報告された また インドの自動車市場において ガソリン 灯油 CNG LPG の燃料価格の水準が重要な要因となっており これらの価格水準が変化した場合の自動車市場への影響について試算した結果が報告された 次に 燃料供給事業者の視点から 国営石油販売会社 HPCL(Hindustan Petroleum Corporation Limited) の Arvind Govil 氏から ディーゼルへの補助金撤廃前後の市場の反応について報告された 燃料販売データでは補助金撤廃の影響はなく 一方でこれまでの補助金によりインドの乗用車市場のディーゼル化が進行していると指摘し 軽油の販売量が増加傾向にあることを示した こうした点も踏まえ ディーゼルの効率的利用を促進するために 燃料価格に関連する制度の統合等を検討する必要があると述べた 続いて 国営石油会社 IOCL(Indian Oil Corporation Limited) の Mahesh C. Gupta 氏から 同社の製油所での省エネの取組や 今後の排ガス規制に対応した製油設備の改修等について報告があった そして WIAA(Western India Automobile Association) の Shrinivas Desai 氏から 運輸事業者等の消費者の視点から運輸部門での省エネについて報告があった 同氏は WIAA での運転トレーニング講習の概要について説明したうえで こうしたドライバーのトレーニングの一環として トラックを運転する時の省エネドライブを教えることの重要性が指摘された これは 多くのトラックのドライバーが 安全運転や燃料消費量を意識せずに運転しており 教育や啓発を継続的に進めていくことが重要であると指摘した 次に 政府関連機関から 現在のインドにおける省エネに関連する取組について報告があった まず PCRA(Petroleum Conservation Research Association) の Sumant Kumar 氏から 日本の ECCJ( 省エネルギーセンター ) と共同で実施しているエコドライブの講習の概要について発表し これまで 12,000 人のドライバーを対象として講習を実施 平均で 10% 程度のエネルギー効率の改善につながっていることが報告された こうした取組を踏まえ エコドライブ講習を拡大し ドライバーへの教育と啓発を継続的に実施していくことで 行動を変化させることができると指摘した 続いて BEE(Bureau of Energy Efficiency) の Saurabh Diddi 氏から インドの運輸部門での省エネ政策について報告があった 同氏 62


64 は 2005 年から検討してきた乗用車の燃費基準を 2014 年 1 月に発表 2017 年から規制を開始すると述べたうえで 今後は重量車の燃費基準の策定について PCRA と協力して調査 研究を進めていると述べた ただし 重量車の燃費基準について 実際の燃料消費状況について貨物や運航状況によって千差万別であり データの確保と分析が課題となっていると指摘した また 燃費改善のための技術のロードマップについても検討を進めていると述べた これらの発表を踏まえ 参加者との議論をおこなった その際に 共同研究を踏まえた政策提言案を示し議論をおこなった 提言案について 燃料価格政策について ステークホルダーが投資を決定する際に参照する要因の一つでありある程度の見通しが立てられるような予測可能性が重要であるとの意見があった また 燃費性能に優れる乗用車の普及促進について BEE からインセンティブの付与に対して肯定的な意見が述べられたが 制度設計のためのより詳細な検討が必要となると指摘された そして 政策提言案の中で車検制度のような定期的なメンテナンスについても省エネの観点から重要との指摘があった 図 5-1 ワークショップ写真 63
65 6. 政策提言今後の経済成長によりエネルギー消費量の急激な増加が見込まれるインドの運輸部門において 燃費性能に優れる乗用車の普及のために Pandit Deendayal Petroleum University(PDPU) 及び The Energy and Resources Institute(TERI) とエネルギーの節約と効率改善についての次のような共同研究を行った 政府機関 自動車メーカー エネルギー供給事業者へのヒアリング グジャラート州において燃料価格や省エネに関するアンケート調査 運輸部門に特化した計量経済モデルを用いて 運輸部門の省エネポテンシャルを推計 これらの共同研究結果 短期的に自動車保有者の行動を変化させるための啓蒙活動の強化 中期的に燃費性能に優れた乗用車を普及させていくためのインセンティブ制度の設計 そして長期的には燃料価格制度や燃費規制 排ガス規制の統合による税制や関連する制度のグリーン化が重要である 短期的な啓蒙活動の強化ステークホルダーへのヒアリングやアンケート調査を通じて インドの自動車保有者が燃費の改善に関心を示していることが明らかとなった しかし 燃費改善のための情報へのアクセスが限られており これを改善することはエネルギーを節約するための第一歩である また インドは乗用車のライセンス制度があるが エコドライブの促進など運転者の行動を変えていくための教育カリキュラムは整備されていない さらに インドの自動車メーカーは自主的にドライビングスクールを開校しているが 全ての運転者に対応できる体制とはなっていない そこで こうした点を踏まえ 以下を提案する 1. メーカーとの共同でのエコドライブの促進運動 エコドライブコンテストの実施 公的部門による啓蒙活動だけでなく 乗用車を販売するメーカーと協力することで 燃費改善のための運転方法や燃費性能に優れた乗用車に触れる機会を提供することが重要である こうした取り組みを継続していくことは 乗用車の使用段階での燃料消費量の削減に貢献でき 維持費用に敏感なインドの消費者に燃費性能に優れた乗用車をアピールすることができる アンケート調査の結果 多くの自動車保有者が 3 カ月に一度の割合で何らかのメンテナンスを行っていることが明らかとなった この結果は重要であり 自動車保有者がメンテナンスの機会に 燃費改善のための方法について情報に触れるよい機会となり得る そこ 64
66 で この点を踏まえ以下を提案する 2. 車検制度及び車検を受けるためのインセンティブ付与 定期的な乗用車のメンテナンスを受けることにインセンティブを付与することで 燃費改善に関する情報を提供する機会を創出することができる 例えば 定期的な車検制度を導入することで こうした機会を政策的に創出できる 中期的に必要となる政策措置市場調査の結果から 自動車の保有者は購入段階 使用段階を通してコストに非常に敏感であることが定量的に示された したがって 燃費性能に優れた乗用車を普及させる観点から 何らかのインセンティブを導入することで そうした乗用車の普及を後押しすることができる 具体的には 以下の政策措置を提示する 3. 車体登録時の登録料の減免措置 インドでは乗用車の購入後に登録料を一括して支払うことで登録される この際の登録料には 燃費性能などが考慮されていない 燃費性能に優れた乗用車の普及を促進していくためには 車体登録時の登録料を減免することが非常に重要である 4. 燃費性能に優れた乗用車に対するインセンティブの付与 インドは 年から燃費基準が導入される 同時に 5 段階評価によるラベル制度の導入を準備している こうした制度で定義される燃費性能に優れた乗用車の普及を促進していくために 補助金の導入が重要である 5. 旧型車への買い換えインセンティブ インドは 初回登録があるのみで その後の乗用車の使用状況については統計が存在しない ( 初回登録後 15 年 5 年 5 年ごとに登録料の支払いが必要 ) また 一部地域では大気汚染対策として車齢 15 年以上の乗用車を排除する制度が導入されているが 実施に課題がある インドでは燃費性能の低い乗用車が継続的に使用され 大量の燃料を消費している こうした乗用車の入れ替えを促進するためには旧型車の買い換えを促進するためのインセンティブが必要である 例えば 初回登録時の書類に基づき 15 年経過した乗用車をスクラップし買い換 65
67 えた場合の優遇税制や補助金の導入が重要である 長期的な政策枠組みの方向性インドの運輸部門には 燃費性能に優れた乗用車を普及させることによる大きな省エネポテンシャルが存在する 将来的に これの実現に資する政策立案ならびに制度の導入が必要である 6. 燃費性能に優れた軽量乗用車 重量乗用車の普及促進 インドが導入を検討している燃費基準は車両重量と CO2 排出量を基にしている このため 軽量で燃費性能に優れる小型車が 大型車に比べて相対的に規制水準が厳しいものになっている 将来的にインドの消費者の選好が大型車にシフトする中で 燃費性能に優れる大型車の普及を進めていくことが重要である 7. 燃料価格政策 関連税制のグリーン化 インドは燃料価格に対する補助金を支出しているが 低廉な燃料価格は運輸部門のエネルギー消費量を増加させる要因となる 国際的な国際価格の上昇による財政負担の増加により 2010 年にガソリンへの補助金の支出が打ち切られた 2014 年には 石油価格の下落を受けてディーゼルへの補助金を打ち切った 一方で 燃料価格に含まれる物品税が急遽引き上げられた インドの消費者は乗用車の維持費用に影響する燃料価格の見通しに非常に敏感であり 購入段階での燃料選択に影響するため 燃料価格の将来の見通しを確保することは非常に重要である 同時に 省エネを進めていくためには 消費者の購入に影響を与える物品税等の税制の長期的なグリーン化の方向性が非常に重要である 66
68 7. 今後の課題 本年の調査結果を踏まえ 以下の点が今後の課題として挙げられる 1. 燃料転換から燃費改善への移行 インドの消費者は燃料価格に非常に敏感であり 価格の変化に対して燃料の転換による対応を行う傾向がある 一方で 燃費性能に優れる乗用車は割高であり 購入段階で敬遠されてしまう 燃費性能の優れた乗用車への移行を促すためのインセンティブが重要であることは BEE へのヒアリングやワークショップでの議論で共有されているが 具体的なインセンティブを付与できる制度が存在していない あるいはインセンティブとして機能させることが困難な状況である 燃料転換ではなく燃費改善による省エネに移行するためにも インド政府及びカウンターパート機関と共同でインセンティブ制度の設計や定量的な分析を示すことが必要である 2. エコドライブなどの省エネ行動を促すための啓発 アンケート調査から 乗用車の利便性を損なうような省エネ行動に消極的であることが明らかとなった 一方で 燃費を改善するための運転方法への高い関心が示された このため インドで乗用車の所有者に対してエコドライブを普及させ 省エネ行動を促すための啓発の枠組みを構築していくことが必要である また 日系メーカーと共同でこうした取組みを進めることで 将来的な燃費性能に優れる乗用車の普及につなげることを検討していく必要がある 3. モーダルシフトの可能性 インド各地で大気汚染や渋滞対策として交通インフラの整備が進められている この 1 つとして 大都市圏を中心にメトロの整備が進んでいる しかし アンケート調査からモーダルシフトの可能性が非常に低いことが示唆された グジャラート周囲以外の地域でも同様であるか 省エネの観点からも継続して調査を進めていく必要がある 4. 重量車の燃費基準策定 インドでは 2014 年 1 月に 2017 年から燃費規制を開始すると発表があった これは乗用車を対象とする物である トラック輸送が急速に拡大しているが 多くが旧型トラックで運行も効率的ではないことが課題となっている 67
69 BEE は乗用車の燃費基準に続いて 重量車の燃費基準についても検討を開始している 既に 日本では重量車のトップランナー制度が導入されており こうした知見をインド側と共有し活用することができると考えられる 68
70 Appendix 1 アンケート質問票 Questionnaire 0 Basic information of the respondents such as: 0.1 Gender Male / Female 0.2 Age years years years years years years and above 0.3 Occupation (choose from below) 1. Private service 2. Govt. service 3. Self-employed (like business, professional, freelancer, etc) 4. Retired 5. Unemployed 6. Housewife 7. Other (specify ) 0.4 Size of household (No of people) 0.5 Household type 1. Joint, 2. Double income with kids 3. Double income without kids 69
71 4. Single income with kids 5. Single income without kids 0.6 Living area (urban, suburban, rural, etc.) 1. Urban 2. Suburban 3. Rural 0.7 Total Monthly Household Income 1. Less than Rs 30, <Rs 30,000-50, <Rs 50, , <Rs 100, , <Rs 200, , More than Rs 500,000 1 Profile of motorized vehicles in household for personal use 1.1 Two wheelers 1. No. of two wheelers in the household 2. On an average the two-wheelers are years old. 1.2 Four wheelers 1. No. of four wheelers in the household 2. On an average the two-wheelers are years old. 3. Details about the four wheelers in the household SN. Manufactu M Seatin Engin Fue Fuel Avg. Purc Date of rer od g e l efficienc Month hase Purcha el capaci capaci typ y (on ly use cost se ty ty (cc) e road) 70
72 Vehicle usage 2.1 Our typical usage of 1 two wheeler in the family is: 1. No. of to & from trips (total) in a week; 2. No. of Kms. per week; a. Up to 25 b. 50 c. 75 d. 100 e. 150 f. 200 g. more 2.2 Our typical usage of 1 four wheeler in the family is: 1. No. of to & from trips (total) in a week; 2. No. of Kms. per week; a. Up to 50 b. 100 c. 250 d. 500 e
73 f g. More 2.3 Our fuel consumption for different types of fuel on weekly basis is: Sr. No more a. Petrol Ltrs b. Diesel Ltrs c. LPG Kgs d. CNG Kgs e. Electricity [No. of recharges] 2.4 Our fuel consumption per month in Rupee terms is: Sr <500 No a. Petrol b. Diesel c. LPG d. CNG e. Electricity more 2.5 Our fuel consumption as a proportion of our monthly household income is: 1. 5% 2. 10% 3. 15% 4. 20% 5. 25% 6. More 72
74 2.6 We plan our monthly fuel budget on a regular basis. Yes / No 2.7 If yes, what is the method you follow to prepare your monthly budget? Explain briefly, 2.8 Do you get your car serviced (inspection/maintenance) periodically? Yes / No 2.9 If yes, how often do you get your car serviced? 1. Once a month 2. Once every three months 3. Once every six months 4. Once a year 5. Once every three years 2.10 By whom do you get your car serviced? 1. I do it myself 2. By my friend 3. Authorized manufacturer service center 4. Local service center 2.11 Our average annual car maintenance cost is: 1. Less than Rs 3,000 73
75 2. <Rs 3,000-5, <Rs 5,000-10, <Rs 10,000-20, <Rs 20,000-50, More than Rs 50,000 3 Factors considered for purchasing a new car 3.1 We have planned to replace or add a new vehicle in near future. Yes/No 3.2 Primary reason for buying a new car; 1. Old car had low mileage 2. High maintenance cost of the old car 3. Old car had aged and had to be replaced 4. Growing needs of the family 5. To meet increasing commute needs 6. For meeting various social needs 7. Other reasons 3.3 We have bought same size and type of vehicles (when replaced or added vehicles) Yes / No 3.4 While buying a vehicle the following parameters are considered by us: 74
76 (Rank 1 for very high importance to 5 least importance) Sr. No a. Price (capital cost) b. Maintenance Cost c. Running cost d. Design e. Engine Power f. Fuel/Engine type e.g. Petrol, diesel, CNG, LPG, Electric g. Vehicle sturdiness h. Manufacturer/brand i. Vehicle weight j. Occupancy k. Manufacturers claims on fuel efficiency l. On-road fuel efficiency m. other customers opinions n. Automobile experts views in media o. My known mechanics opinion p. Special deals/offers q. Track record 3.5 What is the price range in which you are looking to buy this new car? 1. Less than Rs.3 lakhs 2. Rs.3 to 6 lakhs 3. Rs.6 to 10 lakhs 4. Rs.10 to 15 lakhs 5. More than Rs.15 lakhs 75
77 4 If you are planning to purchase a 4 wheeler in the near future? 1. If planning to purchase a petrol, then go to Q no If planning to purchase a diesel, then go to Q no If planning to purchase a CNG, then go to Q no On an average a diesel car costs about Rs. 1 lakh more than the equivalent petrol car variant while petrol prices are about 14% higher than diesel prices.7. If price differential between petrol and diesel were to increase (with petrol becoming more expensive than diesel) and other fuels remaining at the same price difference as of today, then what would be the impact on your choice of car fuel technology under the following situations: a. Petrol prices become 25% higher than diesel prices a. Will still surely choose a petrol car b. Might reconsider the petrol car c. Re-consider buying some other fuel car d. Will surely choose some other fuel car 1. If response is either b, c or d, then what would be the alternate vehicle fuel choice be? a. Diesel b. CNG c. LPG d. Electric 2. If response is either b, c or d, go to Question No. 4.4, else continue. 7 In Gandhi Nagar - Petrol(Rs.67.75/lt) and HSD prices (Rs.59.42/lt) as applicable From Midnight: October, November, , as reported in and on 3rd November,
78 b. Petrol prices become 35% higher than diesel prices a. Will still surely choose a petrol car b. Might reconsider the petrol car c. Re-consider buying some other fuel car d. Will surely choose some other fuel car 3. If response is either b, c or d, then what would be the alternate vehicle fuel choice be? a. Diesel b. CNG c. LPG d. Electric 4. If response is either b, c or d, go to Question No. 4.4, else continue. c. Petrol prices become 50% higher than diesel prices a. Will still surely choose a petrol car b. Might reconsider the petrol car c. Re-consider buying some other fuel car d. Will surely choose some other fuel car 5. If response is either b, c or d, then what would be the alternate vehicle fuel choice be? a. Diesel b. CNG c. LPG d. Electric 77
79 4.2 On an average a diesel car costs about Rs. 1 lakh more than the equivalent petrol car variant while diesel prices are about 14% lower than petrol prices8. If price differential between diesel and petrol were to invert (with diesel becoming more expensive than petrol) and other fuels remaining at the same pr i ce difference as of today, then what would be the impact on your choice of car fuel technology under the following situations: 1. Diesel prices become as much as petrol prices a. Will still surely choose a diesel car b. Might reconsider the diesel car c. Might consider buying some other fuel car d. Will surely choose some other fuel car 2. If response is either b, c or d, then what would be the alternate vehicle fuel choice be? a. Petrol b. CNG c. LPG d. Electric If response is either b, c or d, go to Question No. 4.4, else continue. 3. Diesel prices become 20% more than petrol prices a. Will still surely choose a diesel car b. Might reconsider the diesel car c. Might consider buying some other fuel car d. Will surely choose some other fuel car 8 In Gandhi Nagar - Petrol(Rs.67.75/lt) and HSD prices (Rs.59.42/lt) as applicable From Midnight: October, November, , as reported in and on 3rd November,
80 4. If response is either b, c or d, then what would be the alternate vehicle fuel choice be? a. Petrol b. CNG c. LPG d. Electric If response is either b, c or d, go to Question No. 4.4, else continue. 5. Diesel prices become 50% more than petrol prices a. Will still surely choose a diesel car b. Might reconsider the diesel car c. Might consider buying some other fuel car d. Will surely choose some other fuel car 6. If response is either b, c or d, then what would be the alternate vehicle fuel choice be? a. Petrol b. CNG c. LPG d. Electric If response is either b, c or d, go to Question No. 4.4, else continue. 7. If the same model and car make chosen was made available in a CNG variant and at the same price with CNG made adequately available, would you consider buying it instead? Yes/No e. If no, then why not? Go to Q. no
81 4.3 On an average a CNG car costs about Rs. 50,000 more9 than the equivalent petrol car variant. However, its running cost is almost half that of petrol per kilometer.10if the price of CNG increased with other fuels remaining at the same price difference as of today then what would be the impact on your choice of car fuel technology under the following situations: 1. CNG prices become as much as diesel prices a. Will still surely choose a CNG car b. Might reconsider the CNG car c. Might consider buying some other fuel car d. Will surely choose some other fuel car 2. If response is either b, c or d, then what would be the alternate vehicle fuel choice be? a. Petrol b. Diesel c. LPG d. Electric If response is either b, c or d, go to Question No. 4.4, else continue. 3. CNG prices become as much as petrol prices a. Will still surely choose a diesel car b. Might reconsider the CNG car c. Might consider buying some other fuel car d. Will surely choose some other fuel car 9 Based on average Wagon R prices across different models as on 3 rd November, 2014 from 1_dvlink 10 Petrol versus CNG cost comparisons as available at: on 3rd November,
82 4. If response is either b, c or d, then what would be the alternate vehicle fuel choice be? a. Petrol b. Diesel c. LPG d. Electric 5. CNG prices become 25% more than petrol prices a. Will still surely choose a CNG car b. Might reconsider the CNG car c. Might consider buying some other fuel car d. Will surely choose some other fuel car 6. If response is either b, c or d, then what would be the alternate vehicle fuel choice be? a. Petrol b. Diesel c. LPG d. Electric If response is either b, c or d, go to Question No. 4.4, else continue. Go to Q. no If an electric variant of the same car that you are buying today was made available to you at the same price along with adequate public charging facilities, would you consider buying it instead? Yes/No 1. If not, then why so? 81
83 4.5 In your opinion as compared to petrol/diesel the use of alternative fuels used in vehicles lead to the following: CNG LPG Electric increases transport economy Yes / No Yes / No Yes / No improves vehicle life Yes / No Yes / No Yes / No reduces air pollution Yes / No Yes / No Yes / No reduces noise Yes / No Yes / No Yes / No reduces space in vehicle Yes / No Yes / No Yes / No increases carrying capacity Yes / No Yes / No Yes / No increases pick-up (0-50 kmph) Yes / No Yes / No Yes / No makes road transport very expensive Yes / No Yes / No Yes / No 5. Response to fuel price change 1. When the fuel prices go up we respond in the following manner [Please tick mark suitably.] Sr. Strongl Neutra No Statement y Agree l. Agree a. We reduce our fuel consumption by specific efforts b. we decrease our fuel budget allocation c. we divert budget from other expenses to fuel consumption d. we have switched our fuel type; Petrol to Diesel e. we switched our fuel from Disagr ee Strongl y Disagr ee 82
84 Petrol/Diesel to CNG, LPG, Electric. f. we opt for car / vehicle pooling g. we switched from four wheelers to two wheelers h. we started practicing No Car day & No Two Wheeler Day during the week/month. i. we opted for work from home option j. we reduced from 6 days to 5 days working per week k. we stopped using air conditioner in our car l. we learnt and started conducting efficient driving techniques m. we sold off our two wheeler / car n. we bought a more fuel efficient car o. Any other technique / strategy to balance fuel price hike. 6. Urban transport 1. I use public transport per week 2. I use the following urban transport: i. Bus 83
85 ii. Auto - rickshaw iii. Railway iv. Metro v. Other 3. If the fuel prices go up, would you opt for more utilization of public transport? Yes / No 4. If yes, which urban transport would opt for? i. Bus ii. Auto - rickshaw iii. Railway iv. Metro v. other 84
86 Appendix 2 アンケート結果 Research Report Study to promote energy savings in Indian Transport Sector 1.1 Introduction: Institute of Energy Economics Japan (IEEJ) and School of Petroleum Management (SPM), Pandit Deendayal Petroleum University (PDPU) Gandhinagar collaborated to undertake a joint market research study to understand the choices and behaviors of users of two and four wheel vehicles in the state of Gujarat. This research project is funded through funding by Ministry of Economy, Trade and Industry of the Government of Japan. The prime objective of this market research study is to understand the choices and behavior of users of two wheel and four wheel vehicles so that based on findings and conclusions of the study a set of recommendations could be submitted to the Government of India towards developing a fuel pricing policy which would lead to fuel efficient consumption of fossil fuels and other alternative fuels. 1.2 Rationale for the study: It is forecast that automobile demand in India will continue to increase. This will lead to an increase in fuel consumption over the next few years. With delay in abolishment of fuel subsidy for various reasons the financial burden on national treasury and petroleum companies continues. Fuel economy standards are under consideration by the Government of India but this would lead to increase in the prices of the vehicles compliant with such standards. On the other hand vehicle emission control standards have been introduced to minimize air pollution without being able to create supply of fuel that meets those norms. Thus with increasing demand for petroleum products, subsidy burden delayed, and lack of availability of technology either for low emission fuels or for high efficiency vehicles, it becomes imperative to devise a policy that helps resolve the identified issue and improves energy consumption structure of the country. With this background and rationale the market research study is undertaken. 85
87 1.3 Research Methodology: To understand the choices and behavior of users of two and four wheel vehicles in the state of Gujarat it was decided to undertake an exploratory research study through a well developed data collection instrument. To obtain a state wide understanding and also to obtain responses from large cities and smaller towns, quota sampling is employed. With identified objectives of the research study a questionnaire was jointly developed by team members of the IEEJ and SPM-PDPU. To support the contribution of TERI Delhi, suitable questions were added as per joint discussion between IEEJ and SPM-PDPU. 1.4 Research Objectives: It is important to understand the choices of vehicles, fuels and technologies amongst the users of two wheel and more importantly four wheel vehicles. It is also important to understand factors effecting fuel choices and arguments against particular fuel option. Finally it is important to understand customer response to fuel price changes. Accordingly the following research objectives are listed for the market research study To obtain the demographic profile of users of two and four wheel vehicles Understand vehicles ownership and usage patterns for two and four wheel vehicles Understand future plan for purchase of four wheel vehicles Understand factors considered while deciding on purchase of four wheel vehicle Understand response to fuel price changes across various fuel choices Understand the modal shift behavior in respect of public transport 1.5 Data Collection, Collation and Cleaning: For the identified research objectives data is collected from eight cities and towns across Gujarat State using a well structured pilot tested questionnaire. Professionally trained teams of data collection executives are used for efficient and effective data collection. Data responses are collected from 1100 respondents of which one is not considered for data analysis due to incomplete responses. Collected data was entered in M S Excel software by qualified team of data 86
88 entry operators and was double blind checked for accuracy. Minor entry errors were corrected through physical verification. After correction data was collated for suitable tabulation and cleaning before transporting to SPSS software. Through SPSS software tables for responses are generated for frequency and percentage responses. Due to the nature of questioning not all respondents would respond to all questions and hence valid percentages of responses are calculated as applicable. Appropriate cross tabulated percentages are also drawn from the available data set. 1.6 Analysis and Interpretation: Having developed tables for all question-responses and relevant cross tabulations, charts and graphs the data is subjected to analysis. The process followed is to pick out the salient data points in the form of minimum and maximum values and outlying values for each tabulated data. Data reading is thus undertaken. Data reading leads to interpretation of meaning offered by the data set for us to draw inferences and conclude the possible behavior and choice estimates. 2 Data presentation, reading, inferences and conclusions: The following sections offer data presentation, readings and inferences that help build the conclusions from the data available. 2.1 Respondent Profile: For any study it is important to get responses from the correct sample through suitable sampling design and implementation. The following data presentation helps understand sample profile which decides if the sample is a good representative of the population under study. Table A, Centre-wise Sample Distribution Frequency Percent Valid Percent Cumulative Percent Valid Ahmedabad Anand Bhavnagar Rajkot Baroda Surat Mehsana
89 Bhuj Total Readings Total sample size is 1099 respondents from 8 different cities across Gujarat state. The highest percentage is 18.2% for Ahmedabad & 18.1% for Surat. Rajkot & Baroda have 13.6% & 13.7% respectively. Respondent from all other smaller cities constitute approximately 9% of total sample. Inferences Total sample size for the research, covering 8 cities across the state, with more than 1000 respondents is a good representative sample for the research work. The demography of the respondents matches the prevailing country demographic conditions including both big and small cities. Table B, Two / Four Wheelers Ownership Frequency Percent Valid Percent Cumulative Percent Valid Two Wheeler Four Wheeler Total Readings Of total respondents 30.1% are the owner of two wheeler vehicle. 69.9% respondents are owners of four wheeler vehicle. Inferences Larger representation of four wheeler owners offers better understanding of the four wheel vehicle owners behavior. 88
90 Since four wheel vehicles consume more fuel the impact of the fuel prices is more on the four wheeler owners, hence the sample is taken accordingly. Table 0.0.1, Respondent Gender Frequency Percent Valid Percent Cumulative Percent Valid Male Female Total Missing System 4.4 Total Readings Percentage of male respondents is approximately 82.6%. Percentage of female respondents is approximately 17.4%. Inferences Major respondents are male which is depicting the societal situation of the country. Table 0.0.2, Respondent Age Frequency Percent Valid Percent Cumulative Percent Valid More than Total Missing System 2.2 Total
91 Readings The data is categorized into 6 categories from age group like 18-20, 21-30, 31-40, 41-50, & more than 60 The highest percentage is 47.9% from the age group Respondent from age group are of 24.9%. The percentages from the age group & are 14.3% & 7.2% respectively. Inferences Majority of the respondent are of (21-30) age group with 47.9%. The most of the vehicle owners are in the age group of which consist of 72.9%. The vehicle owners with age more than 60 are very few in numbers. Table 0.0.3, Respondent Occupation Frequency Percent Valid Percent Cumulative Percent Valid Private Service Govt Service Self-employed Retired Unemployed Housewife Others (Student) Total Missing System 6.5 Total Readings 90
92 Majority of the respondents are private employees with a high percentage of 50.4% of total. Total self employed personnel are 29.1% of total. The Housewife and others (which also includes students) are 6.8% & 7.8% respectively. Inferences Half of the vehicle owners are private employees. Another majority section of the vehicle owners are self-employed personnel. Astonishingly govt. employees are not the major vehicle owners with very less percentage of 3.4%. Table 0.0.4, Respondent Household size (No. of people) Frequency Percent Valid Percent Cumulative Percent Valid Total Missing System Total Readings 91
93 33.8% of the respondents have 4 members in the household. Respondents with the family size of 5 & 6 are of 25.3% & 19.9% respectively. Table 0.0.5, Respondent Household size (by category) Frequency Percent Valid Percent Cumulative Percent Valid Total Missing System Total Readings There are 9.9% respondents with the family size of 3 or less than 3 members 60.5% of respondents are having family of 4-5 members. 28.9% of respondents are there with more than 5 members in the household. Common Inferences for Table & Table % of respondents have household size of 4-6 members. 9.2% of respondents have 7 or more members in the family. Very respondents are there with number of households 3 or less than 3. Table 0.0.5, Respondent Household type Valid Cumulati Frequency Percent Percent ve Percent Valid Joint Double Income with Kids Double Income without Kids Single Income with Kids Single Income without Kids Total Missing System
94 Table 0.0.5, Respondent Household type Valid Cumulati Frequency Percent Percent ve Percent Valid Joint Double Income with Kids Double Income without Kids Single Income with Kids Single Income without Kids Total Missing System 4.4 Total Readings Respondent household type is categorized into 5 categories like joint families, double income with and without kids, & single income with & without kids. Maximum respondents are of category single income with kids which is 47.4%. Joint families constitute significantly of 41.4% of total respondents. Inferences Respondents consist majorly of two extreme household types, either from joint families or from single income with kids. Joint families still exist in the country which is significantly showing in sample with 41.2%. Highest percentage is 47.2% of the type single income with kids. The other types of households consist only 11.2% of the total respondents. Table 0.0.6, Respondent Domicile type (urban, sub-urban, rural, etc.) Frequency Percent Valid Percent Cumulative Percent Valid Urban
95 Suburban Rural Total Missing System 8.7 Total Readings Respondent s domicile type is categorized into 3 types, urban, suburban & rural. Urban respondents are 98.9% of total respondents. Suburban & rural category consist only 1.1% of total respondents. Inferences Respondents are majorly from urban area only. Suburban & rural areas are not the significant part of the research. Table 0.0.7, Respondent Total Monthly Household Income Frequency Percent Valid Percent Cumulative Percent Valid Less than 30, ,000-50, ,000-1,00, ,00,000-2,00, Total Missing System 2.2 Total Readings Total monthly income is categorized into 4 categories like less than 30000, , , The income group of consists of 48.3% of total respondents. Respondents with income less than are 42.2% of total respondents. 94
96 Inferences Majority of the respondents for the research are from middle class income group and which consist of 90.5%. Higher income group consist only 9.4% of total respondents. Over all conclusions on respondent profile: From the above data presentation, reading and inferences it is evident that the sample is very representative of the population targeted for the study. The geographic spread and number of responses from different parts of the state covers all geographies. Similarly the sample represents the population on identified demographic variables of income, age, occupation, size and household type and rural-urban domicile. 2.2 Personal use motorized vehicle ownership: It is necessary to understand the current scenario of motorized transport ownership for personal use. Accordingly questions were included in the questionnaire to obtain data on the ownership patterns of two and four wheel vehicles. The following sections provide data reading, interpretation and inferences to conclude the ownership profile of motorized vehicles in the households of Gujarat. Table 1.1.1: Personal use Motorised Vehicle Ownership: No. of Two Wheelers Frequency Percent Valid Percent Cumulative Percent Valid or more Total Missing System 2.2 Total Readings Total number of two wheelers in the household is categorized into 3 categories for this question; 1 two wheeler per household, 2 two wheeler per household, 3 or more two wheeler per household. Household with 2 two wheelers are the highest which is 45.7%. Households with only 1 two wheeler are 42.8% of total respondents. 95
97 Inferences Majority of the household have only 1 or 2 two wheelers in the sample. Households with 3 or more than 3 two wheelers are also significantly 11.6% of total respondents. Table 1.1.2, Average age of Two wheelers in the household: No. of years Frequency Percent Valid Percent Cumulative Percent Valid Total Missing System 7.6 Total Readings Two wheelers which are 3 year old, 4 year old and 5 year old are 24.6%, 23%, & 15.6% of the total sample. Two wheelers which are only 2 year or less than 2 year old are 18.2%. 96
98 Two wheelers more than 5 year old consist of 18.6%. Table 1.1.2a, Average age of Two wheelers in the household: (by category) Frequency Percent Valid Percent Cumulative Percent Valid 2 years or less to More than Total Missing System 7.6 Total Readings Average age of the two wheelers is categorized into 3 categories like 2 or less than 2 year old, from 3-5 year old and more than 5 year old two wheelers. 63.2% of the total two wheelers are 3-5 year old. Two wheelers which are only 2 or less than 2 year old are 18.1% of total Two wheelers with the respondents. Common inferences for Table 1.1.2, Average age of Two wheelers in the household: No. of years & Table 1.1.2a, Average age of Two wheelers in the household: (by category) Majority of the respondents use their two wheelers for only 5 or less than 5 years which is 80.9%. There is also not so high percentage (only 4.2%) of new two wheelers in the survey. Table 1.2.1, Personal use Motorised Vehicle Ownership: No. of Four Wheelers Frequency Percent Valid Percent Cumulative Percent Valid
99 Total Missing System Total Readings 92.9% of the respondents have only 1 four wheeler in the household. Percentage of household with no four wheeler or 2 four wheelers are 3.2% & 3.5% respectively. Inferences Most of the respondents are the owner of 1 four wheeler in their household. Only 3.9% of total respondents have 2 or more four wheelers in their household. Table 1.2.2, Personal use Motorised Vehicle Ownership: No. of years Frequency Percent Valid Percent Cumulative Percent Valid
100 Total Missing System Total Readings Percentage of four wheelers of age 2 years, 3 years, & 4 years are 24.1%, 23.9%, 15.9%. Percentage of new four wheelers which are 1 or less than 1 year old are 12.3%. Four wheelers of age 10 years or more than 10 years is very low of 3%. Table a, Average age of Four wheelers: (by category) Frequency Percent Valid Percent Cumulative Percent Valid 2 or less to or more Total Missing System Total Readings Average age of four wheelers is categorized into 3 categories like 2 or less than 2 years, 3-5 years, & 6 or more years. Majority of the four wheelers are of age from 0-5 years which is 83.8%. 16.3% of the four wheelers are of age 6 years or more than 6 years. Common inferences for Table 1.2.2, Personal use Motorized Vehicle Ownership: No. 99
101 of years & Table a, Average age of Four wheelers: (by category) Significant percentages (i.e. 36.6%) of respondents have new four wheelers which are 2 year old or less than 2 year old. Almost half of the total four wheelers are of age between 3-5 years. Respondents do not use very old four wheelers which are 10 or more than 10 year old. Overall conclusions on personal use motorized vehicle ownership: With about 30% respondents as owners of two wheelers on an average one to two two-wheelers are owned in a typical household. Most two wheelers are not more than 6 years old with almost 50 % being up to three years old. Average age of two wheelers can be considered up to 3.5/4 years with most vehicles going off the roads by the 7 th year. Most households own only one four wheeler per household. Most four wheelers are less than 5 years old with most vehicles going off the roads by the 7 th year. 2.3 Personal use motorized vehicle usage: To estimate typical usage pattern of owners of two and four wheel vehicles questions were included to collect data for the same. The data in form of number of trips per week and number of kilometers travelled per week is obtained. To estimate fuel usage, data is collected for average weekly consumption in volume and value terms for different fuels. Funding habits are estimates by collecting data on fuel consumption as percentage of monthly household income and budgeting habits. Further it is necessary to evaluate habits of vehicle maintenance and servicing. The following section presents the vehicle usage and fuel consumption related information. Table Number of to and from trips per week: Two Wheelers Frequency Table Cumulative Frequency Percent Valid Percent Percent Valid
102
103 Total Missing System Total Readings There are 1099 respondents from which 1087 have responded suitably and data of 12 respondents is incomplete. There is highest frequency of 169(15.4%) amongst 20 to & from total trips in week. The following values of number of to & from trips have shown minimum 102
104 frequency of 1:- 0, 1, 4, 11, 21, 27, 38, 42 and 50. Total percent of frequency of 1 is 0.9%. Table Number of to and from trips per week: Two Wheelers (Categorised) 2 Wheeler - No of to & from trips in a week in category Cumulative Frequency Percent Valid Percent Percent Valid 15 or less to or more Total Missing System Total Readings Data is divided into three categories with number of to and from trips per week being 15 or less, 16 to 25 and 26 or more. There are 1099 respondents from which 1087 have responded suitably and data of 12 respondents is incomplete. Maximum frequency of 576(52.4%) can be seen in the category of 16 to 25. Minimum frequency of 240(21.8%) can be seen in the category of 15 or less. Inferences Most of the population has 16 to 25 numbers of trips per week. Table Number of Kilometres travelled per week: Two Wheelers 103
105 Cumulative Frequency Percent Valid Percent Percent Valid Up to More than Total Missing System 4.4 Total Readings There are 1099 respondents from which 1095 have responded suitably and data of 4 respondents is incomplete. There is a maximum frequency of 271 for those who have travelled 100 kilometres per week. There is a minimum frequency of 4 for those who have travelled 25 and below kilometres per week. Inferences 271(24.7%) respondents, which are maximum, travel 100 kilometres per week. 104
106 There are only 4(0.4%) respondents who travel 25 and below kilometres per week. Table Number of to & from trips per week: Four Wheelers Cumulative Frequency Percent Valid Percent Percent Valid
107
108 Total Missing System Total Readings There are 1099 respondents from which 746 have responded suitably and data of 353 respondents is incomplete. There is maximum frequency of 120 for 10 to and from trips per week. There is minimum frequency of 1 for the following values of number of to and from trips per week: - 9, 13, 17, 36, 38, 45, 50, 55, 60, 84, 91, 100 and 105. Table Number of to & from trips per week: Four Wheelers (Categorised) Cumulative Frequency Percent Valid Percent Percent Valid 10 or less to or more Total
109 Missing System Total Readings There are 1099 respondents from which 746 have responded suitably and data of 353 respondents is incomplete. Data is divided into three categories: 10 or less, 11 to 20 and 21 or more to and from trips per week. Maximum frequency of 335 is therefore the category of 11 to 20 to and from trips per week. Minimum frequency of 88 is there for the category of 21 or more to and from trips per week. Inferences Most number of respondents have between 11 to 20 to and from trips per week. Only few respondents have 21 or more to and from trips per week. Table Number of Kilometres travelled per week: Four Wheelers Cumulative Frequency Percent Valid Percent Percent Valid Up to
110 More than Total Missing System Total Readings There are 1099 respondents from which 750 have responded suitably and data of 349 respondents are incomplete. Maximum frequency of 377 is there for 100 kilometres travelled per week. Minimum frequency of 1 is there for travel per week of 1000 or more kilometres. Inferences Most of the respondents are those who travel 100 kilometres per week. Respondent who travels 1000 or more kilometres per week are rare. Table 2.3A Weekly fuel consumption: Petrol in litres Cumulative Frequency Percent Valid Percent Percent Valid Less than
111 More than Total Missing System 4.4 Total Readings The data is divided into the followings even categories: less than 5, 6 to 15, 16 to 25, 26 to 40, 41 to 50, 51 to 100 and more than % respondents have 5 and less litres of weekly petrol consumption. 41.1% respondents have 6 to 15 litres of weekly petrol consumption. Inferences Maximum proportion of respondents has 5 and less litres of weekly petrol consumption. Minimum respondents are in the category of weekly fuel consumption between 41 to 100 litres of petrol. Table 2.3B Weekly fuel consumption: Diesel in litres Cumulative Frequency Percent Valid Percent Percent Valid Less than
112 More than Total Missing System Total Readings The data is divided in the following five categories: less than 5, 6 to15, 26 to 25, 26 to 40 and more than 100 litres of diesel consumption per week. 12.4% of respondents have weekly diesel consumption between 6 to 15 litres. 6.3% of respondents have weekly diesel consumption of 5 and less litres. There are 1099 respondents from which 225 have responded suitably and data of 874 respondents is incomplete. Inferences Diesel may not be as widely used Most respondents have weekly diesel consumption between 6 to 15 litres. Very less respondents have weekly diesel consumption of more than 26 litres. Table 2.3C Weekly fuel consumption: LPG in Kilograms 111
113 Cumulative Frequency Percent Valid Percent Percent Valid Missing System Total Readings 0.5% of respondents have weekly LPG consumption between 6 to 15 kilograms. There are 1099 respondents from which 6 have responded suitably and data of 1093 respondents is incomplete. Inferences LPG may not be widely used. Table 2.3D Weekly fuel consumption: CNG in Kilograms Cumulative Frequency Percent Valid Percent Percent Valid Less than More than
114 Total Missing System Total Readings Data is divided in the following six categories: less than 5, 6 to 15, 16 to 25, 26 to 40, 41 to 50 and more than 100 kilograms of weekly CNG consumption. 2.3% of the respondents have 6 to 15 kilograms of weekly CNG consumption. 1.2% of respondents have less than 5 kilograms of weekly CNG consumption. There are 1099 respondents from which 48 have responded suitably and data of 1051 respondents is incomplete. Inference Most of the respondents may not have CNG as their source of fuel. Table 2.3E Weekly fuel consumption: Electricity Number of recharges Cumulative Frequency Percent Valid Percent Percent Valid Less than Missing System Total Readings 0.1% respondents have less than 5 recharges. 113
115 There are 1099 respondents from which 1 has responded suitably and data of 1098 respondents is incomplete. Inferences The respondents may not have been able to quantify their usage of electricity in terms of number of recharges. Table 2.4A Monthly fuel Consumption: Petrol Value in Rupees Cumulative Frequency Percent Valid Percent Percent Valid Less than or more Total Missing System 8.7 Total Readings Data has been divided into the following five categories: less than 500, 501 to 1000, 1001 to 2500, 2501 to 5000 and more than 5000 rupees of monthly petrol consumption. 44.6% of respondents have monthly petrol consumption between 1001 to 2500 rupees. 114
116 26.8% of respondents have monthly petrol consumption between 500 to 1000 rupees. Inference Maximum consumption is between the ranges of 1001 to 2500 rupees of consumption of petrol. There are hardly any respondents that have monthly petrol consumption of more than 5000 rupees. Table 2.4B Monthly fuel Consumption: Diesel Value in Rupees Cumulative Frequency Percent Valid Percent Percent Valid Less than or more Total Missing System Total Readings Data is divided into the following five categories: less than 500, 500 to 1000, 1001 to 2500, 2501 to 5000 and more than 5000 rupees of monthly diesel consumption. 115
117 11.6% respondents have monthly diesel consumption between 1001 to 2500 rupees. 4.8%respondents have monthly diesel consumption between 2501 to 5000 rupees. There are 1099 respondents from which 230 have responded suitably and data of 869 respondents is incomplete. Inference Diesel may not be the most widely used fuel. There are maximum numbers of respondents having monthly diesel consumption between 1001 to 2500 rupees. Table 2.4C Monthly fuel Consumption: LPG Value in Rupees Cumulative Frequency Percent Valid Percent Percent Valid Less than Total Missing System Total Readings 116
118 Data is divided in the following three categories: less than 500, 1001 to 2500 and 2501 to 5000 rupees of monthly LPG consumption. 0.4% of respondents have monthly LPG consumption between 1001 to 2500 rupees. There are 1099 respondents from which 6 have responded suitably and data of 1093 respondents is incomplete. Inference LPG may be a comparatively less used source of fuel. Table 2.4D Monthly fuel Consumption: LPG Value in Rupees Cumulative Frequency Percent Valid Percent Percent Valid Less than Total Missing System Total Readings Data is divided in the following four categories: less than 500, 500 to 1000, 1001 to 2500 and 2500 to 5000 rupees of monthly LNG consumption. 117
119 2.0% of respondents have monthly LNG consumption between 1001 to 2500 rupees. There are 1099 respondents from which 44 have responded suitably and data of 1055 respondents is incomplete. Inferences LNG may not be widely used source of fuel. Maximum respondents have their monthly LNG consumption between 1001 to 2500 rupees. Table 2.4E Monthly fuel Consumption: Electricity Value in Rupees Cumulative Frequency Percent Valid Percent Percent Valid Less than Total Missing System Total Readings Data is divided in less than 500 and 500 to 1000 rupees of monthly electricity consumption. 0.1 % of respondents have monthly electricity consumption of less than 500 rupees. 118
120 0.1 % of respondents have monthly electricity consumption between 500 to 1000 rupees. There are 1099 respondents from which 2 have responded suitably and data of 1097 respondents is incomplete. Inference Respondents may not have monthly electricity consumption of more than 1000 rupees. 50% respondents have less than 500 rupees and 50% of respondents have between 500 to 1000 rupees of monthly electricity consumption. The consumption of respondents is moderate and not high. Table 2.5 Monthly fuel Consumption as proportion of Monthly household income Cumulative Frequency Percent Valid Percent Percent Valid 5% % % % Total Missing System 7.6 Total Readings 119
121 Data is divided in the following four categories: 5%, 10%, 15% and 20% of monthly fuel consumption as a proportion of monthly household income. 59.1% respondents have 5% monthly fuel consumption as proportion of monthly household income. 33.7% respondents have 10% monthly fuel consumption as proportion of monthly household income. Inference Fuel expenditure as a proportion of monthly household income may be comparatively low. Most of the respondents may have less than 5% of monthly fuel Consumption as proportion of Monthly household income. Table 2.6 Planning Monthly fuel Budget on Regular Basis Cumulative Frequency Percent Valid Percent Percent Valid Total Missing System Total Readings Data has been divided as those who plan and those who do not plan their monthly fuel consumption budgets. 120
122 90.3% of the respondents do not plan their monthly fuel consumption budget on a regular basis. 8.6% of the respondents do plan their fuel consumption budget. Inferences Most respondents do not plan fuel budget. Table 2.8 Periodic Servicing / Maintenance of Vehicle Cumulative Frequency Percent Valid Percent Percent Valid Yes No Total Missing System Total Readings 67.8% give their vehicles for periodic servicing and maintenance. 1.6% does not resort to periodic servicing and maintenance of vehicles. There are 1099 respondents from which 763 have responded suitably and data of 336 respondents is incomplete. Inference Most of those who have responded resort to regular maintenance of vehicles. Periodic servicing has high awareness amongst the population. 121
123 It may be that the cars which require more frequent servicing are widely used. Authorized manufacturer service is the most trusted agencies for car servicing. Table 2.9 Frequency of Car Servicing Cumulative Frequency Percent Valid Percent Percent Valid Once a month Once every three months Once every six months Once a year Total Missing System Total Readings Data is divided in the following four categories: once a month, once in three months, once in six months and once a year of frequency of car servicing. 44.9% respondents give their cars for servicing once in three months. 21.3% respondents give their cars for servicing once in six months. There are 1099 respondents from which 761 have responded suitably and data of 338 respondents is incomplete. Inference 122
124 The respondents may give their cars for servicing monthly or one in two months also. It may be that the cars which require more frequent servicing are widely used. Table 2.10 Agency of Car Servicing Cumulative Frequency Percent Valid Percent Percent Valid By my friend Authorized manufacturer service centre Local service center Total Missing System Total Readings There are three alternatives in which a respondent can give his preference of the agency for car servicing: by friend, authorized service centre and local service centre. 46.7% respondents prefer giving their cars for servicing to authorized service centres. There are 1099 respondents from which 755 have responded suitably and data of 344 respondents is incomplete. 123
125 Inference Authorized manufacturer service is the most trusted agencies for car servicing. Table 2.11 Average Annual Car maintenance cost, value in Rupees Cumulative Frequency Percent Valid Percent Percent Valid Less than 3, ,000-5, ,000-10, ,000-20, Total Missing System Total Readings Data is divided in the following four categories: less than 3000, 3000 to 5000, 5000 to and to rupees of average annual car maintenance cost. 32.1% respondents have average annual maintenance cost between 3000 to 5000 rupees. 31.8% respondents have average annual maintenance cost between 5000 to rupees. There are 1099 respondents from which 763 have responded suitably and data of 336 respondents is incomplete. 124
126 Inferences There may be a higher average annual cost of maintenance than rupees. Maximum respondents have their average annual cost of maintenance between 3000 and Over all conclusions on personal use motorized vehicle usage: From the above data readings and inferences it is concluded that most users of two wheelers make up to 30 to and from trips per week travelling between 100 tom 200 kilometres average running per week. Compared to that four wheeler users make 20 or less number trips per typical week and travel up to an average of 250 or less kilometres per week. Half of the sample travel up to 100 kilometres per week. Average monthly petrol consumption in volume comes to between 5 and 15 litres with more than 50 percent of respondents consuming less than 5 litres of petrol weekly. Sixty percent consumers of diesel use between 6 and 15 litres of diesel weekly with 91 percent making up consumers using up to 15 litres per week. Consumers of LPG consume between 6 to 15 kilograms of LPG per week while for CNG 80 percent consumers use up to 15 kilograms of CNG with 52 percent using between 6 and 15 kilograms of CNG, about 12 percent use more than 16 and less than 25 kilograms of CNG. Users of Electric vehicle use less than 5 recharges per week. Diesel comes out to be the preferred fuel for medium and heavy use travellers while petrol comes next. CNG is more used than LPG by four wheel vehicle users. Electric vehicle is the least preferred drive technology in four wheelers. Petrol consumption in value terms ranges between Rs and Rs , with almost 45 % people buying petrol worth Rs to Rs and about 26% in Rs to Rs range. A similar expenditure range is observed for users of diesel vehicles with a skewed figure on higher side with 55% people in the Rs to Rs range, and also a larger percentage in more than Rs In case of both LPG and CNG the largest number of people consume fuel worth Rs to Rs While in case of electric vehicle user the monthly expenditure is below Rs For all of 60 % of respondents average monthly spend on fuel is equal to or less than 5% of monthly household expenses. And for about 34 % it is below 10% of monthly household expenses. To the open ended question on method of budgeting the respondents who plan their monthly fuel consumption budget assign a monthly amount towards fuel expenses for the month. Towards maintenance, inspection and servicing of their vehicles on a regular basis, almost all respondents agree to have it done periodically. 60% of respondents have their vehicles serviced every three months and about 35% get it every six months. As many as 125
127 68% people give their cars for servicing at the authorised dealer while 30 % give their vehicles for service to some local service centre. More than 90% people spend between Rs to Rs 10, annually on regular maintenance and servicing of their vehicles. 2.4 Factors considered for purchase of a new car: It is very relevant and important to understand the vehicle users mind set in purchase of new vehicle for the household. This can be understood both on basis of historical data of what they have done in the past and in a futuristic perspective based on their future plans and expectations. To collect data on both perspectives questions were designed and incorporated in the questionnaire. The following section provides insights on factors that are considered and influence decision making in the purchase of a new car. Table 3.1: Plan to purchase new vehicle in near future Cumulative Frequency Percent Valid Percent Percent Valid Yes No Total Missing System Total Readings 98.9% of respondents answer this question. 58.9% of respondents are planning of purchasing a new vehicle in near future. 41.1% of the total respondents have no plan to purchase a new vehicle in near future. Inferences More than half of the respondents are planning to purchase a new vehicle. 126
128 So future fuel consumption will definitely increase in the country. Table 3.2: Primary reason for buying a new car Cumulative Frequency Percent Valid Percent Percent Valid Old car had low mileage High maintenance cost of the old car Old car had aged and had to be replaced Growing needs of the family To meet increasing commute needs For meeting various social needs Other reasons Total Missing System Total Readings Reasons are categorized into 7 categories like old car had low mileage, growing needs of the family, to meet increasing commute needs etc. 58.3% respondents answered this question. 127
129 44.3% of respondents who answered this question buy new car because of the growing needs of the family. 22.8% of the answered respondents buy new car to meet increasing commute needs. 19.5% of answered respondents buy new car for meeting various social needs. Inferences There are three main reasons because of which respondents buy new car, which are growing needs of the family, to meet increasing commute needs, & for meeting social needs. Mileage and maintenance cost is not a big concern for the respondents to buy a new car. Social needs are a significant concern for the respondents to buy a new car. Table 3.2.7: Other reasons for buying a new car Cumulative Frequency Percent Valid Percent Percent Valid FOR STATUS I like new diesel Model I like new latest Model so, I want to purchase a latest model likes new car model so
130 navu model levu che new car to buy luxuries car to puchase extra vehicle WANT SMALL VEHICLE WILL TAKE MORE VEHICLE Total Readings Other reasons to buy a new car includes for status, for new latest model, to buy luxuries model, & to purchase extra vehicle etc. In other reasons for buying a car, the respondents buying because of new diesel model are not a significant number. Inferences In other reasons, most of the respondents buy new car because they want to purchase a new car model. Fuel prices are not a major concern in buying a new car because they are not buying a diesel model instead of low diesel prices. Table 3.3: When replaced or added vehicles in the household bought same size / type of vehicle Cumulative Frequency Percent Valid Percent Percent 129
131 Valid Yes No Total Missing System Total Readings Question is to find the size and type of the new vehicle in comparison with their old vehicle. 98.1% of the respondents have answered for this question. 78.8% of the respondents buy different size and type of the vehicle in comparison to their old vehicle. Only 21.2% of the respondent will buy new vehicle of same type & size. Inferences Most of the respondents buy new type of vehicle when they replaced or added a new vehicle in their household. Table 3.4 A: Parameters considered while buying new vehicle - Price Cumulative Frequency Percent Valid Percent Percent Valid Very Less Importance Less Importance Average
132 High Importance Very High importance Total Missing System 2.2 Total Readings Question is to find the importance of price in making decision of buying a new car. Price sensitivity is categorized into a scale of 5 categories from very less importance to very high importance. For the 75% of the respondents price is of very high importance in making a decision to buy a new car. For very few (only 2%) respondents the price is not an issue in buying a new car. Inferences Since most of our respondents are of middle income group so the price is a major factor in the decision of buying a new vehicle. For 98% of the respondents the price of the vehicle is at high importance or very high importance in the decision of buying a new vehicle. Table 3.4 B: Parameters considered while buying new vehicle Maintenance Cost Cumulative Frequency Percent Valid Percent Percent 131
133 Valid Very Less Importance Less Importance Average High Importance Very High importance Total Readings Importance of maintenance cost in making decision of buying a new car is categorized into 5 categories from very less importance, less importance, average, high importance & very high importance. For 60.4% of the respondents maintenance cost is of high importance. For the 30% of the respondents maintenance cost is of very high importance. Inferences Maintenance cost is an important parameter for the decision of buying a new car. For more than 90% of the respondents it is of high importance or very high importance. For very few (only.9%) respondents maintenance cost is of no importance. Table 3.4 C: Parameters considered while buying new vehicle Running Cost Cumulative Frequency Percent Valid Percent Percent Valid Very Less Importance
134 Less Importance Average High Importance Very High importance Total Missing System 1.1 Total Readings Importance of running cost in making decision of buying a new car is categorized into 5 categories from very less importance, less importance, average, high importance & very high importance. For 35.5% of the respondents running cost is of high importance. For 31.5% the running cost is at average level of importance. 22.5% of the respondents consider running cost of very high importance. Inferences Respondents consider parameter of running cost as not of that high importance in comparison to price and maintenance cost. Only 58% consider running cost as a parameter of high importance and very high importance. A significant number of respondents (10.4%) also consider running cost as very less important and less important parameter while buying a new vehicle. Table 3.4 D: Parameters considered while buying new vehicle - Design 133
135 Cumulative Frequency Percent Valid Percent Percent Valid Very Less Importance Less Importance Average High Importance Very High importance Total Missing System 1.1 Total Readings Design parameter is also categorized into 5 categories from very less importance, less importance, average, high importance & very high importance. 38.1% consider design as a high importance factor and 22.4% consider it as very high important factor while buying new vehicle. 24% respondents consider design parameter at average level while making decision of buying a new vehicle. 15.5% respondents take design parameter as not very important while buying a new vehicle. Inferences 60.5% of the total respondents consider design as an important factor while buying new vehicle. 134
136 Design parameter is quite spread from less importance to very high importance so a significant respondent(12.1%) consider it as less importance and also 22.4% respondents consider it as very high importance. Table 3.4 E: Parameters considered while buying new vehicle Engine Power Cumulative Frequency Percent Valid Percent Percent Valid Very Less Importance Less Importance Average High Importance Very High importance Total Readings The parameter engine power is categorized into 5 categories from very less importance, less importance, average, high importance & very high importance. 43.2% of respondents consider engine power as a very high important factor while buying a new vehicle. Percentages of respondents consider it as high important and averages are 35.5% and 17.5%. Only 3.8% of the respondents consider engine power of very less importance and less importance while buying new vehicle. Inferences 135
137 For 78.7% of the respondent engine power is of high importance or very high importance. Engine power factor is of approximately equally important in comparison to other important factor like price, fuel/engine type, maintenance cost etc. Table 3.4 F: Parameters considered while buying new vehicle Fuel / Engine Type Cumulative Frequency Percent Valid Percent Percent Valid Very Less Importance Less Importance Average High Importance Very High importance Total Readings The parameter fuel/engine type is categorized into 5 categories from very less importance, less importance, average, high importance & very high importance. 51.1% of respondents consider fuel type as a very high important factor while buying new vehicle. 33.7% of respondents consider it as a high important factor in making buying decision of new vehicle. Inferences 136
138 Only 2.8% of respondents consider it as not very important factor while buying a new vehicle. So the fuel efficiency and fuel prices may important a major role in the decision of new vehicle purchase. Very high 84.8% of the respondents place it at high importance level or very high importance level. Table 3.4 G: Parameters considered while buying new vehicle Vehicle Sturdiness Cumulative Frequency Percent Valid Percent Percent Valid Very Less Importance Less Importance Average High Importance Very High importance Total Missing System 2.2 Total Readings The parameter vehicle sturdiness is categorized into 5 categories from very less importance, less importance, average, high importance & very high importance. 137
139 62.5% of respondents consider it as a very high important factor while buying a new vehicle. Only 19.4% of respondents consider it as a high importance factor while buying a new vehicle. Percentage of less importance and average for the vehicle sturdiness are 5.7% and 12.3% respectively. Inferences Those who emphasis vehicle sturdiness parameter majority of those considers it as a very high importance factor while buying a new vehicle. 81.9% of the respondents consider it as an important factor. Table 3.4 H: Parameters considered while buying new vehicle Manufacturer / Brand Cumulative Frequency Percent Valid Percent Percent Valid Very Less Importance Less Importance Average High Importance Very High importance Total Missing System 2.2 Total Readings 138
140 The parameter manufacturing/brand is categorized into 5 categories from very less importance, less importance, average, high importance & very high importance. 51.9% of respondents consider it as a very high important factor while buying a new vehicle. Only 1.8% of respondents consider brand parameter less or very less important factors. Inferences 88.2% of respondents consider it as an important factor while buying a new vehicle. Brand is a very important factor while purchasing a new vehicle which is also reflecting through research, that only 1.8% of the respondent considers it as not an important factor. Table 3.4 I: Parameters considered while buying new vehicle Vehicle Weight Cumulative Frequency Percent Valid Percent Percent Valid Very Less Importance Less Importance Average High Importance Very High importance Total
141 Missing System 2.2 Total Readings The parameter vehicle weight is categorized into 5 categories from very less importance, less importance, average, high importance & very high importance. 34.1% of respondents consider it at average level and 26% place it at high importance level. Only 12.9% place it at very high importance level. For 27% of respondent it is of no importance the weight of the vehicle. Inferences Respondents consider vehicle weight as not that high importance level in comparison to other parameters. 34.1% of respondents place vehicle weight parameter at average level and also 27% consider it as less important factor while buying new vehicle. Table 3.4 J: Parameters considered while buying new vehicle - Occupancy Cumulative Frequency Percent Valid Percent Percent Valid Very Less Importance Less Importance Average High Importance Very High importance
142 Total Missing System 2.2 Total Readings The parameter occupancy is also categorized into 5 categories from very less importance, less importance, average, high importance & very high importance. 72.3% of respondents consider occupancy parameter as a high or very high important factor while buying a new vehicle. Only 6.8% of respondents consider it occupancy parameter as less importance or very less importance factors. 20.9% of respondents place occupancy factor at average level. Inferences Since we have a good number of respondents belong to joint families, so occupancy parameter also play an important role while buying a new vehicle. A significant number of respondents (20.9%) are neutral for this parameter. Table 3.4 K: Parameters considered while buying new vehicle Manufacturer s Claims on Fuel Efficiency Cumulative Frequency Percent Valid Percent Percent Valid Very Less Importance Less Importance Average
143 High Importance Very High importance Total Missing System 2.2 Total Readings The parameter fuel efficiency is also categorized into 5 categories from very less importance, less importance, average, high importance & very high importance. Respondents with high importance, average and very high importance are 30.2%, 24.8% and 22.2% respectively. A significant 22.8% of respondents consider it as less important or very less important factor while buying a new vehicle. Inferences Fuel efficiency is not the parameter which is very highly important for our respondents in comparison to other parameters like price, maintenance cost etc. It is the research result that respondents consider fuel type as more important than fuel efficiency. 52.2% of respondents consider it as a high important or very high important. Table 3.4 L: Parameters considered while buying new vehicle On Road fuel efficiency 142
144 Cumulative Frequency Percent Valid Percent Percent Valid Very Less Importance Less Importance Average High Importance Very High importance Total Readings The parameter on road fuel efficiency is also categorized into 5 categories from very less importance, less importance, average, high importance & very high importance. 75% of respondents consider on road fuel efficiency as of high importance and very high importance. Only 6.5% of respondents place it as a less important factor while buying a new vehicle. Inferences Majority of the respondents consider on road fuel efficiency as an important parameter. So it may be possible that due to impact of this factor the sale of new vehicle increases during high fuel prices. 18.6% of respondents place it as an average level while decision of buying a new vehicle. 143
145 Table 3.4 M: Parameters considered while buying new vehicle Other Customer s Opinions Cumulative Frequency Percent Valid Percent Percent Valid Very Less Importance Less Importance Average High Importance Very High importance Total Missing System 1.1 Total Readings 33.1% of respondents consider other customer s opinions as a high importance parameter while 30.4% consider it as average parameter while buying a new vehicle. For 22.1% of respondents other customer s opinions are not important parameter while making buying decision of new vehicle. Only 14.4% of respondents feel that other customer s opinion is of very high importance. Inferences 144
146 For almost half of the respondents other customer s opinion is of high importance or very high importance. The other customer s opinion also plays a crucial role while buying a new vehicle. Table 3.4 N: Parameters considered while buying new vehicle Automobile experts views in Media Cumulative Frequency Percent Valid Percent Percent Valid Very Less Importance Less Importance Average High Importance Very High importance Total Missing System 1.1 Total Readings The question is to find the importance of automobile expert views of media in making decision of buying a new vehicle. For 38.3% of respondents automobile expert views is less important or very less important. 145
147 For 38.5% of respondents automobile expert views is of high importance or very high importance. 23.2% of respondents consider parameter of automobile experts views in media at an average level. Inferences Not very high percentages of the respondents consider automobile experts views in media as an important factor in deciding a new vehicle purchase. Maximum respondents are from urban area which has a sufficient reach of media than also respondents consider it not as a very prominent factor while buying a new vehicle. Table 3.4 O: Parameters considered while buying new vehicle My known Mechanics Opinion Cumulative Frequency Percent Valid Percent Percent Valid Very Less Importance Less Importance Average High Importance Very High importance Total Missing System 2.2 Total
148 Readings Question is to find the importance of their own knowledge of automobiles while decision of buying a new vehicle. More than half of the respondents (54.5%) consider their own view as high important and very high important parameter. For 21.3% of the respondents their own mechanics opinion is less important or very less important factor. 24.2% of respondents consider it at an average level while buying a new vehicle. Inferences Almost half of the respondents (54.5%) consider it as an important factor and so also almost half of the respondents do not consider it as a very important factor. Since most of our respondents are from urban area and so almost more than half of the respondents have some level of knowledge of mechanics and automobiles. Table 3.4 P: Parameters considered while buying new vehicle Special deals / offers Cumulative Frequency Percent Valid Percent Percent Valid Very Less Importance Less Importance Average High Importance Very High importance
149 Total Missing System 1.1 Total Readings Question is to find the effect of special deals and offers in purchase of new vehicle. For 59.8% of the respondents, the special deals and offers will be able to attract them for buying a new vehicle. 20.6% respondents consider this parameter as less important and very less important while buying a new vehicle. For 19.6% of respondents special offers is at average level while making a buying decision. Inferences Almost 60% of the respondents are attracted by the special deals and offers while buying a new vehicle. We can infer from this that the new vehicle buying decision may also be the momentary decision. For 20.6% of the respondents special deals are not only enough for deciding of buying a new vehicle. Table 3.4 Q: Parameters considered while buying new vehicle Track Record Cumulative Frequency Percent Valid Percent Percent Valid Very Less Importance
150 Less Importance Average High Importance Very High importance Total Missing System 3.3 Total Readings The question is checking the importance of the track record while buying a new vehicle. 23.6% of respondents consider it as very less important and less important parameter while buying a new vehicle. For 51.9% of respondents the parameter of track record is at high importance and very high importance level. The percentage of the respondents who considers track record at average level is 24.5%. Inferences Track record plays an important role while taking buying decision of new vehicle. More than half of respondents consider it as a high important factor while buying a new vehicle. For a significant number of respondents (23.6%) track record is not very important parameter while deciding. 149
151 Table 3.5: Price Range for buying a new Car Cumulative Frequency Percent Valid Percent Percent Valid Less than 3 lakhs to 6 lakhs to 10 lakhs to 15 lakhs More than 15 lakhs Total Missing System Total Readings Price range of new car to be bought by the respondents is categorized into 5 categories from less than Rs 3 lakhs, Rs 3-6 lakhs, Rs 6-10 lakhs, Rs lakhs, and more than Rs 15 lakhs. 51.6% of respondents are willing to buy a new car of price range Rs 3-6 lakhs. 28.6% of respondents are willing to buy a new car of price range of Rs 6-10 lakhs. Only 15.5% of respondents are willing to buy a new car which costs less than Rs 3 lakhs. Inferences 150
152 Since our most of the respondents are from middle income group and which is also reflecting in this research question that 67.1% of the respondents will buy new car of price less than Rs 6 lakhs. Only 4.2% of respondents will buy their new car of price more than Rs 10 lakhs. Instead of launching TATA nano (a Rs 1 lakh car) only 15.5% of the respondents are willing to buy a new car of price less than Rs 3 lakh Over all conclusions on factors considered for purchase of a new car: About 60 % people are looking at buying a new car in the near future and mostly due to increasing needs of the family and commuting needs. Meeting social needs also feature as the third most important reason for purchase of new car. When a new car was bought for the family/household more than 70 % people bought a different size and type of vehicle either as a replacement or an addition to existing car. Amongst the parameters considered while buying a new car Price of Vehicle is the most important parameter, followed by Fuel/Engine type and Vehicle Sturdiness, which is followed by Engine Power and on road fuel efficiency. Maintenance cost is also a very important parameter while considering a new purchase along with manufacturer name/brand. Automobile experts views in media is the least important factor considered while purchasing a new car and other customers opinion and known mechanic s opinion are found to be more important than that of experts. Design, Running cost, Occupancy and Special deals and offers though not very important are definitely more so than the opinions of others. Manufacturers claims on fuel efficiency, Track record are also not considered as very important, similar to vehicle weight. Considering the price range for a new car most people, 50% of respondents, are willing to spend between Rs 300,000 and Rs 600,000. With 28.6 % people willing to spend Rs 600, to Rs 1,000, we can conclude that people would be willing to buy more expensive car provided it offers some of the characteristics considered important by them. Others would prefer cars priced below Rs 300, Response to fuel price changes and fuel option choices: One of the most important insights sought is the response of people to fuel price changes and their choices for alternate fuel options under various fuels price increases in comparison to other fuel options. Starting with the choice of fuel when planning to purchase a new vehicle, respondents are questioned about their choices, given different price relations of the different fuel choices available in the market. The following sections offer deep 151
153 insights about the choices respondents would make under different circumstances of prices of the different fuels. Table 4.0: Fuel choice for new Car purchase Cumulative Frequency Percent Valid Percent Percent Valid If planning to purchase a petrol, then go to Q. no. 4.1 If planning to purchase a diesel, then go to Q no. 4.2 If planning to purchase a CNG, then go to Q. no. 4.3 Total Missing System Total Readings Data is divided into following three categories: Those planning to purchase petrol, those planning to purchase diesel and those planning to purchase CNG. 22.9% respondents are planning to purchase diesel vehicle. 19.3% respondents are planning to purchase petrol vehicle. 18.3% respondents are planning to purchase CNG vehicle. Inferences Diesel is the most sought-after fuel source in vehicles. Diesel may be comparatively easily available. Diesel may be cheaper source of fuel. 152
154 There are many questionnaires (39.5%) which are not attended to. There may exist a different source of fuel. Table 4.1.A.0: Fuel choice if Petrol price 25% higher than Diesel prices Cumulative Frequency Percent Valid Percent Percent Valid Will surely choose a petrol car Might consider the petrol car Re-consider buying some other fuel car Will surely choose some other fuel car Total Missing System Total Readings 57.6% of respondents will surely choose petrol car. 28.1% of respondents might consider petrol car. 6.2% respondents might reconsider buying some other fuel car. 8.1% respondents will surely choose some other fuel car. There are 1099 respondents from which 210 have responded suitably and data of 889 respondents is incomplete. 153
155 Inferences Petrol may not be the most sought after fuel for vehicular consumption. There are quite a few vehicles running on petrol. A lot of questionnaires are not responded to. A lot of respondents may not be using petrol as a fuel. Table 4.1.A.1: Alternative fuel choice with Petrol price 25% higher than Diesel prices Cumulative Frequency Percent Valid Percent Percent Valid Diesel CNG LPG Electric Total Missing System Total Readings 50.5% respondents have chosen CNG. 28.0% respondents have chosen LPG. 19.4% respondents have chosen diesel. Inferences Electricity as a source of fuel is the least sought after. 154
156 CNG may have good efficiency as compared to other sources. CNG may be a cheaper option. Table 4.1.B.0: Fuel choice if Petrol price 35% higher than Diesel prices Cumulative Frequency Percent Valid Percent Percent Valid Will surely choose a petrol car Might reconsider the petrol car Re-consider buying some other fuel car Will surely choose some other fuel car Total Missing System Total Readings 52.2% of respondents might consider petrol car. 19.9% respondents would reconsider buying some other fuel car. 19.1% respondents will surely choose some other fuel car. Inferences With higher disparity between petrol and diesel prices, the preference for petrol is drastically decreasing. 155
157 Table 4.1.B.3: Alternative fuel choice with Petrol price 35% higher than Diesel prices Cumulative Frequency Percent Valid Percent Percent Valid Diesel CNG LPG Electric Total Missing System Total Readings 69.4% respondents choose CNG 14.0% respondents choose LPG. 11.6% respondents choose diesel. Inferences CNG is the next best alternative to petrol for the respondents. LPG is widely used as a source of vehicular fuel. Table 4.1.C.0: Fuel choice if Petrol price 50% higher than Diesel prices Cumulative Frequency Percent Valid Percent Percent 156
158 Valid Will still surely choose a petrol car Might reconsider the petrol car Re-consider buying some other fuel car Will surely choose some other fuel car Total Missing System Total Readings 42.3% respondents will surely choose some other fuel car. 26.9% respondents will surely choose petrol car. 19.2% respondents will reconsider buying some other fuel car. Inferences There may be good affinity towards petrol as a fuel source. Diesel may not be as cost effective, comparatively. 50% higher price of petrol than diesel has significant impact on the preferences of consumers. Table 4.1.C.5: alternative fuel choice when Petrol prices 50% higher than Diesel price 157
159 Cumulative Frequency Percent Valid Percent Percent Valid Diesel CNG LPG Electric Total Missing System Total Readings 61.9% respondents will choose diesel. 19.0% respondents will choose CNG There are 1099 respondents from which 21 have responded suitably and data of 1078 respondents is incomplete. Inference There is equal preference LPG and electricity. Diesel may be comparatively cheaper. Diesel may be comparatively easily available. There may be less awareness about the uses of other sources of fuel. Table : Fuel choice if Diesel prices become equal to Petrol prices 158
160 Cumulative Frequency Percent Valid Percent Percent Valid Will still surely choose a diesel car Might reconsider the diesel car Might reconsider buying some other fuel car Will surely choose some other fuel car Total Missing System Total Readings 53.8% respondents will surely choose a diesel car. 22.7% respondents might consider the diesel car. 16.5% respondents might consider some other fuel car. Inference Equaling of prices of petrol and diesel has significant impact on the preferences of respondents. Diesel seems to be the most preferred source amongst fuels other than petrol. The comparative cost of equivalent petrol does not have significant impact on the preferences of the respondents. 159
161 Table : Alternative fuel choice when Diesel prices become equal to Petrol prices Cumulative Frequency Percent Valid Percent Percent Valid Petrol CNG LPG Electric Total Missing System Total Readings 66.2% respondents will choose CNG. 16.9% respondents will choose LPG. 16.2% respondents will choose petrol. There are 1099 respondents from which 130 have responded suitably and data of 969 respondents is incomplete. Inference Apart from diesel, CNG is the most preferred fuel. CNG may be comparatively cheaper fuel. CNG may be easily available. Electric cars may be rare. 160
162 Table : Fuel choice if Diesel prices become 20% higher than Petrol prices Cumulative Frequency Percent Valid Percent Percent Valid Will still surely choose a diesel car Might reconsider the diesel car Might consider buying some other fuel car Will surely choose some other fuel car Total Missing System Total Readings 43.3% respondents might consider diesel car. 21.3% respondents will surely choose some other fuel car. 20.1% respondents might consider buying some other fuel car. There are 1099 respondents from which 164 have responded suitably and data of 935 respondents is incomplete. Inferences Increase in diesel prices has significant impact on preferences. Most respondents will stop using diesel cars after the increase. 161
163 Table : Alternative fuel choice when Diesel prices become 20% higher than Petrol prices Cumulative Frequency Percent Valid Percent Percent Valid Petrol CNG LPG Electric Total Missing System Total Readings 63.5% respondents will choose CNG. 19.8% respondents will choose Petrol. 15.9% respondents will choose LPG. There are 1099 respondents from which 126 have responded suitably and data of 973 respondents is incomplete. Inferences CNG is the nest best option for respondents after diesel. CNG may be comparatively cheaper fuel. CNG may be easily available. Electricity as a source of fuel is a rarity. 162
164 Table : Fuel choice if Diesel prices become 50% higher than Petrol prices Cumulative Frequency Percent Valid Percent Percent Valid Will still surely choose a diesel car Might reconsider the diesel car Might consider buying some other fuel car Will surely choose some other fuel car Total Missing System Total Readings 41.8% respondents will surely choose some other fuel car. 30.9% respondents might reconsider diesel car. 16.4% respondents might consider buying some other fuel car. Inference There would be rarely being any diesel car users after the increase. As the prices disparity increases, the respondents switching to other fuels also increases. 163
165 Table : Alternative fuel choice when Diesel prices become 50% higher than Petrol prices Cumulative Frequency Percent Valid Percent Percent Valid Petro CNG LPG Electric Total Missing System Total Readings 52.1% respondents will choose CNG. 41.7% respondents will choose petrol. There are 1099 respondents from which 48 have responded suitably and data of 1051 respondents is incomplete. Inference Electric cars may have increase in preference. CNG is the most preferred fuel after diesel. CNG may be price efficient comparatively. Awareness about CNG as a potential fuel may be high. Awareness about electricity as a potential fuel may be low. 164
166 Table : Purchase of CNG variant with CNG Car price and CNG fuel price same; with adequate CNG fuel supply Cumulative Frequency Percent Valid Percent Percent Valid Yes No Total Missing System Total Readings 57.7% would go with the purchase. 42.3% would not purchase. There are 1099 respondents from which 26 have responded suitably and data of 1073 respondents is incomplete. Inference Majority population would switch to CNG car. There may be a need to create more awareness about CNG as a potential fuel, looking at the number of questionnaires not responded to. Table E: Reasons for not purchasing CNG variants Cumulative Frequency Percent Valid Percent Percent 165
167 Valid Diesel is a better car, cost wise DON T LIKE I don't like I don't like diesel car it affect the pickup and service MORE PROB IN CNG No SHORT CIRCUIT Y Total Reading 0.4% of respondents do not like diesel cars. 0.1% respondents think diesel car is better. 0.3% respondents have safety and other issues concerning the functioning of the car. Inferences There may be a lot of problems experienced using a CNG car. Safety issues must be taken care of for CNG cars. 166
168 More awareness regarding CNG being environmentally friendly source of fuel need to be created. Table : Fuel choice if CNG prices become equal to Diesel prices Cumulative Frequency Percent Valid Percent Percent Valid Will still surely choose a CNG car Might reconsider the CNG car Might consider buying some other fuel car Will surely choose some other fuel car Total Missing System Total Readings 47.2% respondents will surely choose a CNG car. 21.8% respondents might reconsider a CNG car. 17.8% respondents will surely choose some other fuel car. Inferences 167
169 Equaling of prices between CNG and diesel has good amount of positive impact on preferences. There are other options as well apart from CNG. Table : Alternative fuel choice when CNG prices become equal to Diesel prices Cumulative Frequency Percent Valid Percent Percent Valid Petrol Diesel LPG Electric Total Missing System Total Readings 71.6% respondents will choose diesel. 23.9% respondents will choose LPG. There are 1099 respondents from which 109 have responded suitably and data of 990 respondents is incomplete. Inferences Electric cars may be more preferred than petrol cars in this case. Diesel may be the next best source after CNG. 168
170 Diesel may have good price efficiency comparatively. Table : Fuel choice if CNG prices become equal to Petrol prices Cumulative Frequency Percent Valid Percent Percent Valid Will still surely choose a CNG car Might reconsider the CNG car Might reconsider buying some other fuel car Will surely choose some other fuel car Total Missing System Total Readings 38.6% respondents will surely choose a CNG car. 24.8% respondents might reconsider the CNG car. 27.7% respondents might reconsider buying some other fuel car. There are 1099 respondents from which 101 have responded suitably and data of 998 respondents is incomplete. Inference 169
171 Most people would switch for a diesel car. Diesel may have cost efficiency as compared to other fuel sources. Table : Alternative fuel choice when CNG prices become equal to Petrol prices Cumulative Frequency Percent Valid Percent Percent Valid Petrol Diesel LPG Electric Total Missing System Total Readings 73.7% respondents would choose diesel. 12.3% respondents would choose electric. 8.8% respondents would choose LPG. There are 1099 respondents from which 57 have responded suitably and data of 1042 respondents is incomplete. Inference There may be other alternatives apart from what are mentioned in the options. Electricity as a potential source of fuel may be promoted more. 170
172 Diesel may be more cost effective as compared to other sources Table : Fuel choice if CNG prices become 25% higher than Petrol prices Cumulative Frequency Percent Valid Percent Percent Valid Will still surely choose a CNG car Might reconsider the CNG car Might consider buying some other fuel car Will surely choose some other fuel car Total Missing System Total Readings 33.0% respondents might reconsider the CNG car. 29.8% respondents will surely switch to some other fuel car. There are 1099 respondents from which 92 have responded suitably and data of 1005 respondents is incomplete. 171
173 Inference Price of CNG increasing more than petrol has significant impact on the preferences of consumers. Most of the population will switch to other fuels. Table : Alternative fuel choice when CNG prices 25% higher than Petrol prices Cumulative Frequency Percent Valid Percent Percent Valid Petrol Diesel LPG Electric Total Missing System Total Readings 65.9% respondents will choose diesel. 22.0% respondents will choose LPG. There are 1099 respondents from which 82 have responded suitably and data of 1017 respondents is incomplete. Inference People may also have other sources than what are mentioned in the options. 172
174 Diesel may be highly cost effective and available in the market. Electricity as a potential source of fuel may need to be promoted further. Table 4.4.0: Purchase of Electric variant with Electric Car prices same; with adequate public charging facilities Cumulative Frequency Percent Valid Percent Percent Valid Yes No Total Missing System Total Readings Question is to find the responses of the respondents that whether they will purchase electric vehicle or not if they find a suitable price and charging facilities. 86.5% of respondents will buy a new electric car. 13.5% of respondents are not interested in buying a new electric car. Inferences The most of the respondents are willing to buy a new electric vehicle but due to lack of charging facility and high cost they are not buying electric car. 173
175 Electric car producers have a huge market in the country if they provide it at competitive cost and with suitable charging facility. Table 4.4.1: Reasons for not purchasing Electric variant Cars Cumulative Frequency Percent Valid Percent Percent Valid Bettary Charging during journey bettry problem in rainfall season charging problem CHARGING VEHICLES NOT FAVOURABLE CNG is avaiable at cheap rate Doesn't know information about its performance don't like low pick DON T KNOW Don t like electric so
176 Don t like electric vehicle-reason is pick up problem DUE TO BATTERY MAITINENECE DUE TO LOW PICK UP DUE TO LOW SPEED Efficiency Maintenance information is not available Electric car gives less pick up HIGH MAINTENANCE I didn t like I DON T LIKE I DON T LIKE ELECTRIC CAR I DON T LIKE TO KEEP IT ON CHARGE idont know much about efficiency and managment of battery LESS KNOWLEDGE OF E-CARS 175
177 LESS LIFE Less pickup/ Not comfert in driving less speed on highway...carrying capacity is also less Maintenance might be costly MANY PROB LIKE SORT CIRCUIT MECHANIC IS NOT EASILY AVAIL No experience NO IDEA NO KNOWLEDGE ABOUT ELEC CAR NO LONG LIFE NO SO MUCH LIFE OF ELEC CAR NOT BELIEVE ON ELEC CAR NOT EXPERIENCE
178 not having info for electric car not information regarding effeciency and maintenance not information regarding electric car NOT PROVIDED JBL SYSTEM The mechanics are not avaible when electric car breaks down think after improving financial condition We do not have enough information on the same. It is not avaiable in the market. We donot like such cars WILL THINK AFTER LAUNCH y Total Readings Only 61 out of 1099(5.5%) respondents have answered for this question. 177
179 The most of the respondents (15/61) reported that they will not buy because they do not have proper information regarding electric cars. 12out of 61 respondents will not buy because of low pick up of electric cars. 13 respondents will not buy electric cars because they do not like it. Total 12 respondents will not buy electric cars because of issues related to battery, charging and maintenance. Inferences The biggest reason which comes out of the research is not the price of the electric cars but the lack of information for which respondents will not purchase a new electric car. Since many respondents have no information about the electric cars so also many do not like it. Low strength of the vehicle is also a big reason for not buying an electric car. Low pick is another major reason for not buying electric car. Maintenance and battery charging is also concern in buying decision of new electric car. Table : Compared to Petrol/Diesel cars, CNG car use increases transport economy Cumulative Frequency Percent Valid Percent Percent Valid Yes No
180 Total Missing System 2.2 Total Readings In 76.1% of the respondents view CNG car use increases transport economy. For 23.9% of the respondents CNG car use do not increase transport economy. Inferences Most of the respondents believe that if they use CNG car then they are using resources efficiently. Table : Compared to Petrol/Diesel cars, CNG car use improves Vehicle lift Cumulative Frequency Percent Valid Percent Percent Valid Yes No Total Missing System 1.1 Total Readings 53.3% of the respondents believe that use of CNG as a fuel rather than petrol or diesel will decrease their vehicle lift. 179
181 46.7% of the respondents believe that use of CNG will increase their vehicle lift. Inferences The respondents are almost equally divided in the belief that whether use of CNG as a fuel in their vehicle will increase or decrease the power of their vehicle. Table : Compared to Petrol/Diesel cars, CNG car use reduces Air pollution Cumulative Frequency Percent Valid Percent Percent Valid Yes No Total Missing System Total Readings 70.6% of the respondents believe that use of CNG will reduces air pollution. 29.4% of the respondents believe that use of CNG in vehicle will not reduce air pollution. Inferences According to most of the respondents use of CNG will reduce air pollution, so the respondents who are concerned about environment and global warming will prefer CNG as a fuel. 180
182 Table : Compared to Petrol/Diesel cars, CNG car use reduces noise Cumulative Frequency Percent Valid Percent Percent Valid Yes No Total Missing System 2.2 Total Readings For the 72% of the respondents CNG will reduce noise. And for 28% of the respondent s use of CNG as a fuel will not reduce noise. Inferences Most of the respondents believe that use of CNG will reduce noise pollution, so the respondents who are concerned about environment will prefer CNG as a fuel. Table : Compared to Petrol/Diesel cars, CNG car use reduces space in vehicle Cumulative Frequency Percent Valid Percent Percent Valid Yes No Total
183 Missing System 3.3 Total Readings 58.9% of the respondents have belief that CNG cars have less space in vehicle. For 41.1% of the respondents use of CNG will not reduces the space in vehicle. Inferences Many of the respondents believe that use of CNG will reduce space in vehicle, so space may be an unfavorable parameter while choosing CNG as a fuel in comparison to petrol/diesel. Table : Compared to Petrol/Diesel cars, CNG car use increases carrying capacity Cumulative Frequency Percent Valid Percent Percent Valid Yes No Total Missing System 4.4 Total Readings For 52.9% of the respondents, the CNG car use increases carrying capacity. 47.1% of the respondents believe that CNG car use will not increase the carrying capacity. 182
184 Inferences It is a general belief that use of CNG will decrease carrying capacity because of the CNG kit to be placed, but here according to more than half of the respondents, use of CNG will increase their carrying capacity. Table : Compared to Petrol/Diesel cars, CNG car use increases pick-up Cumulative Frequency Percent Valid Percent Percent Valid Yes No Total Missing System 2.2 Total Readings 54.3% of the respondents believe that CNG car has more pick-up than petrol or diesel car. 45.7% of the respondents are not in favor that CNG car use increases pick-up. Inferences Contradicting the general belief more than half of the respondents believe that use of CNG car will increase pick-up. Table : Compared to Petrol/Diesel cars, CNG car use makes road transport very expensive 183
185 Cumulative Frequency Percent Valid Percent Percent Valid Yes No Total Missing System 5.5 Total Readings For 68.6% of the respondents CNG cars are less expensive than petrol or diesel cars. 31.4% of the respondents believe that use of CNG actually increases their transport expense. Inferences Most of the respondents consider CNG as a less expensive fuel in comparison to petrol and diesel. Table : Compared to Petrol/Diesel cars, LPG car use increases transport economy Cumulative Frequency Percent Valid Percent Percent Valid Yes No Total
186 Missing System 6.5 Total Readings 53.6% of the respondents believe that use of LPG will increase transport economy. 46.1% of the respondents believe that use of LPG will not increase transport economy. Inferences The respondents are equally divided for the view that use LPG will increase or decrease transport economy. Table : Compared to Petrol / Diesel cars, LPG car use improves Vehicle lift Cumulative Frequency Percent Valid Percent Percent Valid Yes No Total Missing System 3.3 Total Readings 59.1% of the respondents believe that use of LPG will improve vehicle lift and the rest are of opposite view. 185
187 Inferences Many respondents have belief that use of LPG will not improve their vehicle lift. Table : Compared to Petrol/Diesel cars, LPG car use reduces Air pollution Cumulative Frequency Percent Valid Percent Percent Valid Yes No Total Missing System 5.5 Total Readings Half of the respondents are in favour that use of LPG will reduce air pollution and so other half are of opposite view. Inferences More respondents believe that CNG reduces air pollution than those who believe that LPG reduces air pollution. Table : Compared to Petrol/Diesel cars, LPG car use reduces noise Cumulative Frequency Percent Valid Percent Percent Valid Yes
188 No Total Missing System 4.4 Total Readings 57.2% of the respondents believe that use of LPG will reduces noise. 42.8% of the respondents believe that use of LPG will not reduce noise. Inferences Many respondents believe that use of LPG will reduces noise in comparison to petrol and diesel as a fuel. Table : Compared to Petrol/Diesel cars, LPG car use reduces space in vehicle Cumulative Frequency Percent Valid Percent Percent Valid Yes No Total Missing System 6.5 Total Readings 59.9% of respondents are of view that use of LPG will actually reduce space in vehicle while rests are of opposite view. 187
189 Inferences The percentage of the respondents of those who favors that use of LPG will reduce vehicle space is almost same as that of those who believe that use of CNG will reduce space. So respondents weigh equally to LPG & CNG for the vehicle space parameter. Table : Compared to Petrol/Diesel cars, LPG car use increases carrying capacity Cumulative Frequency Percent Valid Percent Percent Valid Yes No Total Missing System 3.3 Total Readings 48.4% of the respondents believe that use of LPG will increase carrying capacity and so rests are of opposite view. Inferences More number of respondents believes that use of LPG will not increase carrying capacity. Table : Compared to Petrol/Diesel cars, LPG car use increases pick-up 188
190 Cumulative Frequency Percent Valid Percent Percent Valid Yes No Total Missing System 9.8 Total Readings 55.8% of the respondents believe that use of LPG car will increase pick-up of their vehicle. 44.2% of the respondents do not believe that use of LPG will increase pick-up. Inferences For the parameter pick-up respondents weigh equally to LPG and CNG. More than half of the respondents believe that use of LPG will actually increase pick-up. Table : Compared to Petrol/Diesel cars, LPG car use makes road transport very expensive Cumulative Frequency Percent Valid Percent Percent Valid Yes No Total
191 Missing System 5.5 Total Readings 61.9% of the respondents believe that use of LPG is not very expensive and the rests 38.1% consider it very expensive. Inferences More respondents believe that use of LPG is not very expensive. So respondents consider LPG and CNG as not very expensive fuel in comparison to petrol & diesel. Table : Compared to Petrol/Diesel cars, Electric car use increases transport economy Cumulative Frequency Percent Valid Percent Percent Valid Yes No Total Missing System 6.5 Total Readings 56.3% consider feels increase in transport economy while using electric car in comparison to petrol & diesel cars. 190
192 43.7% of the respondents believe that use of electric car will not increase transport economy. Inferences For the parameter of transport economy respondent weigh highly to CNG in comparison to both LPG as a fuel and electric cars. Table : Compared to Petrol/Diesel cars, Electric car use improves Vehicle life Cumulative Frequency Percent Valid Percent Percent Valid Yes No Total Missing System 4.4 Total Readings 54.1% of the respondents believe that use of electric cars will improve vehicle lift and the rest (45.9%) are of opposite view. Inferences More respondents consider electric cars as a low power vehicle in comparison to traditional petrol & diesel cars. Table : Compared to Petrol/Diesel cars, Electric car use reduces Air pollution 191
193 Cumulative Frequency Percent Valid Percent Percent Valid Yes No Total Missing System 2.2 Total Readings 92.3% of the respondents believe that electric cars will reduces air pollution. Only 7.7% of the respondents believe that electric cars will not reduces air pollution. Inferences Maximum respondents believe that electric cars cause very less pollution and consider it as an environmental friendly vehicle. Table : Compared to Petrol/Diesel cars, Electric car use reduces noise Cumulative Frequency Percent Valid Percent Percent Valid Yes No Total Missing System
194 Table : Compared to Petrol/Diesel cars, Electric car use reduces noise Cumulative Frequency Percent Valid Percent Percent Valid Yes No Total Missing System 4.4 Total Readings 89% of the respondents believe that electric cars reduce noise. Only 11% of the respondents believe that use of electric cars will not reduce noise. Inferences A major section of respondents consider electric cars as air pollution free, noise pollution free and so a complete environmental friendly vehicle. Most of the respondents have sufficient information regarding environmental benefit of the electric cars. Table : Compared to Petrol/Diesel cars, Electric car use reduces space in Vehicle Cumulative Frequency Percent Valid Percent Percent 193
195 Valid Yes No Total Missing System 5.5 Total Readings Majority (55.6%) respondents do not think electric cars reduce space in vehicle. 44.4% respondents think electric cars reduces space in vehicle. Inferences More awareness regarding electric vehicles may be needed. Designing the vehicle according to public demands may be necessary. Table : Compared to Petrol/Diesel cars, Electric car use increases carrying capacity Cumulative Frequency Percent Valid Percent Percent Valid Yes No Total Missing System Total
196 Readings 70.1% respondents do not think electric cars use increases carrying capacity. 29.9% respondents think electric car use increases carrying capacity. Inferences Most of the respondents are aware of the fact that electric cars are small in size and so has less carrying capacity. Table : Compared to Petrol/Diesel cars, Electric car use increases pick-up Cumulative Frequency Percent Valid Percent Percent Valid Yes No Total Missing System 3.3 Total Readings 68.0% respondents think electric car does not increase pick-up. 32.0% respondents think electric car increases pick-up. Inference More comparatively information needs to be conveyed to the users. Awareness regarding the use of electric cars may be low. 195
197 Table : Compared to Petrol/Diesel cars, Electric car use makes road transport very expensive Cumulative Frequency Percent Valid Percent Percent Valid Yes No Total Missing System 3.3 Total Readings 66.1% of the respondents believe that use of electric cars is not very expensive and the rests 33.9% consider it very expensive. Inferences Because of the high cost of the electric cars, not a very high percentage of the respondents consider it as a less expensive road transport Over all conclusions on response to fuel price changes and fuel option choices: From the analysis of data collected to understand the choices of respondents for fuel options under differing circumstances of fuel price relations deep insights are obtained. The data leads to the following conclusions. The next car fuel option is almost equally distributed with 38 % people planning a diesel car, 32% planning on a petrol car and 30 % planning on a CNG car. Petrol which is generally costlier fuel than diesel if the price differential were to become 25% premium for petrol against diesel respondents would still prefer a petrol car, 57.6 % and only 28% would reconsider the petrol option. Very few would consider buying other fuel car. Yet if not petrol then the choice is largely for CNG 50% or LPG 28% and only 19% would consider diesel option. Electric option is a negligible 2.2%. But if the petrol prices were to be 35% more than diesel prices, 53% would reconsider buying the petrol driven car. And more people would consider buying or surely buy other fuel run car, nearly 20% for 196
198 each. Under the circumstances the choice for CNG option goes up to almost 70% with 14 for LPG and 11.6 for diesel. Taking the petrol prices further up to 50% more than diesel prices, the shift is back to petrol car 27% while 61% would think f alternate fuel options. But in this case the shift is back to diesel, 62% as against the choice of CNG as observed above. At a 50% price differential between petrol and diesel the second choice is diesel while at lesser price differential it is CNG. But with petrol prices increasing, 25%, 35% and 50% more than diesel, Electric car as a choice of fuel is increasing gradually, 2.2%, 5% and 9.5% respectively. On the contrary when queried for diesel prices increasing in comparison to petrol the choices again vary. With diesel prices at par with petrol prices, about 4 % people will still choose to buy diesel car, and only about 7% people would surely buy other fuel car. Again CNG is the most popular choice as alternate to diesel if diesel and petrol prices are at par. Much change in choices is seen if diesel becomes 20% costlier to petrol. While 15% would still buy diesel car, 43 % would reconsider the diesel car. While 20% each would consider or surely choose other fuel, and the other fuel being CNG for 63.5% people. Electric car is not seen as a good option with only 0.8% opting for the same. But with diesel becoming 50% more costly than petrol 42% people will surely choose some other fuel, while 31% would reconsider the diesel option. But the alternate fuel choice reverts back to petrol 41% after CNG 52% and electric option figuring 4.2 %. Given a choice to buy a CNG car at the same price as petrol/diesel with CNG easily available, 57.7 % would like to buy a CNG car while 42.3 would not prefer CNG. For both petrol and diesel when costlier to each other the next most widely accepted fuel choice is CNG. But if CNG prices become equal to diesel price 47% would still opt for CNG while 22% would reconsider the CNG option. Importantly with CNG and diesel sold at same price, only 2% people would shift to petrol while 71.6 would buy diesel option and 24% would opt for LPG. In a similar situation of CNG and petrol prices being equal only 38.6% would still remain with CNG option and the other option selected would be diesel 73.7%. The electric option gets a boost with 12.3 % people shifting to Electric fuel option. With CNG price becoming 25% more than petrol price only 9.6 % people would remain with CNG choice and the next choice would be diesel 66% and LPG 22%. The option for electric car would be 7.3% It is observed that if not CNG the next choice is largely diesel, LPG about 22% and electric cars, maximum12.3% when CNG price equal petrol price. If an electric car variant were offered at the same price as other fuel cars, with adequate charging facilities 86.5% people would like to buy the electric car. Those not opting for 197
199 electric car give reasons like poor performance, and lack of awareness for not choosing electric option. When using CNG, LPG or Electric vehicles compared to petrol or diesel, CNG option is believed to be able to increase transport economy compared to LPG or electric options. These alternate fuels are not believed to impact much on the vehicle life. Electric and CNG cars are believed to be reducing air pollution where in case of electric car 92% people believe so. A similar response is also observed for noise reduction. Respondents are very positive on reducing air pollution and noise for Electric cars. These fuels do impact on space in vehicle or carrying capacity, though not opined very strongly; Electric cars are expected to increase carrying capacity by 70% of the people. While responses for increasing pick-up are slightly positive for CNG and LPG they are not positive for Electric cars. None of the alternate fuel is going to make road transport very expensive, meaning to say most people believe this fuel choices may actually make road transport economical. 2.6 Behavioural response to fuel price change: In the previous section we obtained insights on peoples responses to fuel price changes in context of prices of other fuels and availability of alternate fuel vehicles at reasonable prices. This section offers insights on behavioural response to fuel price increase, what behaviour changes would be implemented when faced with fuel price increase. Table 5.1.A: Response to fuel price increase: Reduce fuel consumption Cumulative Frequency Percent Valid Percent Percent Valid Strongly Disagree Disagree Neutral Agree Strongly Agree Total
200 Missing System 3.3 Total Readings The responses of respondents when they are asked to reduce the fuel consumption when the fuel price increases is categorised into 5 categories scale: strongly disagree, disagree, neutral, agree, & strongly agree. 61.3% of the respondents strongly agree & 31.4% agree in reducing fuel consumption. Very small percentage (only 1.5%) of respondents disagrees with this view. 5.8% of the respondents are neutral in this matter. Inferences 92.7% of the respondents either agree or strongly agree in reducing fuel consumption when the fuel prices increases. Most of the respondents think to reduce their consumption instead of switching to other source like CNG or electric cars. Table 5.1.B: Response to fuel price increase: Decrease fuel budget allocation Cumulative Frequency Percent Valid Percent Percent Valid Strongly Disagree Disagree Neutral Agree
201 Strongly Agree Total Missing System 2.2 Total Readings The responses of respondents when they are asked to decrease the fuel budget allocation when the fuel price increases is categorised into 5 category scale: strongly disagree, disagree, neutral, agree, & strongly agree. 47.2% of the respondents agree & 18% are strongly agreed in decreasing fuel budget allocation. 22.1% of the respondents are neutral for this parameter. A significant number (12.2%) of respondents are disagreeing to decrease their fuel budget allocation when there is increase in fuel prices. Inferences 65.2% of the respondents either agree or strongly agree to decrease the fuel budget allocation. So most of the respondents are trying to reduce their consumption when fuel prices increases. 12.7% of the respondents are thinking to increase their fuel budget with the increase in fuel prices. Table 5.1.C: Response to fuel price increase: Divert budget form other expenses Cumulative Frequency Percent Valid Percent Percent Valid Strongly Disagree
202 Disagree Neutral Agree Strongly Agree Total Missing System 3.3 Total Readings 35.5% of the respondents are neutral to this question to divert budget from other expenses when the fuel prices increases. 24.2% agree with this view and 15.6% strongly agree. 24.7% of the respondents are disagreeing or strongly disagree to divert budget from other expenses. Inferences More than half of the respondents are either neutral or disagree of this view to divert budget from other expenses. So the respondents are not willing to divert budget or this may be the case that they are not being able to do this because of increase in inflation due to increase in fuel prices. Table 5.1.D: Response to fuel price increase: Switch fuel Petrol to Diesel Cumulative Frequency Percent Valid Percent Percent 201
203 Valid Strongly Disagree Disagree Neutral Agree Strongly Agree Total Missing System 3.3 Total Readings The question is to find that whether respondents switch to another fuel when there is increase in fuel prices and is categorised like previous question categories. 36.1% are agreeing and 24.6% strongly agree with this view to switch their fuel type from petrol to diesel. 23.4% of the respondents are neutral for this question. 15.8% of the respondents either strongly disagree or disagree to switch from petrol to diesel as a fuel. Inferences Majority (60.7%) of the respondents are in view to switch their fuel type from petrol to diesel. Less number of respondents is disagreeing with this view. So most of respondents are not considering other switching cost while shifting from petrol to diesel. 202
204 Table 5.1.E: Response to fuel price increase: Switch fuel Petrol / Diesel to LPG/CNG/Electric Cumulative Frequency Percent Valid Percent Percent Valid Strongly Disagree Disagree Neutral Agree Strongly Agree Total Missing System 2.2 Total Readings 41.6% of the respondents are neutral or disagree to switch to LPG, CNG or electric car. 58.4% of the respondents are agreeing of the view to switch to LPG/CNG or electric car. Inferences More than half of the respondents are of the view to shift to more environmental friendly fuel, but that switching will be because of increasing price of conventional fuel. Table 5.1.F: Response to fuel price increase: Opt for Car/Vehicle Pooling 203
205 Cumulative Frequency Percent Valid Percent Percent Valid Strongly Disagree Disagree Neutral Agree Strongly Agree Total Missing System 4.4 Total Readings Only 30.2% of the respondents are of the view to make a pool of car or vehicle during their daily commute. 35.9% of the respondents are neutral and 34% are disagreeing of car-pooling during their commute. Inferences Very less number of respondents is with the car pooling idea in their commute. Since our maximum respondents are from urban area so large distance between commuters is may be the reason for this view. Table 5.1.G: Response to fuel price increase: Switch from 4 Wheeler to 2 Wheeler Cumulative Frequency Percent Valid Percent Percent 204
206 Valid Strongly Disagree Disagree Neutral Agree Strongly Agree Total Missing System 6.5 Total Readings 58.2% of the respondents are of the view that they will switch to two wheelers when the fuel prices increases. 18.3% of the respondents are neutral and 23.5% disagree with this view of switching to two wheelers. Inferences Many respondents are of the view to switch to two wheelers when the fuel prices increases. A significant number of respondents (41.8%) are of idea not to switch to two wheelers. Table 5.1.H: Response to fuel price increase: Practice No Car / No 2 Wheeler Day Cumulative Frequency Percent Valid Percent Percent 205
207 Valid Strongly Disagree Disagree Neutral Agree Strongly Agree Total Missing System 3.3 Total Readings 49.1% respondents disagree to the notion. 28.1% respondents are neutral. 22.8% respondents agree to the notion. Inferences There may not be other alternatives except using their vehicles. Fuel expenditure may not be of significant proportion in the overall expenditure. Table 5.1.I: Response to fuel price increase: Opt for work from home Cumulative Frequency Percent Valid Percent Percent Valid Strongly Disagree Disagree
208 Neutral Agree Strongly Agree Total Missing System 2.2 Total Readings 76.9% respondents disagree to the notion. 10.1% respondents are neutral. 12.9% respondents agree to the notion. Inferences Most of the population may not have an option of working from home. The work may not be permissible or feasible from home Table 5.1.J: Reduced work week 6 to 5 Days Cumulative Frequency Percent Valid Percent Percent Valid Strongly Disagree Disagree Neutral Agree
209 Strongly Agree Total Missing System 2.2 Total Readings 52.0% of the respondents strongly disagree to the notion of reducing their working days. 24.2% respondents disagree to the notion. 3.1% respondents strongly agree to the notion. Inferences Majority of the population would continue working for 6 days per week. The quantum of increase in the fuel prices may not have been justifiable enough to decrease the number of working days. Majority of the population is in private service. Hence there may not be any option to reduce the working days. There may be a tendency of working for more number of days so as to balance the increased expenditure. Table 5.1.K: Stopped Wing Air-conditioner in Car Cumulative Frequency Percent Valid Percent Percent Valid Strongly Disagree Disagree
210 Neutral Agree Strongly Agree Total Missing System 4.4 Total Readings 33.8% respondents are neutral to the notion. 31.4% respondents agree to the notion. 23.6% respondents disagree to the notion. Inferences Majority of the population may stop air-conditioner in their cars. Air-conditioner may be consuming the fuel in good proportion. There may not be many options to balance the increase in fuel prices. Comfort due to air-conditioner may not be significant. Table 5.1.L: Response to fuel price increase: Learn and conduct efficient driving techniques Cumulative Frequency Percent Valid Percent Percent Valid Strongly Disagree Disagree
211 Neutral Agree Strongly Agree Total Missing System 8.7 Total Readings 47.1% respondents strongly agree to the notion. 32.1% respondents agree to the notion. 13.6% respondents are neutral. Inferences Majority of the population would learn and conduct efficient driving. Fuel price increase has significant impact on how the public drives. There may not be many alternatives for balancing the increase in the fuel prices. Table 5.1.M: Response to fuel price increase: Sold-off 2 / 4 Wheeler Cumulative Frequency Percent Valid Percent Percent Valid Strongly Disagree Disagree Neutral Agree
212 Strongly Agree Total Missing System 3.3 Total Readings 47.1% respondents strongly disagree to the notion. 12.3% respondents are neutral. 14.3% respondents agree to the notion. Inferences Selling off of their vehicles may not be considered as a good option. Vehicles may be fuel efficient. There may be other alternatives to balance the increase in the prices. Table 5.1.N: Response to fuel price increase: Bought more fuel efficient car Cumulative Frequency Percent Valid Percent Percent Valid Strongly Disagree Disagree Neutral Agree
213 Strongly Agree Total Missing System 3.3 Total Readings 41.1% respondents strongly agree to the notion. 15.8% respondents are neutral. 6.1% respondents disagree to the notion. Inferences The present cars may not be as fuel efficient. There may not be many alternatives to balance the increase in the fuel prices. There may be cars which use other sources of fuel. Table 5.1.O: Response to fuel price increase: Any other technique to balance fuel price increase Cumulative Frequency Percent Valid Percent Percent Valid Strongly Disagree Disagree Neutral Agree Strongly Agree
214 Total Missing System 2.2 Total Readings 53.5% respondents agree to the notion. 15.5% respondents are neutral. 5.1% do not agree to the notion. Inferences There may be unawareness amongst those who disagree to the notion regarding other methods to balance fuel price increase. Majority of the population may use other techniques to balance fuel price increase. Over all conclusions on behavioural response to fuel price change: Taking cue from peoples answers to questions on various behavioural aspects in response to fuel price increase it can be concluded that there are definite behaviour manifestations that can be observed/expected. With 92% responses indicating reduction in fuel consumption in response to fuel price increase, it is worth observing that percent people learn energy efficient driving or bought a more fuel efficient car, and large number of people looking at decreasing their fuel consumption budget allocation. Work from home; reducing workdays from 6 to 5 or selling off their vehicle is not observed as a preferred option at all. Similarly practising no car/two-wheeler day or vehicle pooling is also not a favourable option to tackle fuel price increase. Switching fuel from petrol / diesel to CNG/LPG is observed more than switching from petrol to diesel or diverting budget from other allocations, though a large number of people are prone to do so. Switching over from four-wheeler to two-wheeler and stop using air-conditioner in the car are also observed to an extent. A large number of respondents are practicing or would like to take up other technique or strategy to balance the fuel price increase. 2.7 Use of Public Transport: Trying to understand the attitude towards and use of public transport would help devise methodologies / options for higher utilization of 213
215 mass transit options which are observed to be very economical and environment friendly. Appropriate questions were asked to understand peoples attitude and preference of mass transit public transport options. The following section provides insights on peoples attitude towards and preference for public transport options. Table 6.1: Use of Public Transport number of times per week Cumulative Frequency Percent Valid Percent Percent Valid Never Once a week Twice a week Thrice a week Four times a week Five Times a week Total Missing System Total Readings Data is divided into the following six categories: never, once a week, twice a week, thrice a week, four times a week and five times a week. 66.0% of the respondents use public transport once a week. 16.7% respondents use public transport twice a week. 16.0% respondents never use public transport. 214
216 There are 1099 respondents from which 294 have responded suitably and data of 805 respondents is incomplete. Inference The use of public transport needs more emphasis. There may be less a necessity for public transport for more than three times a week. The quality of public transportation available needs to be checked. Table 6.2: Type of Public Transport used Cumulative Frequency Percent Valid Percent Percent Valid Bus Auto-Rikshaw Railway Bus and Auto-rickshaw Bus and Railway Total Missing System Total Readings 58.0% of respondents use auto-rickshaw. 30.8% of respondents use Bus. 215
217 0.9% of respondents use railway. There are 1099 respondents from which 331 have responded suitably and data of 768 respondents is incomplete. Inference The limited penetration of railways may have hampered its usage by the public. Ease of availability may be a prime consideration for using public transport. Travelling may be between short distances. Table 6.3: Opt for Public Transport if fuel prices go up Cumulative Frequency Percent Valid Percent Percent Valid Yes No Total Missing System 4.4 Total Readings 63.1% respondents would not opt for public transport if fuel prices go up. 36.9% respondents would go for public transport if fuel prices go up. Inferences Increase in the fuel prices does not have significant impact for change in the usage of public transport. Amount of increase may have been neglected. 216
218 Proportion of total fuel expenditure may be low. More emphasis may have been laid on convenience. Table 6.4: Type of Public Transport option if fuel prices go up Cumulative Frequency Percent Valid Percent Percent Valid Bus Auto rickshaw Other Bus and Auto-rickshaw Bus and Railway Bus, Auto - rickshaw and Railway Total Missing System Total Readings 31.8% respondents would use rickshaw. 5.1% respondents would use a bus. 51.3% respondents would use both bus and rickshaw. Inferences Auto-rickshaw and bus may be the most widely used public transportation. 217
219 There may not be many alternatives other than those mentioned in the options. Railways may not be used for short travels. Over all conclusions on use of public transport: While a number (16%) of respondents never use public transport facilities, nearly 77 % use it once or twice a week. Of the people who opt for public transport most opt for auto-rickshaws (58%) while many (30%) use bus services. About 10 % use a combination of bus and auto-rickshaw. What is important to note is that even if the fuel prices go up, sizeable number (63%) of people would not opt for more use of public transport. With about 37% saying they would opt to use public transport. Those willing to opt for public transport have indicated their preference for bus and auto-rickshaw (51%) and auto-rickshaw (31.8%). People opting for only bus are a very few 13.5 % of the respondents. Metro or rail is not observed to be opted, since there is no such services available in any city or town of Gujarat as of now. 3. Discussion: Data presentation, readings and inferences lead to conclusions as seen above. On the basis of overall conclusions it is easier to draw broad inferences and arrive at findings that would lead to developing suggestions for positive action. 3.1 Broad Inferences and Findings: The research data collected offers a variety of insights that help at inferring the peoples behavior, approaches and choices. With an appropriate sample selection across the geography of Gujarat state the respondents are considered as good representative sample of the population. The ownership pattern is indicative that in the present day people prefer to change their vehicles over 3 to 5 years. This offers very good opportunity for automobile manufacturers to introduce new models and versions of vehicles with the most contemporary and advanced technologies. This is also very possible since most people prefer to opt for a higher version of the size and type of car when buying a new vehicle for their household. With most households one-car households and majority looking to buy new car due to family needs, either as replacement or an addition, the possibility of the second car and a more advanced car are very high. With average usage of vehicles ranging between 100 and 250 kilometers per week over 25 to-and-from trips and the fuel expenses not being a very significant portion of monthly household expenses the compulsion of fuel choice for economy is not very high. Fuels consumption both by volume and value is not very significant and people are able to manipulate their budget allocation without much difficulty in case of price increases for fuel. This also indicates why most people do not plan either accurately or regularly their monthly fuel budgets. People are conscious about their 218
220 vehicle performance and get their cars services regularly at authorized service dealerships. The average expenditure on car maintenance and repairs is also positive indicator of healthy behavior. The buying of new car is initiated due to evolving family needs and family members commuting needs along with the social need satisfaction. Low mileage and high maintenance costs are not the reasons driving a new car purchase. With modern technology cars available in the market since 20 years and more mileage and maintenance have been uniformly controlled with the new technology vehicles coming into the market in India. Price of the new car is the ultimate deciding factor in the purchase of a new car along with the maintenance cost of the car. People are conscious and careful about the fuel type in buying a new car and it is a conscious decision that they make. While fuel efficiency is important the running cost of cars is having average importance. Engine power and brand/manufacturer name are also considered with care in buying a new car. With most people willing to pay up to Rs 600, and many also willing to go up to 1000, motor car manufacturers have ample opportunities to offer high technology in terms of fuel efficiencies and low maintenance costs. If a manufacturer having good image in the mind of people is able to establish the value for money through robust design and efficient on road performance people will be willing to pay the price asked for. While diesel is the high choice of fuel for the new car, the lead is not strong in comparison to either petrol or CNG. Even with petrol prices 25% higher than diesel people will still opt for petrol vehicle. And in looking for an alternative fuel technology, CNG tops by far with diesel at the lower end after LPG which continues even at petrol being 35% costlier than diesel. But with petrol 50% higher in price to diesel people will shift to diesel rather than CNG. This is indicative of how the three fuel prices are interconnected and influence thinking of people at large. Electric car option is not very popular and will be opted for only if both diesel and petrol become very costly. The entire pattern is repeated for diesel prices variations against other fuel prices with CNG coming up as the top choice of alternative fuel. If a CNG variant is introduced at the same price-point as other car of choice and with CNG availability improving the choice to buy a CNG variant is not so encouraging 57 %. But with sufficient promotion and education about the benefits of CNG over diesel or petrol more people can be motivated and incentivized to opt for the CNG option. With CNG prices becoming equal or more than diesel or petrol prices the outright choice is diesel as the fuel option, with LPG is distant second choice. Electric vehicles are still not coming into favor. Offering electric cars may require a large effort at educating and 219
221 convincing customers of the benefits of electric cars. But in hybrid mode with other fuel combination, electric cars may be offered. This is indicated by a large number 86.5% people willing to buy an electric car provided the price remains same and public charging facilities are developed sufficiently. Those not opting for electric cars consider lack of information or awareness and a poor performance image as the reasons for not buying electric cars. With good automotive technology in electric variant and improved battery performance supported by suitable infrastructure for recharging the electric car may become an important player. Comparing CNG, LPG and Electric cars, electric cars are best evaluated at reducing pollution; both air and noise. CNG cars while contributing to both, also increase the transport economy. LPG is rated average on most counts of comparison. Electric car technology comes at par to CNG on most counts where not better. People may be easily motivated through right kind of promotions, education and incentives to select electric cars if introduced with required infrastructure support. People can be motivated to opt for either CNG or Electric cars since most are convinced about their efficacy and economy. With increase of fuel prices people want to reduce fuel consumption and their expenditure on fuel and hence would opt for low price fuel and fuel efficient vehicles. A suitable pricing mechanism would help direct peoples choice toward more efficient fuel technologies and more eco-friendly fuel choices. Reducing number of working days or opting for work from home not a viable option local conveyance shall remain on the same growth trajectory for the next few years. Again car pooling or no-car days are also not viable propositions for most people. Marginal cases would shift from a four wheel to a two wheel vehicle if fuel becomes costly. CNG is the most attractive option for most people to bring down their fuel expenditure. Very few people are likely to sell off their personal vehicle even with fuel prices going up. The motivation to use public transport is not very strong. Again in a circumstance of need to use public transport the choice is an auto-rickshaw rather than a bus. Thus the tendency is for personal, independent transport support system rather than the shared public transport. 220
222 参考文献 Anand, Mukesh Kumar (2012). Diesel Pricing in India: Entangled in Policy Maze. National Institute of Public Finance and Policy (Working Paper No ) Anand, Rahul; Coady, David; Mohommad,Adil; Thakoor, Vimal and Walsh,James P. (2013). The Fiscal and Welfare Impacts of Reforming Fuel Subsidies in India. IMF working paper (WP/13/128). Ang, G. and Marchal, V. (2013), Mobilising Private Investment in Sustainable Transport: The Case of Land-Based Passenger Transport Infrastructure, OECD Environment Working Papers, No. 56, OECD Publishing. ARAI (THE AUTOMOTIVE RESEARCH ASSOCIATION OF INDIA) (2011). INDIAN EMISSIONS REGULATIONS, Limits, Regulations & Measurement of Exhaust Emissions and Calculation of Fuel Consumption. Retrieved from: Auto fuel Policy, Ministry of Petroleum and Natural Gas, Government of India (2003). As per Retrieved from: School of Petroleum Management, PDPU, Library e-document archives. AUTO FUEL VISION AND POLICY 2025 Government of India Report of the Expert Committee (2014). As per Available at: School of Petroleum Management, PDPU Library e-document archives. Bandivadekar, Anup. (2013). Global Best Practices in Fuel Efficiency Policies. CSE Workshop on Transport and Climate. Retrieved from: Bansal, Gaurav, Bandivadekar, Anup, & Lloyd, Alan. (2012). The Potential of Lower Vehicular Emissions in Indian Cities. International Council on Clean Transportation Retrieved from: 2.pdf Bansal, Gaurav, Bandivadekar, Anup. (2012). The Benefits of Low Sulphur Fuels in India. 221
223 International Council on Clean Transportation Retrieved from: Bansal, Gaurav, Bandivadekar, Anup. (2013). OVERVIEW OF INDIA S VEHICLE EMISSIONS CONTROL PROGRAM. International Council on Clean Transportation Retrieved from: pdf Bansal, Gaurav, Posada, Francisco, Baral, Anil, Bandivadekar Anup. (2012). Costs and Benefits of Cleaner Fuels and Vehicles in India. Retrieved from: 012_updated.pdf Bansal, Gaurav. (2013). Vehicle Emissions Compliance for Light-Duty Vehicles in India. International Council on Clean Transportation, Working paper Retrieved from : ance%20light-duty%20vehicles%20in%20india.pdf BEE (Bureau of energy efficiency) (2005). Passenger Vehicle Fuel Economy Standards and Labelling Program. Retrieved from Bhanumurthy, N. R., Das, Surajit, &Bose, Sukanya, (2012). Oil Price Shock, Pass-through Policy and its Impact on India. National Institute of Public Finance and Policy (Working Paper No ) Bhattacharya B. & Batra, Amit. (2009). Fuel Pricing Policy Reform in India: Implications and Way Forward. Economic and Political Weekly. BEC (Bureau of Energy Consultation, Department of Heavy industries). ( 2011). Consultation Paper. Based on Passenger Car Fuel Economy Labelling & Standards Framework. Retrieved from: 1Oct2011.pdf CSE (ii) Centre for Science and Environment International Workshop Series on Transport and Climate. Retrieved from : 222
224 Chambliss, Sarah; Miller, Josh; Façanha, Cristiano; Minjares, Ray, and Blumberg, Kate (2013). THE IMPACT OF STRINGENT FUEL AND VEHICLE STANDARDS ON PREMATURE MORTALITY AND EMISSIONS. ICCT global transportation health and climate roadmap series. Retrieved from : _2013_cover.png Chugh, Randy & Cropper, Maureen L. (2014). The Welfare Effect of Fuel Conservation Policies in the Indian Car Market. Retrieved from: Chugh, Randy, Cropper, Maureen, Narain, Urvashi (2011) The cost of fuel economy in the Indian passenger vehicle market. Energy Policy 39 (2011) Coady, David; Granado,Javier Arze del; Eyraud Luc; Jin,Hui; Tuladhar, Anita; Thakoor,Vimal, and Nemeth, Lilla (2012). Automatic Fuel Pricing Mechanisms with Price Smoothing: Design, Implementation, and Fiscal Implications. International Monetary Fund (JEL classification no: D49, D61, H21) Commodity Online (2013). Indian Railways' go-green, fuel efficient system for Diesel locomotives. -system-for-diesel-locomotives html Crisil Infrastructure Advisory. (2010). Gas Pooling Mechanism (Report). India Infrastructure. Retrieved from: CSE (i) (Center for Science & Environment). Fuel economy standards: Getting the principles right. Retrieved from: CSE (CENTRE FOR SCIENCE AND ENVIRONMENT) (2006). Fuel economy regulations: setting the principles right. Retrieved from: Dahl, Carol, and Sterner, Thomas. (1991). Analysing gasoline demand elasticities: A survey. Retrieved from: EBTC Report on TRANSPORT AND ENERGY IN INDIA. (2013). Retrieved 223
225 from: GFEI (Global Fuel Economy Initiative) Plan of Action (2011). Retrieved from: df GFEI Fuel Economy State of the World (2014). Retrieved from: 14.pdf Ghosh, D.B. Centre for High Technology (2013). Learnings from Previous Auto Fuel Policy Initiatives. Available at: School of Petroleum Management, PDPU, Library e-document archives. Granado,Javier Arze del, Coady, David and Gillingham, Robert. (2010). The Unequal Benefits of Fuel Subsidies: A Review of Evidence for Developing Countries. IMF working paper (WP/10/202) Halcrow Group Ltd (2008). Breaking the Trend: Visioning and Back casting for Transport in India & Delhi. Retrieved from: Hart Energy and MathPro Inc. (2012). Technical and Economic Analysis of the Transition to Ultra-Low Sulphur Fuels in Brazil, China, India and Mexico. Prepared for International Council on Clean Transportation. Retrieved from: df ICCT (The International council on clean transportation) (2008). Design of Fuel Economy/Greenhouse Gas (GHG) Standards. Retrieved from: ICRA (Indian Credit Rating Agency) (2011). A Report on Indian commercial vehicle industry. Retrieved from: IEA (International Energy Agency) (2012). Policy Pathway-Improving the Fuel Economy of 224
226 Road Vehicles. Retrieved from: AL_WEB_Oct_2012.pdf IISD (International Institute for Sustainable Development) (2012). India s Fuel Subsidies: Q & A. Retrieved from: df IMF (International Monetary fund) (2013). Energy subsidy reform: lessons and implications. Retrieved from: ITR (India Transport Report) Volume I; E.S. (2014); National Transport Development Policy Committee, Planning Commission, Government of India; Routledge ITR (India Transport Report) Volume II Part I. (2014); National Transport Development Policy Committee, Planning Commission, Government of India; Routledge ITR (India Transport Report) Volume II Part II. (2014); National Transport Development Policy Committee, Planning Commission, Government of India; Routledge ITR (India Transport Report) Volume III Part I. (2014); National Transport Development Policy Committee, Planning Commission, Government of India; Routledge ITR (India Transport Report) Volume III Part II. (2014); National Transport Development Policy Committee, Planning Commission, Government of India; Routledge India s Developing Automotive Fuel Economy Policy. Retrieved from: ASE%20STUDY.pdf Indo-German Energy Forum. Automotive fuel efficiency and fuel quality (2007). Presented at Meeting of Indo-German Energy Forum. Retrieved from: Integrated Energy Policy: Report of the expert committee (2006). Retrieved from: Interim Report of the Task Force on Direct Transfer of Subsidies on Kerosene, LPG and 225
227 Fertiliser. (2011). Retrieved from: IRADe (Integrated research and action for development) (2012). Taming Diesel Subsidy to Curtail Inflation and Foster Economic Growth. Retrieved from: 0and%20Foster%20Growth_7%20May.pdf IRADe (Integrated Research and Action for Development) (2013). The Impacts of India s Diesel Price Reforms on the Trucking Industry. Retrieved from: Iyer, Narayan V. (2012). Emissions and Fuel Consumption Reduction Potential from Two and Three Wheelers in India. International Council on Clean Transportation. Retrieved from: Kelkar, Vijay, L., Rajaraman, Indira, & Misra, Sanjiv,(2012). ROADMAP FOR FISCAL CONSOLIDATION. Retrieved from: Kopp, Andreas; Block, Rachel I., and Iimi, Atsushi. (2013). Turning the Right Corner; Ensuring Development through a Low-Carbon Transport Sector. The World Bank working paper Retrieved from: 05/31/ _ /Rendered/PDF/780860PUB0EPI right0cor ner.pdf Lang, Keery, & Wooders, Peter. (2012). India s Fuel Subsidies: Policy recommendations for reform. Retrieved from: Lin, C.Y. Cynthia, & Lea Prince. (2013). Gasoline price volatility and the elasticity of demand for gasoline. Energy Economics, 38, Marathe, Shrikant, R., &Chaudhari, M. K., (2007). Overview of fuel efficiency of Indian fleet. International Seminar on Setting Fuel Economy Standards and Labeling of Transport Vehicles. Retrieved from: 226
228 Mathur, S. N. (2012). Modernise Indian Railways MERCADOS ENERGY MARKETS INDIA PRIVATE LIMITED. (2010). Study on Common Pool Price Mechanism for Natural Gas in the country. Retrieved from: MINISTRY OF ROAD TRANSPORT & HIGHWAYS (2011). Passenger and Freight Traffic Assessment and Adequacy of Fleet and Data Collection and Use of IT in Transport Sector in the Twelfth Five Year Plan ( ). Retrieved from: 6 Ministry of Urban Development (2013). Toolkit for Urban Transport Development. Retrieved from: MOPNG (Ministry of Petroleum & Natural Gas, Government of India) (Economic Division) (2013). Basic Statistics on Indian Petroleum & Natural Gas. Retrieved from: Nielsen &PPAC (Petroleum Planning and Analysis Cell) (2013).All India Study on Sectoral Demand of Diesel & Petrol. Retrieved from SectoralDemandofDiesel.pdf Parikh, Jyoti,& Khedkar Gayatri,(2013). The Impacts of Diesel Price Increases on India s Trucking Industry. The International Institute for Sustainable Development. Retrieved from: Parisar. Comments on proposed fuel economy standards framework. Retrieved from: y-standards.pdf Policy Summary: India s Vehicle Emissions Control Program. (2013). International Council on Clean Transportation. Retrieved from: 227
229 mary_ pdf Pundir, B. P. (2008). Fuel Economy of Indian Passenger Vehicles - Status of Technology and Potential FE Improvements. Greenpeace India Society, Bangalore. Retrieved from: Rao, V.I, (2013). Car fuel economy, Automobile Industry Perspective. Workshop Series on Transport and Climate. Retrieved from: Report of Expert Group. (2010). Viable and Sustainable System of Pricing of Petroleum Products. Retrieved from: Report of the Committee on Pricing and Taxation of Petroleum Products. (2007). India. Retrieved from: RNCOS (2006). Indian Automobile Industry- An Analysis ( ). Retrieved from: %29.pdf Roychowdhury, Anumita. Fuel economy standards: a non-starter. Retrieved from: Schipper, Lee, ( ).Automobile Fuel; Economy and CO2 Emissions in Industrialized Countries: Troubling Trends through 2005/6. EMBARQ, the World Resources Institute Centre for Sustainable Transport. Washington, DC. Sriraman, S.; Venkatesh, Anand; Karne, Manisha and Mohite, Vidya (2006). Competition Issues in the Road Goods Transport Industry in India. Final Report submitted to The Competition Commission of India. Retrieved from: =NMPFRahGKYeum5F74Ppstn7Rf00 Sterner, Thomas. (2006). Survey of Transport Fuel Demand Elasticities. SWEDISH ENVIRONMENTAL PROTECTION AGENCY Retrieved from: ments/publikationer/ pdf 228
230 T. M. I. Mahlia; Tohno, S.; Tezuka, T. A global review of success story on implementation of fuel economy standard for passenger cars: Lesson for other countries. Energy Education Science and Technology Part A: Energy Science and Research 2012 Volume (issues) 29(2): Takeuchi, Akie, Cropper, Maureen and Bento, Antonio. (2007). The impact of policies to control motor vehicle emissions in Mumbai, India. JOURNAL OF REGIONAL SCIENCE, VOL. 47, NO. 1, 2007, pp TERI (a) (The Energy and Research Institute). (2012). Fossil-Fuel Subsidy Reform in India: Cash transfers for PDS kerosene and domestic LPG. The International Institute for Sustainable Development. Retrieved from: TERI (b) (The Energy and Research Institute) & IISD (The International Institute for sustainable development) (2012). A CITIZENS GUIDE TO ENERGY SUBSIDIES IN INDIA. Retrieved from: TERI (The Energy & Resources Institute) (2012). Electric Vehicles in India, Challenges and opportunities. Retrieved from: pdf TOI; Pollution Solution; Swachh Bharat also means Swachh Vatavaran, start discouraging diesel.(2015); Times of India, Ahmedabad; January 5th 2015 TNN (Times News Network) (2011) Diesel engines to turn fuel-efficient. uel-efficient/articleshow/ cms Wipro Technologies and Dun & Bradstreet India. (2014). STEP ON THE GAS: Steer into the future of the Automotive Industry in India. Retrieved from: World Bank, ROAD TRANSPORT SERVICE EFFICIENCY STUDY. (2005) Study by World Bank. Retrieved from: 229
231 5.pdf 230
232 Final Report Project Code 2014UD05 A study to assess the potential impacts of relative fuel price changes on energy use by cars in India Prepared for Institute for Energy Economics, Japan
233 The Energy and Resources Institute 2015 Suggested format for citation T E R I A study to assess the potential impacts of relative fuel price changes on energy use by cars in India New Delhi: The Energy and Resources Institute. 50pp. [2014UD05] For more information Project Monitoring Cell T E R I Tel or Darbari Seth Block pmc@teri.res.in IHC Complex, Lodhi Road Fax or New Delhi Web India India +91 Delhi (0) 11
234 Table of Contents List of Figures Introduction Background and study objective Methodology, outline and limitations of the study a. Survey design and analysis i. Survey outline and design ii. The procedure for analysing survey results b. Modelling the impact of fuel price changes on energy use i. Determining the various scenarios based on survey inputs ii. Identifying the shares of different car fuel types in new sales under different scenarios and estimating their impacts on fuel and energy demand c. Assumptions and limitations of the study Results from the pri mary surveys Impacts of changes in relative fuel prices on energy consumption by cars Conclusion Bibliography Appendix Appendix 1: Survey questions related to energy use Appendix 2: A brief note about the TERI transport demand model... 49

235 List of Figures Figure 1 Diesel Gasoline car sales ratio and Price Difference... 8 Figure 2 Question hierarchy in survey design Figure 3 Share of different fuel types owned by respondents Figure 4 Vehicle fuel type intended to be bought Figure 5 Current ownership vs future fuel preference Figure 6 Changing shares passenger car fuel types under the BAU scenario Figure 7 Scenario 1.1: User response if petrol prices became 25% higher than diesel Figure 8 Scenario 1.1: Resulting choices of vehicle fuel types if petrol prices became 25% higher than diesel Figure 9 Scenario 1.1: Changing shares of passenger car fuel types Figure 10 Scenario 1.1: Shares of energy used by different fuels in 2011, 2021 and Figure 11 Scenario 1.2: User response if petrol prices became 35% higher than diesel Figure 12 Scenario 1.2: Resulting choices of vehicle fuel types if petrol prices became 35% higher than diesel Figure 13 Scenario 1.2: Changing shares of passenger car fuel types Figure 14 Scenario 1.2: Shares of energy used by different fuels in 2011, 2021 and Figure 15 Scenario 1.3: User response if petrol prices became 50% higher than diesel Figure 16 Scenario 1.3: Resulting choices of vehicle fuel types if petrol prices became 50% higher than diesel Figure 17 Scenario 1.3: Changing shares of passenger car fuel types Figure 18 Scenario 1.3: Shares of energy used by different fuels in 2011, 2021 and Figure 19 Scenario 2.1: User response if diesel prices became as high as petrol prices Figure 20 Scenario 2.1: Resulting choices of vehicle fuel types if diesel prices became as high as petrol Figure 21 Scenario 2.1: Changing shares of passenger car fuel types Figure 22 Scenario 2.1: Shares of energy used by different fuels in 2011, 2021 and Figure 23 Scenario 2.2: User response if diesel prices became 20% more than petrol Figure 24 Scenario 2.2: Resulting choices of vehicle fuel types if diesel prices became 20% more than petrol Figure 25 Scenario 2.2: Shares of energy used by different fuels in 2011, 2021 and Figure 26 Scenario 2.2: Changing shares of passenger cars fuel types Figure 27 Scenario 2.3: User response if diesel prices became 50% more than petrol Figure 28 Scenario 2.3: Resulting choices of vehicle fuel types if diesel prices became 50% higher than petrol Figure 29 Scenario 2.3: Changing shares of passenger cars fuel types Figure 30 Scenario 2.3: Shares of energy used by different fuels in 2011, 2021 and Figure 31 Scenario 3.1: User response if CNG prices became as much as diesel... 35
236 Figure 32 Scenario 3.1: Resulting choices of vehicle fuel types if CNG prices became as high as diesel Figure 33 Scenario 3.1: Changing shares of passenger car fuel types Figure 34 Scenario 3.1: Shares of energy used by different fuels in 2011, 2021 and Figure 35 Scenario 3.2: User response if CNG prices became as much as petrol Figure 36 Scenario 3.2: Resulting choices of vehicle fuel types if CNG prices became as much as petrol Figure 37 Scenario 3.2: Changing shares of passenger car fuel types Figure 38 Scenario 3.2: Shares of energy used by different fuels in 2011, 2021 and Figure 39 Scenario 3.3: User response if CNG prices became 25% more than petrol Figure 40 Scenario 3.3: Resulting choices of vehicle fuel types if CNG prices became 25% higher than petrol Figure 41 Scenario 3.3: Changing shares of passenger car fuel types Figure 42 Scenario 3.3: Shares of energy used by different fuels in 2011, 2021 and
237 1. Introduction The nature of mobility in India has been changing very drastically over the last couple of decades. Dominated by road transport this changing pattern of mobility has been characterized by very rapid levels of motorization. In the case of passenger transport, this increasing motorization intensity has been particularly high across the urban centres of the country which have seen the fastest services led economic growth in India. This explosion in economic growth and increasing disposable incomes have made the personal passenger car market in India one of the fastest growing and largest markets of passenger cars in the world. When examined from the point of view of energy use, this segment of vehicles, which are driven almost all on petroleum fuels, has also seen a very rapid increase in energy volumes in the same period of time. Given that India is a net importer of crude oil and has a very large and increasing fuel import bill, it is important to understand the linkage of the increasing volumes of passenger cars to India s fuel imports from the point of view of energy security. Such linkages are particularly relevant to examine given the recent changes in pricing strategies of petroleum fuels in India, changing people s choices of vehicle fuel technologies. There has been a complete removal of government support in the pricing of petroleum fuels such as petrol and diesel gradually over the last five years. As a result, the passenger car segment, driven almost completely on these fuels, has also seen fluctuating trends in sales numbers over the duration of these pricing changes. When the government price support on petrol was gradually being withdrawn and an increasing price differential between petrol and diesel prices emerged, there was a trend of increasing diesel passenger car sales. But with the gradual de-regularizing of diesel prices in the subsequent years, we have seen the arrest of dieselization of passenger cars in India, and a reversing trend towards higher sales of petrol cars. This experience over the last few years clearly highlighted the very high price sensitivities of the Indian consumer to fuel prices while making their choices of the car fuel type. These fuel price sensitivities are further accentuated for the passenger car segment given the large number of fuel types available for a passenger car purchaser. While petrol and diesel engines remain the principle workhorses for cars in India, CNG, LPG and more recently, electric vehicles, have been making inroads across various urban pockets of the country. No significant studies are however available in the public domain which investigate such sensitivities and impacts of price changes on the choice of car fuel types, and their eventual impacts on the consumption of energy. This study aims to fill this gap in literature by establishing such linkages and estimates the potential impacts on energy use and volumes resulting from the changing prices of fuels driving passenger cars in India.
238 2. Background and study objective Over the last couple of decades the Indian passenger vehicle segment has emerged as one of the fastest growing automobile markets in the world, and it is a trend which is expected to continue in the near and distant future (KPMG, 2013). This is however not a surprise given India s low penetration of cars at about 16 cars registered per 1000 population as of today (2011) and a rapidly growing yet young and aspirational economy. It is estimated that by 2016, India would become the third largest market (in terms of sales) for light vehicle sales in the world. By 2025, the penetration of cars would roughly double and increase to about 34 cars per 1,000 population. This would mean that there would be about 47 million cars on Indian roads as against an estimated 15 million in 2011 (Ghate & Sundar, 2013). This implies that the larger share of vehicles on the roads by is still to be added to the vehicle stock vastly increasing the demands on energy required to drive these vehicles and the resulting emissions from them. This situation is also that of opportunity. Since a larger number of vehicles are yet to be added to the vehicle pool, the country can chose to buy better and improved technologies thereby making them less resource and energy intensive. This could help reduce the nation s energy and resource burden for driving cars. With appropriate research and development focused on technology upgrade and adequate policies to encourage increased efficiencies in cars, India has the opportunity to reduce the energy intensities of its cars. This vehicle segment already offers the widest amount of product choices to the consumer in terms of size, weight, model, brand, efficiencies, fuel types, etc. The policies assisted with the necessary market cues in terms of appropriate vehicle and fuel prices could help guide car buyers to choose appropriate technologies to reduce overall energy intensities of these vehicles. The fuel price fluctuations seen over the last few years, due to changes in global prices and Indian petroleum price deregulations, have shown that this segment of vehicles is also highly sensitive to fuel prices. Various market reports and reviews have over and again highlighted that consumers are drawn to purchase diesel cars as soon as there has been a relative drop in its price over that of petrol even through the price gap increases have been temporary and one-off (ET Bureau, 2014) (Thakkar & Shyam, 2015) (Chaudhuri, 2014). This segment of vehicles also offers the largest interplay between different types of fuels such as petrol, diesel, CNG, LPG and now, more recently, electric and hybrid vehicles. Given such a wide range of products, the right price cues provided to such price sensitive customers might make it possible to move people from one fuel type to the other, thus diversifying the fuel basket and reducing the risks associated with energy security. However, even though alternate fuel vehicles such as CNG, LPG and electric have existed in the market for several years now, their penetration has been very limited (Planning Commission, 2014) (Roychowdhury, 2010). The major share of cars on the roads is largely driven by petrol and diesel even today. Interestingly there is no systematic record of the actual shares of different fuel types of cars running on Indian roads. Overall industry level records of actual number of cars sold by fuel types were not collected year on year till The shares of vehicles by different fuel types in the total vehicle stocks are estimates at best. Based on sales data information for several years, about 77% of the passenger cars on Indian roads have been estimated to be driving on petrol, 18% on diesel and the remaining on either CNG or LPG (2% each). In terms of annual sales, historically, about 80% of the cars sold in India used to be petrol and about 18-20%
239 % Share Price Difference (INR) diesel. With an almost price difference ranging from about Rs. 100,000 to Rs. 300,000, between the diesel and priced variants of the same car type (Deoras, 2014) (NDTV, 2014), the price conscious Indian car customer is likely to choose the petrol over the diesel model if her annual kilometerage is significantly not high enough to make up for this capital price differential. There was an aberration in this trend in the later part of the last decade. In , with the de-regulation of petrol prices, and the global fuel prices soaring through the roof, the price differential between petrol and diesel started widening in India. The price difference reached an all-time high with petrol being higher than diesel by Rs. 25 in The price conscious Indian car consumers quickly starting demanding diesel vehicles over their petrol variants, since the breakeven for the premium paid for diesel cars had come down significantly. Annual diesel car sales shares of total car sales also increased to an all-time high of 60% in 2012 (NRI, 2014). Figure 1 Diesel Gasoline car sales ratio and Price 100% 80% 60% 40% 20% 0% 75% 64% 53% 40% 55% % 47% 36% 25% 45% e Diesel Cars Gasoline cars Price Difference Source: NRI Analysis, SIAM Data, Press Articles as reported in (NRI, 2014) Such sudden changes in consumer choices due to changing fuel price cues have implications for both the automobile manufacturers and the country as a whole. Automobile manufacturers are forced to suddenly increase their production line capacities of one fuel type over another at large capital costs when there is increased demand for a particular fuel type. If the demand is not sustained, then the capital costs incurred gets sunk and becomes difficult to retrieve. For the country, price changes sudden price changes have a large number of implications from the point of view of both the immediate as well as the long term energy use and demand levels of the passenger car segment. As highlighted in the introduction section, there is however not enough literature is public domain to ascertain the fuel price sensitivities of the Indian car purchasers. This study tries to take a small step in the direction to fill this gap. The objective of this study is therefore to identify the price sensitivities of prospective Indian car purchasers on the relative prices of fuels and evaluate the larger impacts that their choices to buy a technology over another could potentially have on the overall demand for energy in the country. Assisted by stated preference primary surveys jointly designed by the Institute of Energy Economics, Japan (IEEJ), The Energy and Resources Institute (TERI) and Pandit Deendayal Petroleum University (PDPU) and conducted by PDPU across the state of Gujarat this study initiated IEEJ is aimed to understand the factors that affect consumer decisions in choosing the fuel type for a new car. Taking the results of the survey as inputs and by using TERI s Transport Demand Model, the study further goes on to highlight some of the implications that such consumer choices have on the resulting energy consumption and fuel volumes by cars.
240 The following section gives an overview of the methodology followed for the study. It gives details about the primary surveys conducted along with the analysis of the survey results and the modelling approach followed using TERI s transport demand model and its broad assumptions and limitations. The subsequent section outlines the various scenarios considered based on the survey findings and the related analysis and results. This is followed by the final section which highlights some of the findings and conclusions from the study.
241 3. Methodology, outline and limitations of the study Given the objective as highlighted in the section above, the study can be broadly segmented into two parts, with each part having two components. The first part of the study was related to a set of extensive primary surveys which were conducted to understand the importance that consumers give to fuel prices while determining the fuel technology for their car. This part of the study formed an input to the second part of the study which was related to modelling the survey results using TERI s Transport Demand Model. The analysis was used to determine the impact that consumer choices of different fuel types might have on the consumption levels of different fuels and the aggregate energy use. Following are the details of the two parts of the study along with their individual components: a. Survey design and analysis Given the objective of improving the understanding of the relationship of fuel prices on consumer choices, the first part of the study involved designing a survey after necessary literature review followed by analysis of the survey data. i. Survey outline and design Primary surveys were planned to be conducted by PDPU across the state of Gujarat, to help in identifying the relationship between fuel prices and their choices of vehicles of particular fuel types. Given the timeline and available budget, the survey was planned to be conducted across 1,000 potential car buyers in the state, to identify the factors they considered important at the time of purchasing a car. The target respondents of the survey were those who were planning to or had bought a new car in the last couple of years. A section of questions in the survey was focused to understand the factors that helped determine people s choices of different vehicle fuel types in relation to changing prices of fuel. TERI was involved in the design of the survey questionnaire for this purpose. The survey questions were designed using the stated preference methodology to understand the trigger for changing choices of vehicle fuel types with changing relative prices of the fuel, ceteris paribus. Potential car purchasers were first asked their primary choice of car fuel type they were intending to buy under the current circumstances of fuel price and technology availability. Three fuel type choices (petrol, diesel and CNG) were laid out before the respondents to choose from as their primary fuel type. Based on the primary fuel choice for the planned car, consumers were further asked how they would alter their decisions to buy the same fuel type car if the price of the chosen fuel were to progressively increase relative to the other fuels. The impact that a change in such a relative price of fuel would have on the choice of the vehicle was determined through this graduated questioning methodology. Figure 2 highlights the layered nature of the questions to help determine the importance that changing relative fuel prices would have on the consumer s decisions of purchasing
242 a vehicle of a particular fuel type (Please refer to Appendix 1: Survey questions related to energy use for all the questions). A total of 1099 respondents were surveyed by PDPU across the state of Gujarat. Of these, about 61% responded to questions related to the impact of their changing decisions as a result of changing relative fuel prices and are considered as part of the subsequent analysis. The procedure adopted for the analysis is highlighted below. ii. The procedure for analysing survey results The raw data from the survey related to the questions on change in consumer choices due to change in relative fuel prices was submitted by IEEJ to TERI. The data was cleaned, coded, prepared and analysed by TERI. Cleaning of the data involved replacing missing values and treatment of erroneous observations. Consistency checks were performed as part of the cleaning process to ensure that records did not have varying entries or codes for the same response. Coding and categorization of the data was undertaken to help in analysis of the responses. Survey response codes were compared with the questions as they appear in the questionnaire and relevant response codes were generated. In several instances different responses with similar meanings were grouped and categorized to make analysis of the data simpler. The data thus prepared was further analysed and formed the input for the relative-fuel price impact scenarios which were modelled and are elaborated in the sections below.
243 Figure 2 Question hierarchy in survey design Respondent planning to buy new car Planning to buy petrol car Planning to buy diesel car Planning to buy CNG car If prices of petrol became 25% more than diesel If prices of diesel became as much as petrol If prices of CNG became as much as diesel Will not change choice Will change choice Will not change choice Will change choice Will not change choice Will change choice If petrol prices became 35% more than diesel What would the choice be? If diesel prices became 25% times more than petrol What would the choice be? If CNG prices became as much as diesel What would the choice be? Will not change choice Wil change choice Will not change choice Will change choice Will not change choice Will change choice If petrol became 50% more than diesel What would the choice be? If diesel became 50% more than petrol What would the choice be? If CNG became 25% more than petrol What would the choice be? Will not change choice Will not change choice Will not change choice WIll change choice Will change choice Will change choice
244 [Page intentionally kept blank]
245 b. Modelling the impact of fuel price changes on energy use The results of the survey were considered to build different kinds of scenarios related to vehicle fuel shares in new vehicles sold. These scenarios were treated as inputs to TERI s national transport demand and energy model. The impact of changing consumer choices due to changing relative fuel prices were estimated using the model. A brief outline of the transport model is given below. TERI s Transport Demand Model TERI has developed a bottom-up national macro-model focused on the domestic passenger and freight transport in India. The model helps in estimating the total volumes of passenger and freight transport demand in India, and also estimates the energy and resulting CO2 emissions from the sector. With inputs from a large number of stakeholders spanning across industry, government and policy research, the model has been continuously evolving with better and improved assumptions and estimates since The key outputs from the model include indicators of transport demand such as passenger and freight-kilometres, fuel consumption, energy and emissions volumes from the domestic transport sector in India. The model has been used by various national policy agencies such as the Planning Commission and research institutes to develop transport energy scenarios for India. The total number of registered vehicles in India across the motorized road based modes along with the total traffic volumes of rail and air form the basic building blocks of the model. Using these, the model estimates the total passenger and freight transport demand in India by assigning various utilization and occupancy rates of each vehicle type. The assumptions and estimates related to utilization and occupancies, and information related to all the other vehicle types and modes of transport was assumed to remain unchanged under the various different scenarios considered for this study. More details about the model are available in the Appendix 2 (Appendix 2: A brief note about the TERI transport demand model) to this report. Given the objective of the study, the focus of the modelling exercise was limited to understanding the impacts of consumer choice changes in their choice of fuel types on the eventual volumes of fuel and energy use by cars and jeeps in India. In addition to this, the present exercise also modelled the impact of the various policies such as vehicle efficiency norms that are being taken up by the government and might have large impacts on the energy consumption of passenger vehicles. i. Determining the various scenarios based on survey inputs Various scenarios of relative fuel price changes were created based on the graduated nature of stated preference questioning chosen for this particular study. A total of nine different scenarios were created for the modelling exercise with three scenarios for each of the primary fuel type choices (Petrol, Diesel and CNG). The underlying assumption was that although the total number of cars to be purchased between now and would remain the same, the shares of cars by
246 fuel type would keep changing under the different scenarios. The various scenarios considered as part of the modelling exercise are as follows: Petrol becomes 25% more expensive than diesel Petrol becomes 35% more expensive than diesel Petrol becomes 50% more expensive than diesel Diesel becomes as expensive as petrol Diesel becomes 25% more expensive than petrol Diesel becomes 50% more expensive than diesel CNG becomes as expensive as diesel CNG becomes as expensive as petrol CNG becomes 25% more expensive than petrol The scenarios were assumed to come into effect starting in the year This would imply that the price changes would come into effect in , forcing a change in the consumer choices for vehicle fuel type starting that year. The impacts of these scenarios were assessed over the duration of a decade up to ii. Identifying the shares of different car fuel types in new sales under different scenarios and estimating their impacts on fuel and energy demand The model assumes that the scenarios would come into effect starting , implying that there would be a change in the consumer choices in purchase of new vehicles starting that year. This would lead to changing the shares of new cars of different fuel types purchased thereafter. A change in the choice of the car s fuel type would lead to changing the shares of different fuel types in the vehicle stock. This would in turn mean changing the volumes and types of fuel used to drive cars in India. This is captured by modelling each of the scenarios and estimating the scenario impacts. The changing choices of vehicle fuel types by the potential car purchasers would lead to changing the fuel basket and volumes of fuel used by cars in India. The potential impact that each of the scenarios would have on the fuel consumption by cars is estimated by the model. The estimated impacts under each of the scenarios are examined for a period between and , which is the end period for the modelling exercise. Like any extensive modelling exercise, this exercise too involved the use of a large number of assumptions. While some of the assumptions were related to the core model, some were specific to the scenarios considered particularly to this study. The following section outlines such assumptions and highlights the overarching limitations of the study.
247 c. Assumptions and limitations of the study The broad assumptions involved in the study for the survey and the modelling exercise are as follows: 1. Given the limited time and resources available, the survey was conducted only in the state of Gujarat. These survey results from Gujarat have been assumed while creating the various relative fuel price change scenarios for India. This assumption implies that the conditions of fuel infrastructure supply currently available in Gujarat in would be the same for the entire country in This assumption allows the average respondent surveyed in Gujarat to be representative of an average respondent across the country by , the year of the scenario impact. 2. The modelling exercise as part of the study has been undertaken with as the horizon period and as the base year. 3. The hypothetical scenarios as explained in the previous sections are assumed to come into effect starting This year has been chosen as impact year, to be able to assess the impact of the relative fuel price variations for about a decade thereafter. The relative fuel prices for each scenario are assumed to remain constant for the entire duration of modelling exercise after The total number of cars estimated to be purchased year on year for the duration of the modelling exercise has been assumed to remain fixed as per the base business-asusual scenario. The various scenarios described in the previous sections only result in changing the shares of vehicle fuel types based on the results of the survey. 5. The utilization and occupancy of cars have been assumed to remain unchanged from the business-as-usual even with changes in relative fuel prices, implying that there is no change in the levels of demand for car based mobility in the country. 6. The modelling exercise also makes assumptions about the improvement in fuel efficiency numbers for cars. It is assumed that the energy efficiency regulations for passenger cars come into effect in and new cars sold after become 10 per cent more efficient than those sold in the previous years. The various scenarios created from the survey results and the subsequent modelling and impact assessment exercise are based on these broad assumptions as highlighted above. The following section outlines the analysis of the survey results, followed by an overview of the potential impacts that these results might have in India.
248 4.Results from the primary surveys A total of 1,099 respondents were surveyed by the PDPU team across the state of Gujarat. 69% of those surveyed reported that they already owned a vehicle. Of those who owned vehicles, 63% owned petrol vehicles, 29% owned diesel vehicles, 7% owned CNG vehicles and only 1% owned LPG vehicles. Figure 3 Share of different fuel types owned by respondents Share of different fuel types owned by respondents 1% 29% 7% 63% Petrol Diesel CNG LPG However, 339 of the 1,099 respondents surveyed did not report ownership of a vehicle. Whether they owned a vehicle and did not report, or if they actually did not own a vehicle could not be established. Those who reported their vehicle ownership and related fuel types help in estimating the share of different fuel types in the historic stock of vehicles. The results clearly show that even in a CNG abundant state like Gujarat, petrol and diesel vehicles form the major share of the vehicle pool. Alternate fuels like CNG and LPG, which are new entrants into the car market, have fairly low penetration. This trend however appears to be changing. When respondents were asked about the kind of vehicle they intended to buy in the near future, the shares of different fuel types chosen appeared to be very different. Of all the respondents surveyed 61% responded stating that they were planning to buy a new car. Of these, 32% said that they wanted to buy a petrol car, 38% suggested that they were interested in buying a diesel car and 30% stated that they wanted to buy a CNG car. This is in stark contrast to the present stock of vehicles of the respondents, where CNG forms only a small 7%. This changing pattern in vehicle fuel choices is a result of a multitude of factors. The present scenario of vehicle efficiencies, fuel prices and infrastructure availability to deliver fuels have made diesel the most desired of all the fuel types closely followed by petrol and CNG. At the time of preparation of this report, both diesel and petrol prices in India are completely market determined. Variations in the petrol and diesel prices across the various states in India are only due to the numerous types of taxes imposed on the base price of the fuels. Petrol, which drives the larger share of the passenger car segment has historically been treated as a luxury fuel and been taxed higher than diesel. As a result, diesel prices, even when market determined, is sold at lower retail prices than petrol. This creates an artificial

249 price wedge between petrol and diesel, with petrol approximately Rs. 10 higher than diesel in early This is surely one of the most important factors considered by the respondents while making their present choices of the vehicle fuel type. Although diesel car models are on average priced Rs. 100 to Rs. 300 thousand higher than their equivalent petrol models, a higher share of respondents declared that they would want to buy a diesel car over both petrol and CNG cars. This indicates that the current relative price of these fuels and the higher fuel efficiencies offered by diesel cars made them the primary choice for most respondents. Figure 4 Vehicle fuel type intended to be bought Vehicle fuel type intended to be bought 30% 32% Petrol 38% Diesel CNG The national sales of CNG vehicles are limited to a handful of urban centres like Mumbai and Delhi, and form a very small estimated share of about 2 per cent of the fleet of passenger cars in the country. The share of respondents intending to buy CNG cars in Gujarat however was quite high compared to the national shares. This can be a result of the higher penetration of the CNG distribution network across the urban centres in Gujarat. With a lower price than both diesel and petrol, and easy availability about one-third of the respondents said that CNG was their primary choice when considering to buy a car. The survey also showed that a large number of the respondents also appeared to be moving away from the fuel type that they already owned to a different fuel type. About half the respondents who presently own diesel cars said that they would not switch to another fuel and 39% said that they were considering buying a CNG car in the near future. Only 13% of the car owners presently owning diesel cars said that they were considering a petrol car. This conforms to common logic. Given the relatively higher prices of petrol, most people owning diesel cars would want to move to the cheaper fuel, CNG.
250 Figure 5 Current ownership vs future fuel preference Current ownership vs future fuel preference CNG Diesel Petrol 100% 80% 28% 13% 40% 29% 60% 40% 28% 48% 40% 41% 20% 0% 44% 39% 30% 20% CNG Diesel LPG Petrol Only one third of the respondents presently owning petrol cars said that they were considering buying another petrol car and a larger share of about 41% said that they were thinking of buying a diesel car in the near future. The remaining were considering buying CNG cars. Like in the case of diesel cars, the largest share of respondents owning CNG cars were intending to stick to CNG (44%) for their next car purchase with a little less than one-third each considering buying either petrol or a diesel car in the near future. CNG not only seems to be a preferred alternate fuel choice contrary to the present shares of ownership, but there also seems to be stickiness for people to remain with CNG. Although a large number of factors such as the capital cost of the vehicle, price of the fuel, availability and perceived issues with the fuel, relative efficiencies of the fuel, etc. are considered by the consumer before buying a car with a particular fuel type, this particular study focused on understanding how consumer choices would change with changing relative prices of fuels. Conventional logic would suggest that with increasing relative price of a particular fuel there would be an increasing shift of consumers from that fuel to other relatively cheaper fuel, everything else held constant. A change in such a choice has large impacts on the volumes of consumption of particular fuel types and the resulting energy volumes which in turn impacts the levels of emissions from the passenger car segment. The increasing levels of motorization have large implications on the energy security of the country given the large percentage of the petroleum imported to drive mobility in India. Given the stated objective of the study, the following section documents the potential impacts that changing relative prices of fuels driving cars in India would have on the overall demands and shares of energy use of fuels in India.
251 5.Impacts of changes in relative fuel prices on energy consumption by cars As elaborated above, the change in the consumer s choice of vehicle fuel type due to changing fuel prices could have large impacts on the overall energy used and fuel consumed by cars in India. To understand the magnitude of such changes and establish a link between fuel price change and energy shares in the overall economy, a set of scenarios linked to relative fuel price changes were established. Based on the potential car buyer s primary choice of fuel, they were asked a set of questions related to changing relative price of that fuel. A change in their decision to buy a particular car fuel type over another due to such changes in relative fuel price changes was captured through the survey as explained in the section above. For the purpose of the modelling exercise, to assess the potential impacts of such a changing decision, it was assumed that the relative price variation would come into effect as of The impact of the changing decision, as a result of that relative price change is examined thereafter for a period of ten years, from to This section outlines the potential impacts that such changes in consumer choices from changing relative fuel prices might have on the overall shares and volumes of energy used in India. The most critical and overarching assumption for this exercise is that the respondents from Gujarat are representative of that of India. Although there is a large variation in the nature of respondents between Gujarat and other parts of India, this assumption has been made in the absence of broader, national level survey data. However, there is merit in reviewing these results even with this broad assumption. Gujarat offers almost a level playing field for diesel, petrol and CNG fuels with abundant infrastructure and fuel availability, and the consumer responses when considered for India also means that this is a scenario under which all these fuels are also easily accessible across the country. A business-as-usual (BAU) scenario is drawn up based on the assumptions outlined in the sections above. The BAU scenario assumes that there is no significant variation in the relative fuel prices through the entire duration of the modelling exercise and this forms the baseline scenario against which all the other relative fuel price change scenarios are compared. There are a total of nine, relative fuel price change scenarios modelled as part of this study. There are three scenarios for each of the three primary fuel types of petrol, diesel and CNG. The Scenarios 1.1, 1.2 and 1.3 focuses on finding out what would be the result if there is an increase in the relative prices of petrol compared to diesel. All other relative fuel prices are assumed to remain unchanged. The Scenarios 2.1, 2.2 and 2.3, similarly focus on the relative price of diesel as compared to that of petrol assuming the relative fuel prices of all other fuels to remain the same. The final set of scenarios, 3.1, 3.2 and 3.3 focus on understanding the impact that an increasing relative price of CNG might have on people s choices, and the subsequent fuel-wise energy use. The results from this modelling exercise are reported in the sections below.
252 Business-as-usual scenario: Defining the baseline The BAU scenario assumes that there is no significant change in the relative prices of the various automotive fuels through the entire duration of the modelling exercise. The share of different fuel types in the stock of vehicles are assumed to change as per the historic trends as already assumed in the TERI Transport Demand Model. Figure 6 Changing shares passenger car fuel types under the BAU scenario BAU: Changing shares of passenger car fuel types 2% 0% 3% 3% 0% 3% 3% 0% 3% 2% 0% 4% 2% 0% 36% 35% 32% 30% 28% Electric LPG CNG 60% 60% 62% 64% 66% Diesel Petrol Under this scenario, there is a gradual increase in the share of petrol cars in the total vehicle stock from about 60% in to 66% in Simultaneously the share of diesel cars in the total stock of vehicles decline from 36% in to 28% in Consequently, the energy used by petrol cars as a share of the total energy used by all cars increase from 55% in to 62% by The share of energy consumed by diesel cars decreases through the entire horizon period from 42% in to 34% in The share of alternate fuels remains very low in BAU. Table 1 Impact on energy consumption by fuel type under the BAU scenario Energy consumption (TJ) BAU Petrol 194, , , ,496 1,170,822 Diesel 148, , , , ,493 CNG 4,509 9,988 18,330 30,870 46,514 Total C&J* 352, , ,729 1,405,030 1,890,400 *Total energy includes energy consumed by other vehicles like LPG and electric Energy consumption by petrol vehicles increase by almost 6 times between and and the consumption of diesel increase by about 4 times. There is also a
253 significant increase in the CNG consumption levels, but the absolute volumes of energy used by CNG vehicles still remains much lower than conventional fuels like petrol and diesel. Scenario 1.1: If the price of petrol was to become 25% more than diesel In Scenario 1.1, the survey respondents whose primary choice of fuel was petrol were asked about their decision to buy a petrol car if petrol prices became 25% higher than diesel. Most of the respondents (55%) revealed that they would not change their purchase decision of buying petrol cars. For the rest 43% who would change their decision of buying petrol car, about 50% would shift to CNG vehicles followed by LPG (25%) and diesel (20%). Figure 7 Scenario 1.1: User response if petrol prices became 25% higher than diesel User response if petrol prices became 25% higher than diesel 2% 43% 55% No response Wont switch Consider switching Figure 8 Scenario 1.1: Resulting choices of vehicle fuel types if petrol prices became 25% higher than diesel If petrol prices became 25% higher than diesel - what would be the choice of fuel? 3% 2% 20% 25% 50% No response CNG Diesel Electric LPG
254 Figure 9 Scenario 1.1: Changing shares of passenger car fuel types Scenario 1.1: Changing shares of passenger car fuel types 2% 0% 3% 3% 0% 4% 0% 4% 5% 0% 6% 0% 9% 12% 36% 35% 33% 32% 31% Electric LPG CNG 60% 60% 59% 53% 50% Diesel Petrol Figure 10 Scenario 1.1: Shares of energy used by different fuels in 2011, 2021 and 2031 Scenario 1.1: Shares of energy of different fuels 2011/2021/31 8% 4% 0% 3% 3% 0% 1% 2% 0% Petrol 39% 42% 39% 49% 55% 55% Diesel CNG LPG Electric Because of the shift of prospective petrol car buyers to other fuel cars under this scenario, the share of petrol vehicles is expected to go down to 50% by from 60% of vehicle stock in The shift or declining share of petrol vehicles is captured by CNG and LPG vehicles.

255 Table 2 Scenario 1.1: Impact on energy consumption by fuel type Energy consumption (TJ) % change from BAU levels Scenario Petrol 319, , , ,131 0% -4% -16% -23% Diesel 234, , , ,775 0% 1% 7% 11% CNG 9,988 25,226 80, ,944 0% 38% 160% 205% Total C&J* 575, ,310 1,380,535 1,843,092 0% 0% -2% -3% *Total energy includes energy consumed by other vehicles like LPG and electric When seen from the point of view of energy consumption, this scenario results in a 23% reduction in energy consumption by petrol cars and an increase of about 11% diesel consumption from the BAU levels. Energy consumption from CNG increases by about 3 times of that of the BAU levels given the higher acceptance of the fuel as explained above. Scenario 1.2: If the price of petrol was to increase further to 35% the price of diesel Scenario 1.2 explored the effects of a 35% increase in petrol prices as compared to the price of diesel in consumer s decision to buy a petrol vehicle. Given this condition, about 86% of the people who were considering buying petrol changed their decision and 74% of them said they were willing to change their choice to CNG and 15% to LPG. Figure 11 Scenario 1.2: User response if petrol prices became 35% higher than diesel User response if petrol prices became 35% higher than diesel 6% 8% No response Wont switch 86% Will consider switching
256 Figure 12 Scenario 1.2: Resulting choices of vehicle fuel types if petrol prices became 35% higher than diesel If petrol prices became 35% higher than diesel - what would be the choice of fuel? 7% 4% 15% No response LPG 74% CNG Diesel Figure 13 Scenario 1.2: Changing shares of passenger car fuel types Scenario 1.2: Changing shares of passenger car fuel types 2% 0% 3% 3% 0% 4% 0% 1% 1% 6% 7% 9% 18% 36% 35% 26% 33% Electric 33% 33% LPG CNG 60% 60% 56% 40% 31% Diesel Petrol
257 Figure 14 Scenario 1.2: Shares of energy used by different fuels in 2011, 2021 and 2031 Scenario 1.2: Shares of energy of different fuels 2011/2021/ % 7% 0% 4% 3% 0% 1% 2% 0% 34% Petrol 42% 40% 55% 53% Diesel CNG LPG Electric 42% Due to the increase in petrol price in Scenario 1.2 as compared to Scenario 1.1, there would be further decline in the share of petrol vehicles in the total vehicle fleet. This would result in a drastic reduction in the consumption of petrol by almost 50% of the BAU levels by This declining volume of petrol based energy would be compensated by a 15% increase in the diesel volumes of the BAU levels. The share of diesel use however, is estimated to remain almost constant through the entire period under this scenario. The CNG based energy volumes for cars and jeeps are estimated to increase by about 6 times the BAU levels of under this scenario. Table 3 Scenario 1.2: Impact on energy consumption by fuel type Energy consumption (TJ) % change from BAU levels Scenario Petrol 319, , , ,476 0% -8% -35% -49% Diesel 234, , , ,148 0% 2% 10% 15% CNG 9,988 36, , ,917 0% 98% 418% 536% Total C&J* 575, ,169 1,336,529 1,758,101 0% -1% -5% -7% *Total energy includes energy consumed by other vehicles like LPG and electric Scenario 1.3: If the price of petrol became 50% higher than the price of diesel In Scenario 1.3, the respondents were asked about their decision to buy a petrol car, if petrol prices were further increased to 50% the price of diesel. The possibility of high running costs, given the high price of petrol, meant that only a handful of the
258 respondents (6 people) who were initially planning to buy a petrol car declared that they would stick to purchasing a petrol car. The remaining respondents said they would shift to other fuel cars such as CNG, LPG and to some extent electric vehicles. Figure 15 Scenario 1.3: User response if petrol prices became 50% higher than diesel User response if petrol prices became 50% higher than diesel 40% Wont switch 60% Will consider switching Figure 16 Scenario 1.3: Resulting choices of vehicle fuel types if petrol prices became 50% higher than diesel If petrol prices became 50% higher than diesel - what would be the choice of fuel? 25% 25% 50% CNG Diesel Electric
259 Figure 17 Scenario 1.3: Changing shares of passenger car fuel types Scenario 1.3: Changing shares of passenger car fuel types 2% 0% 3% 3% 0% 4% 0% 1% 2% 6% 7% 9% 19% 36% 35% 27% 33% Electric 60% 60% 56% 34% 40% 33% 30% LPG CNG Diesel Petrol Figure 18 Scenario 1.3: Shares of energy used by different fuels in 2011, 2021 and 2031 Scenario 1.3: Shares of energy of different fuels 2011/2021/31 7% 0% 4% 3% 0% 1% 2% 0% 17% 33% Petrol 42% 40% 55% 53% Diesel CNG LPG Electric 43% This extreme case of petrol fuel price increase with respect to diesel would make people aggressively switch to CNG as can been seen in the figure above. CNG vehicles would consume about 18% of the energy by as compared to 2% in LPG vehicles would make up to 7% of the total energy consumed by the vehicle fleet in This extreme scenario would also see a small percentage of energy consumption by electric vehicles in the total vehicle fleet of cars by
260 Table 4 Scenario 1.3: Impact on energy consumption by fuel type Energy consumption (TJ) % change from BAU levels Scenario Petrol 319, , , ,630 0% -8% -37% -51% Diesel 234, , , ,688 0% 2% 10% 16% CNG 9,988 36, , ,977 0% 101% 428% 549% Total C&J* 575, ,215 1,329,860 1,745,455 0% -1% -5% -8% *Total energy includes energy consumed by other vehicles like LPG and electric Scenario 2.1: If the price of diesel increased to as much as petrol In Scenario 2.1, survey respondents whose primary fuel choice was diesel were asked whether they would still buy a diesel vehicle if the diesel price became equal to petrol. Most of the respondents (54%) revealed that they would not change their decision to buy a diesel vehicle. Among the rest of the respondents who expressed interest to change their choice of diesel car, over 60% would opt to buy a CNG car and only about 19% of them said they would buy a petrol car. Figure 19 Scenario 2.1: User response if diesel prices became as high as petrol prices User response if diesel prices became as high as petrol prices 4% 42% No response 54% Wont switch Consider switching
261 Figure 20 Scenario 2.1: Resulting choices of vehicle fuel types if diesel prices became as high as petrol If diesel prices became as high as petrol - what would be the choice of fuel? 2% 19% 18% 61% No response CNG LPG Petrol Figure 21 Scenario 2.1: Changing shares of passenger car fuel types Scenario 2.1: Changing shares of passenger car fuel types 2% 0% 3% 3% 0% 3% 0% 3% 0% 3% 0% 4% 6% 7% 36% 35% 31% 26% 22% Electric LPG 60% 60% 62% 65% 67% CNG Diesel Petrol Figure 22 Scenario 2.1: Shares of energy used by different fuels in 2011, 2021 and 2031 Scenario 2.1: Shares of energy of different fuels 2011/2021/31 5% 2% 0% 2% 2% 0% 1% 2% 0% Petrol 29% 38% 42% 55% 58% 64% Diesel CNG LPG Electric
262 With the increase in diesel prices and the prospective diesel car buyers moving to other fuel choices, the share of diesel vehicles would continuously decline through the years diesel consumption will drop by 18% of the BAU levels of that year under this scenario. With respondents moving primarily to CNG, levels of CNG consumption under this scenario will almost become double that of BAU levels. There will be only a marginal increase in the levels of petrol consumption. Table 5 Scenario 2.1: Impact on energy consumption by fuel type Energy consumption (TJ) % change from BAU levels Scenario Petrol 319, , ,773 1,187,573 0% 0% 1% 1% Diesel 234, , , ,867 0% -3% -13% -18% CNG 9,988 21,648 52,925 86,336 0% 18% 71% 86% Total C&J* 575, ,851 1,379,258 1,843,867 0% 0% -2% -2% *Total energy includes energy consumed by other vehicles like LPG and electric Scenario 2.2: If the price of diesel became 20% more than petrol prices Scenario 2.2 looked into the consumer s perception and behaviour in a situation where the diesel prices became 20% more than petrol. Of the respondents whose primary choice of fuel was diesel, about 80% of the respondents wanted to switch to other fuel cars such as CNG (67%), LPG (16%) and petrol (12%) under this scenario. Figure 23 Scenario 2.2: User response if diesel prices became 20% more than petrol User response if diesel prices became 20% more than petrol 1% 20% No response Wont switch 79% Will consider switching
263 Figure 24 Scenario 2.2: Resulting choices of vehicle fuel types if diesel prices became 20% more than petrol User response if diesel prices became 20% more than petrol 1% 16% 12% 4% No response CNG 67% LPG Electric Petrol Figure 25 Scenario 2.2: Shares of energy used by different fuels in 2011, 2021 and 2031 Shares of energy of different fuels 2011/2021/31 2% 1% 0% 2% 2% 0% 1% 2% 0% Petrol 35% 39% 42% 55% 57% 62% Diesel CNG LPG Electric Figure 26 Scenario 2.2: Changing shares of passenger cars fuel types Scenario 2.2: Changing shares of passenger car fuel types 2% 0% 3% 3% 0% 3% 0% 4% 0% 4% 0% 4% 9% 12% 36% 35% 30% 22% 16% Electric LPG 60% 60% 62% 65% 68% CNG Diesel Petrol
264 Given that only a handful of the respondents (12%) would shift to petrol cars, there would be hardly any increase in petrol consumption under this scenario. Consumers would prefer to move towards CNG instead of diesel and petrol and the share of energy consumed by CNG vehicles total vehicle fleet would increase to about 12%. Table 6 Scenario 2.2: Impact on energy consumption by fuel type Energy consumption (TJ) % change from BAU levels Scenario Petrol 319, , ,658 1,200,003 0% 0% 2% 2% Diesel 234, , , ,509 0% -6% -27% -38% CNG 9,988 25,690 79, ,841 0% 40% 158% 190% Total C&J* 575, ,473 1,350,157 1,791,323 0% -1% -4% -5% *Total energy includes energy consumed by other vehicles like LPG and electric In terms of absolute numbers, the volumes of energy due to CNG consumption by would be about 3 times under this scenario as compared to BAU. Energy consumed due to diesel use would decrease by almost 40% of the BAU levels of given the increasing prices of the fuel. Scenario 2.3: If the price of diesel became 50% more than petrol prices Scenario 2.3 is an extreme high price scenario for diesel, with diesel prices assumed to become 50% higher than petrol. Of the respondents whose primary choice of fuel was diesel, about 80% said that they considered switching from a diesel car to other fuel choices. Almost everyone (86%) who said they would change their choice would choose to shift to CNG and the remaining would shift to petrol (14%). Figure 27 Scenario 2.3: User response if diesel prices became 50% more than petrol User response if diesel prices became 50% more than petrol 22% Wont switch 78% Will consider switching
265 Figure 28 Scenario 2.3: Resulting choices of vehicle fuel types if diesel prices became 50% higher than petrol If diesel prices became 50% higher than petrol - what would be the choice of fuel? 14% CNG 86% Petrol Figure 29 Scenario 2.3: Changing shares of passenger cars fuel types Scenario 2.3: Changing shares of passenger car fuel types 2% 0% 3% 3% 0% 3% 0% 4% 0% 4% 0% 4% 9% 12% 36% 35% 30% 21% 15% Electric LPG 60% 60% 62% 66% 69% CNG Diesel Petrol Figure 30 Scenario 2.3: Shares of energy used by different fuels in 2011, 2021 and 2031 Scenario 2.3: Shares of energy of different fuels 2011/2021/31 3% 0% 8% 3% 3% 0% 1% 2% 0% Petrol 21% Diesel 36% 42% 55% CNG 58% LPG 68% Electric
266 Under the extreme case of Scenario 2.3, there is an increasing shift of users from diesel cars to CNG cars due to the relative increase in diesel prices. From about 42% of the energy consumption in , diesel based energy use would constitute only 20% of the energy share by The declining share of diesel based energy use is compensated by an increase in the consumption of CNG. The share of energy consumption by CNG cars would go up from just 2% in to about 8% in Table 7 Scenario 2.3: Impact on energy consumption by fuel type Energy consumption (TJ) % change from BAU levels Scenario Petrol 319, , ,125 1,200,810 0% 0% 2% 3% Diesel 234, , , ,390 0% -6% -30% -42% CNG 9,988 25,997 81, ,207 0% 42% 165% 197% Total C&J* 575, ,428 1,336,448 1,766,378 0% -1% -5% -7% *Total energy includes energy consumed by other vehicles like LPG and electric Scenario 3.1: If the price of CNG became as much as diesel In Scenario 3.1, respondents whose primary choice of fuel was CNG were asked if there would be any change in their choices if CNG prices became as much as diesel. About 44% of the respondents said that they would want to switch to another fuel in this scenario. Of those who would switch, 74% would shift to diesel vehicles and 20% to LPG. There were not many respondents who opted for petrol vehicles since it was the costliest of all the fuels. Figure 31 Scenario 3.1: User response if CNG prices became as much as diesel User response if CNG prices became as much as diesel 6% 50% 44% No response Wont switch Consider switching

267 Figure 32 Scenario 3.1: Resulting choices of vehicle fuel types if CNG prices became as high as diesel 3% If CNG prices became as high as diesel - what would be the choice of fuel? 20% 2% 1% No response Diesel 74% Electric LPG Petrol Figure 33 Scenario 3.1: Changing shares of passenger car fuel types Scenario 3.1: Changing shares of passenger car fuel types 2% 0% 3% 3% 0% 3% 3% 0% 3% 0% 3% 2% 0% 36% 35% 32% 31% 29% Electric LPG 60% 60% 62% 64% 66% CNG Diesel Petrol
268 Figure 34 Scenario 3.1: Shares of energy used by different fuels in 2011, 2021 and 2031 Scenario 3.1: Shares of energy of different fuels 2011/2021/31 2% 1% 0% 2% 2% 0% 1% 2% 0% Petrol 35% Diesel 39% 42% 55% CNG 57% LPG 62% Electric Under this scenario, the share of CNG cars is expected to decline marginally but will contribute to almost 3% of the passenger cars in the vehicle fleet. Diesel will substitute CNG use and the share of diesel vehicles and petrol vehicles will become will become 29% and 66% of the vehicle stock respectively by However, since the base level of CNG cars are a small share of the overall stock of vehicles, there is expected to be only a marginal increase in the diesel consumption levels due to a shift from potential CNG users. Table 8 Scenario 3.1: Impact on energy consumption by fuel type Energy consumption (TJ) % change from BAU levels Scenario Petrol 319, , ,682 1,171,220 0% 0% 0% 0% Diesel 234, , , ,442 0% 0% 2% 3% CNG 9,988 17,626 24,426 32,697 0% -4% -21% -30% Total C&J* 575, ,174 1,409,101 1,899,131 0% 0% 0% 0% *Total energy includes energy consumed by other vehicles like LPG and electric Diesel based energy consumption would increase marginally by 3% under this scenario as compared to BAU levels in There would almost be no change in the consumption of energy by petrol use over the BAU levels as seen in the table above.
269 Scenario 3.2: If the price of CNG became as much as petrol Under the Scenario 3.2, respondents whose primary fuel choice was CNG were asked if they would change their choice if the price of CNG was to increase to as much as petrol prices. About 58% of the respondents revealed that they would change their decision of buying a CNG car. 71% of those changing their choice would want to shift to diesel. Figure 35 Scenario 3.2: User response if CNG prices became as much as petrol User response if CNG prices became as much as petrol 42% Wont switch 58% Will consider switching Figure 36 Scenario 3.2: Resulting choices of vehicle fuel types if CNG prices became as much as petrol If CNG prices became as much as petrol - what would be the choice of fuel? 8% 9% 6% 6% No response Diesel 71% Electric LPG Petrol
270 Figure 37 Scenario 3.2: Changing shares of passenger car fuel types Scenario 3.2: Changing shares of passenger car fuel types 2% 0% 3% 3% 0% 3% 3% 0% 2% 3% 0% 2% 0% 36% 35% 32% 31% 30% Electric LPG 60% 60% 62% 64% 66% CNG Diesel Petrol Figure 38 Scenario 3.2: Shares of energy used by different fuels in 2011, 2021 and 2031 Scenario 3.2: Shares of energy of different fuels 2011/2021/31 1% 2% 0% 2% 2% 0% 1% 2% 0% Petrol 35% Diesel 39% 42% 55% CNG 57% 62% LPG Electric The modelling results of Scenario 3.2 show that there is hardly any change in petrol consumption and the diesel consumption increases marginally under this scenario over the BAU scenario levels of CNG based energy consumption by cars would almost be halved that of BAU levels of CNG vehicles would contribute to about 2% and diesel vehicles would constitute about 30% of the total energy consumed by the passenger car fleet in
271 Table 9 Scenario 3.2: Impact on energy consumption by fuel type Energy consumption (TJ) % change from BAU levels Scenario Petrol 319, , ,006 1,171,914 0% 0% 0% 0% Diesel 234, , , ,320 0% 0% 3% 5% CNG 9,988 17,224 20,752 24,818 0% -6% -33% -47% Total C&J* 575, ,407 1,411,237 1,903,709 0% 0% 0% 1% *Total energy includes energy consumed by other vehicles like LPG and electric Scenario 3.3: If the price of CNG became 25% more than that of petrol Scenario 3.3 represents the high price scenario for CNG. In this scenario it is assumed that CNG prices would became 25% higher than petrol. About 75% the respondents whose primary fuel choice was CNG said that they would change their choice and buy a car of different fuel type. A small percentage of the respondents said that they would still prefer to buy a CNG car. Most of those changing their choice would buy a diesel car (62%) or LPG car (24%). Only 3% of the respondents said that they will buy a petrol car. Figure 39 Scenario 3.3: User response if CNG prices became 25% more than petrol User response if CNG prices became 25% more than petrol 24% Wont switch 76% Will consider switching
272 Figure 40 Scenario 3.3: Resulting choices of vehicle fuel types if CNG prices became 25% higher than petrol If CNG prices became 25% higher than petrol - what would be the choice of fuel? 3% 4% 7% 24% No response Electric 62% LPG Diesel Petrol Figure 41 Scenario 3.3: Changing shares of passenger car fuel types Scenario 3.3: Changing shares of passenger car fuel types 2% 0% 3% 3% 0% 3% 3% 0% 2% 3% 0% 2% 0% 36% 35% 32% 31% 30% Electric LPG 60% 60% 62% 64% 67% CNG Diesel Petrol Figure 42 Scenario 3.3: Shares of energy used by different fuels in 2011, 2021 and 2031 Scenario 3.3: Shares of energy of different fuels 2011/2021/31 1% 1% 0% 2% 2% 0% 1% 2% 0% Petrol 36% Diesel 39% 42% 55% CNG 57% 62% LPG Electric
273 This extreme case under which CNG prices go up significantly, will lead people to shift to diesel and LPG cars. As the number of CNG vehicle users come down, there will be a distinct decline in the share of energy used by CNG vehicles and consequent increase in other fuel choice cars. Diesel based energy consumption under this scenario is expected to go up by 5% that of BAU levels of There would hardly be any change in petrol consumption under this scenario. Table 10 Scenario 3.3: Impact on energy consumption by fuel type Energy consumption (TJ) % change from BAU levels Scenario Petrol 319, , ,010 1,171,925 0% 0% 0% 0% Diesel 234, , , ,569 0% 0% 3% 5% CNG 9,988 16,988 18,598 20,199 0% -7% -40% -57% Total C&J* 575, ,183 1,409,215 1,899,412 0% 0% 0% 0% *Total energy includes energy consumed by other vehicles like LPG and electric
274 6. Conclusion The study based on primary surveys and related scenario modelling clearly helps in strengthening conventional wisdom about the Indian automobile consumer. They are extremely price sensitive to the price of fuel when they make their choice of vehicle fuel types. Given that a large share of the cars in the stock by are yet to be added to the fleet, appropriate fuel pricing strategies could easily determine the eventual mix of vehicle technologies in the country. The analysis has also shown that prices remaining equal, there is also a clear preference for the consumer to opt for clean fuel vehicles. With the right price incentives in place, this gives the country a large opportunity to move towards cleaner fuels over the next decade. The relative fuel price change scenarios also show that there is no significant decline in the aggregate energy demand by cars due to the movement from one fuel type to the other. However there is a clear decline in the consumption of the fuel which becomes relatively dearer. Such a phenomenon could help in directing policies to increase the diversity and mix of the fuel basket used to drive automobiles in the country. Large reductions in the consumption of petroleum products such as petrol and diesel are possible with the right pricing for alternate fuels such as CNG. This is particularly important from the point of view of the energy security issues of the country. With continually fluctuating international prices of crude, the prices that India, a large net importer of crude, pays for its energy is always uncertain. A diversified fuel basket could help in mitigating some of the risks associated with such random price fluctuations. The study does not however through up much savings in energy consumption across the various scenarios considered. This is because the different scenarios deal primarily with the relative fuel price changes of the conventionally used and already prevalent technologies such as petrol, diesel and CNG. Scenarios involving a shift to other new and upcoming, much higher efficiency technologies such as hybrid and electric vehicles have the potentials to significantly reduce the energy consumption levels of passenger cars. The study has however given direction with regards to the volumes of energy that might be required if a certain relative fuel price level is achieved. Increasing or decreasing volumes of energy demand from a particular fuel type would also mean an increase or decrease in the infrastructure related to its delivery. While petroleum products like diesel and petrol have similar delivery channels, natural gas and liquefied petroleum gas need dedicated infrastructure. Therefore appropriate infrastructure might need to be put in place before embarking on a fuel pricing strategy to reap the best benefits of the strategy.
275 Bibliography Chaudhuri, Y. (2014, November 24). DNA India. Retrieved February 02, 2015, from DNA: Deoras, N. P. (2014, September 21). Why diesel cars still make sense. ET Bureau. (2014, November 27). Diesel car sales up 16% in 2014 over 2010: JD Power. Retrieved February 1, 2015, from Ghate, A. T., & Sundar, S. (2013). Can we reduce the rate of growth of car ownership? Economic and Political Weekly, GoI. (2011). Census of India, New Delhi: Ministry of Home Affairs, Government of India. KPMG. (2013). Global Automotive Retail Market - From selling cars on the spot to centrally managing the retail grid. Global: KPMG. NDTV. (2014, September 16). Buying a Car? Advantage Petrol, Says Crisil. New Delhi, Delhi, India. NRI. (2014). Sensitivity analysis of the impacts of diesel subsidy reduction in transport sector in India. Energy Efficiency Working Group under Japan-India Energy Dialogue (p. 9). New Delhi: Nomura Research Institute. PFI. (2007). The Future Population of India - Population Reference Bureau. New Delhi: Pupulation Foundation of India. Planning Commission. (2013). 12th Five Year Plan. New Delhi: Planning Commission. Planning Commission. (2014, March 03). IESS2047. Retrieved February 02, 2015, from India Energy Security Scenarios 2047: Roychowdhury, A. (2010). CNG programme in India: The future challenges. Retrieved February 02, 2015, from Center for Science and Environment - Factsheet series: Thakkar, K., & Shyam, A. (2015, January 28). The Economic Times. Retrieved February 02, 2015, from Auto News:
276 Appendix Appendix 1: Survey questions related to energy use 4 If your vehicles or planned to be bought in the near future Is petrol, then go to Q no Is diesel, then go to Q no Is CNG, then go to Q no On an average a diesel car costs about Rs. 1 lakh more than the equivalent petrol car variant while petrol prices are about 14% higher than diesel prices.1. If price differential between petrol and diesel were to increase (with petrol becoming more expensive than diesel) and other fuels remaining at the same price difference as of today, then what would be the impact on your choice of car fuel technology under the following situations: 1. Petrol prices become 25% higher than diesel prices a. Will still surely choose a petrol car b. Might reconsider the petrol car c. Re-consider buying some other fuel car d. Will surely choose some other fuel car 2. If response is either c or d, then what would be the alternate vehicle fuel choice be? a. Diesel b. CNG c. LPG d. Electric If response is either c or d, go to Question No. 4.4, else continue. 3. Petrol prices become 35% higher than diesel prices a. Will still surely choose a petrol car b. Might reconsider the petrol car c. Re-consider buying some other fuel car d. Will surely choose some other fuel car 4. If response is either c or d, then what would be the alternate vehicle fuel choice be? a. Diesel b. CNG c. LPG d. Electric If response is either c or d, go to Question No. 4.4, else continue. 5. Petrol prices become 50% higher than diesel prices a. Will still surely choose a petrol car b. Might reconsider the petrol car c. Re-consider buying some other fuel car d. Will surely choose some other fuel car 1 In Gandhi Nagar - Petrol(Rs.67.75/lt) and HSD prices (Rs.59.42/lt) as applicable From Midnight: October, November, , as reported in and on 3rd November, 2014.
277 6. If response is either c or d, then what would be the alternate vehicle fuel choice be? a. Diesel b. CNG c. LPG d. Electric If response is either c or d, go to Question No. 4.4, else continue. Go to Q. no On an average a diesel car costs about Rs. 1 lakh more than the equivalent petrol car variant while diesel prices are about 14% lower than petrol prices2. If price differential between diesel and petrol were to invert (with diesel becoming more expensive than petrol) and other fuels remaining at the same pr i ce difference as of today, then what would be the impact on your choice of car fuel technology under the following situations: 1. Diesel prices become as much as petrol prices a. Will still surely choose a diesel car b. Might reconsider the diesel car c. Might consider buying some other fuel car d. Will surely choose some other fuel car 2. If response is either c or d, then what would be the alternate vehicle fuel choice be? a. Petrol b. CNG c. LPG d. Electric If response is either c or d, go to Question No. 4.4, else continue. 3. Diesel prices become 20% more than petrol prices a. Will still surely choose a diesel car b. Might reconsider the diesel car c. Might consider buying some other fuel car d. Will surely choose some other fuel car 4. If response is either c or d, then what would be the alternate vehicle fuel choice be? a. Petrol b. CNG c. LPG d. Electric If response is either c or d, go to Question No. 4.4, else continue. 5. Diesel prices become 50% more than petrol prices a. Will still surely choose a diesel car b. Might reconsider the diesel car c. Might consider buying some other fuel car d. Will surely choose some other fuel car 2 In Gandhi Nagar - Petrol(Rs.67.75/lt) and HSD prices (Rs.59.42/lt) as applicable From Midnight: October, November, , as reported in and on 3rd November, 2014.
278 6. If response is either c or d, then what would be the alternate vehicle fuel choice be? a. Petrol b. CNG c. LPG d. Electric If response is either c or d, go to Question No. 4.4, else continue. 7. If the same model and car make chosen was made available in a CNG variant and at the same price with CNG made adequately available, would you consider buying it instead? Yes/No e. If no, then why not? Go to Q. no On an average a CNG car costs about Rs. 50,000 more3 than the equivalent petrol car variant. However, its running cost is almost half that of petrol per kilometer.4if the price of CNG increased with other fuels remaining at the same price difference as of today then what would be the impact on your choice of car fuel technology under the following situations: 1. CNG prices become as much as diesel prices a. Will still surely choose a CNG car b. Might reconsider the CNG car c. Might consider buying some other fuel car d. Will surely choose some other fuel car 2. If response is either c or d, then what would be the alternate vehicle fuel choice be? a. Petrol b. Diesel c. LPG d. Electric If response is either c or d, go to Question No. 4.4, else continue. 3. CNG prices become as much as petrol prices a. Will still surely choose a diesel car b. Might reconsider the CNG car c. Might consider buying some other fuel car d. Will surely choose some other fuel car 4. If response is either c or d, then what would be the alternate vehicle fuel choice be? a. Petrol b. Diesel c. LPG d. Electric 5. CNG prices become 25% more than petrol prices a. Will still surely choose a CNG car 3 Based on average Wagon R prices across different models as on 3 rd November, 2014 from Price.aspx?ModelCode=WM&State=GJ&City=2B#ContentPlaceHolder1_dvlink 4 Petrol versus CNG cost comparisons as available at: on 3rd November, 2014
279 b. Might reconsider the CNG car c. Might consider buying some other fuel car d. Will surely choose some other fuel car 6. If response is either c or d, then what would be the alternate vehicle fuel choice be? a. Petrol b. Diesel c. LPG d. Electric If response is either c or d, go to Question No. 4.4, else continue. Go to Q. no If an electric variant of the same car that you are buying today was made available to you at the same price along with adequate public charging facilities, would you consider buying it instead? Yes/No If not, then why so?
280 Appendix 2: A brief note about the TERI transport demand model The TERI Transport Model The TERI Transport Demand Model estimates the total domestic demand for both passenger and freight transport and the resulting fuel and energy used in India using a bottom up methodology. Starting from the base of total registered vehicles of different vehicle classes in India across different modes, the model estimates the total transport demand by assigning various utilization and occupancy rates to each vehicle type. The forecasts of various transport modes are based on the economic and population growth rates of the economy. The extended transport demand model considers the following modes of transport: 1. Motorized road transport 2. Railways 3. Aviation The model further considers several other sub-modes under each of these modes. 1. Motorized road transport Motorized road transport modes are broken up into two kinds: Passenger and Freight. Within the class of passenger vehicles three kinds are considered private vehicles (two wheelers and cars and jeeps), intermediate vehicles (taxis and three wheelers) and public vehicles (buses). Freight transport is assumed to have two categories (HCVs and LCVs). Each of these modes is further segregated into the various technologies they use based on their fuel types. The complete breakdown by vehicle type and technology are shown below. Service type Vehicle type Technology choice Passenger Two wheeler Petrol Freight Cars and Jeeps Taxis Three wheelers Bus (including omni-bus) Heavy commercial vehicles (HCV) Light commercial vehicles (LCV) Electric Petrol Diesel LPG CNG Electric Petrol Diesel LPG CNG Petrol Diesel LPG CNG Diesel CNG Diesel Diesel
281 2. Railways Like road transport, rail traffic is segregated into two parts based on the type of service offered, i.e. passenger and freight. Further, these two railway services are split into the type of traction used i.e. electric and diesel traction. While the passenger traffic growth on railways is assumed to be a function of per capita GDP the freight traffic growth on railways is assumed to be a function of GDP of industry and agriculture combined. Service type Traction type Passenger Electric Diesel Freight Electric Diesel 3. Civil Aviation The model considers both passenger and freight transported by domestic Civil Aviation in India. Drawing from the actual passenger and freight kilometres performed by the Civil Aviation sector in India the model estimates future traffic on air based on the economic growth of the country. However, for the present sensitivity study the model focuses only on the cars and jeeps submode everything else held ceteris paribus. For the road transport sector in particular, the model uses a bottom up approach to estimate the total transport demand and resulting energy used by the sector. Starting from the total stock of registered vehicles of different kinds, such as buses, cars and jeeps, two-wheelers, taxis, three-wheelers and heavy and light commercial vehicles, the model is used to estimate the total transport demand by using appropriate utilization rates and occupancy factors. Given that population and economic growth rates are assumed to be the primary input drivers of transport demand, data from the previous three-decades is regressed to estimate future transport demands in India. However, for the purpose of the present study which focuses only on the fuel and energy consumption of the vehicle category of cars and jeeps, the utilization, occupancy and fuel-technology share parameters for all other vehicle classes are assumed to remain unaltered in the model. The various scenarios such as removal of diesel subsidies, introduction of vehicle efficiency norms and increased penetration of electric vehicles are assumed to impact only the percentage shares and penetrations and energy efficiencies of various fuel-technology types in the mix of cars and jeeps. These scenarios are built based on a few broad macro assumptions of population and economic growth.

282
資料1:地球温暖化対策基本法案(環境大臣案の概要)
") 地球温暖化対策基本法案 ( 環境大臣案の概要 ) 平成 22 年 2 月 環境省において検討途上の案の概要であり 各方面の意見を受け 今後 変更があり得る 1 目的この法律は 気候系に対して危険な人為的干渉を及ぼすこととならない水準において大気中の温室効果ガスの濃度を安定化させ地球温暖化を防止すること及び地球温暖化に適応することが人類共通の課題であり すべての主要国が参加する公平なかつ実効性が確保された地球温暖化の防止のための国際的な枠組みの下に地球温暖化の防止に取り組むことが重要であることにかんがみ
地球温暖化対策基本法案 ( 環境大臣案の概要 ) 平成 22 年 2 月 環境省において検討途上の案の概要であり 各方面の意見を受け 今後 変更があり得る 1 目的この法律は 気候系に対して危険な人為的干渉を及ぼすこととならない水準において大気中の温室効果ガスの濃度を安定化させ地球温暖化を防止すること及び地球温暖化に適応することが人類共通の課題であり すべての主要国が参加する公平なかつ実効性が確保された地球温暖化の防止のための国際的な枠組みの下に地球温暖化の防止に取り組むことが重要であることにかんがみ
新車販売台数のシェア 分析の前提条件 燃費 [km/l] 燃料種別新車販売台数のシェアは 自動車産業戦略 の平成 42 年度のシェアに向かって線形に変化し 技術開発等により乗用車販売平均燃費も改善すると仮定 2 この仮定を踏まえつつ 平成 27 年度燃費基準と平成 32 年度燃費基準の
![新車販売台数のシェア 分析の前提条件 燃費 [km/l] 燃料種別新車販売台数のシェアは 自動車産業戦略 の平成 42 年度のシェアに向かって線形に変化し 技術開発等により乗用車販売平均燃費も改善すると仮定 2 この仮定を踏まえつつ 平成 27 年度燃費基準と平成 32 年度燃費基準の](/thumbs/91/106794182.jpg "新車販売台数のシェア 分析の前提条件 燃費 [km/l] 燃料種別新車販売台数のシェアは 自動車産業戦略 の平成 42 年度のシェアに向かって線形に変化し 技術開発等により乗用車販売平均燃費も改善すると仮定 2 この仮定を踏まえつつ 平成 27 年度燃費基準と平成 32 年度燃費基準の") 資料 2 車体課税のグリーン化による環境効果の分析について ( 推計結果 ) 新車販売台数のシェア 分析の前提条件 燃費 [km/l] 燃料種別新車販売台数のシェアは 自動車産業戦略 2014 1 の平成 42 年度のシェアに向かって線形に変化し 技術開発等により乗用車販売平均燃費も改善すると仮定 2 この仮定を踏まえつつ 平成 27 年度燃費基準と平成 32 年度燃費基準の伸び率に基づき 平成 37
資料 2 車体課税のグリーン化による環境効果の分析について ( 推計結果 ) 新車販売台数のシェア 分析の前提条件 燃費 [km/l] 燃料種別新車販売台数のシェアは 自動車産業戦略 2014 1 の平成 42 年度のシェアに向かって線形に変化し 技術開発等により乗用車販売平均燃費も改善すると仮定 2 この仮定を踏まえつつ 平成 27 年度燃費基準と平成 32 年度燃費基準の伸び率に基づき 平成 37
お知らせ
 広報資料 ( 経済同時 ) 平成 27 年 12 月 16 日環境政策局 担当 : 地球温暖化対策室電話 :222-4555 事業者排出量削減計画書制度 及び 新車販売実績報告書制度 平成 26 年度実績の取りまとめについて 京都市では, 京都市地球温暖化対策条例 ( 以下 条例 という ) に基づき, 一定規模の温室効果ガスを排出する事業者 ( 特定事業者 ) の自主的な排出量削減を図ることを目的として,
平成20年度税制改正(地方税)要望事項
要望事項") 平成 30 年度地方税制改正 ( 税負担軽減措置等 ) 要望事項 ( 新設 拡充 延長 その他 ) No 5 対象税目 要望項目名 要望内容 ( 概要 ) 府省庁名環境省 個人住民税法人住民税事業税不動産取得税固定資産税事業所税その他 ( 自動車取得税自動車税 軽自動車税 ) 車体課税のグリーン化 自動車取得税のエコカー減税については 平成 29 年度税制改正大綱において 対象範囲を平成 32 年度燃費基準の下で見直し
平成 30 年度地方税制改正 ( 税負担軽減措置等 ) 要望事項 ( 新設 拡充 延長 その他 ) No 5 対象税目 要望項目名 要望内容 ( 概要 ) 府省庁名環境省 個人住民税法人住民税事業税不動産取得税固定資産税事業所税その他 ( 自動車取得税自動車税 軽自動車税 ) 車体課税のグリーン化 自動車取得税のエコカー減税については 平成 29 年度税制改正大綱において 対象範囲を平成 32 年度燃費基準の下で見直し
センタリング
 1990 1991 1992 1993 1994 1995 1996 1997 1998 1999 2000 2001 2002 2003 2004 2005 2006 2007 2008 2009 2010 2011 2012 2013 2014 2015 2016 CH4 排出量 [kt-co2 eq.] 1.A.3.c 鉄道 (Ralways)( CH4, N2O) 1. 排出 吸収源の概要
揮発油税等の当分の間税率とその環境効果 揮発油税の概要 揮発油税及び地方揮発油税の税率は 昭和 49 年度税制改正において税率引上げが行われた際に 暫定的な措置として 租税特別措置法により税率の特例措置が講じられて以来 平成 20 年度改正において平成 30 年 3 月末までの 10 年間の措置とし
 資料 2 揮発油税等の当分の間税率による環境効果の分析について ( 経過報告 ) 揮発油税等の当分の間税率とその環境効果 揮発油税の概要 揮発油税及び地方揮発油税の税率は 昭和 49 年度税制改正において税率引上げが行われた際に 暫定的な措置として 租税特別措置法により税率の特例措置が講じられて以来 平成 20 年度改正において平成 30 年 3 月末までの 10 年間の措置として延長されるまで 累次適用期限が延長されてきた
各資産のリスク 相関の検証 分析に使用した期間 現行のポートフォリオ策定時 :1973 年 ~2003 年 (31 年間 ) 今回 :1973 年 ~2006 年 (34 年間 ) 使用データ 短期資産 : コールレート ( 有担保翌日 ) 年次リターン 国内債券 : NOMURA-BPI 総合指数
 今回 :1973 年 ~2006 年 (34 年間 ) 使用データ 短期資産 : コールレート ( 有担保翌日 ) 年次リターン 国内債券 : NOMURA-BPI 総合指数") 5 : 外国株式 外国債券と同様に円ベースの期待リターン = 円のインフレ率 + 円の実質短期金利 + 現地通貨ベースのリスクプレミアム リスクプレミアムは 過去実績で 7% 程度 但し 3% 程度は PER( 株価 1 株あたり利益 ) の上昇 すなわち株価が割高になったことによるもの 将来予想においては PER 上昇が起こらないものと想定し 7%-3%= 4% と設定 直近の外国株式の現地通貨建てのベンチマークリターンと
5 : 外国株式 外国債券と同様に円ベースの期待リターン = 円のインフレ率 + 円の実質短期金利 + 現地通貨ベースのリスクプレミアム リスクプレミアムは 過去実績で 7% 程度 但し 3% 程度は PER( 株価 1 株あたり利益 ) の上昇 すなわち株価が割高になったことによるもの 将来予想においては PER 上昇が起こらないものと想定し 7%-3%= 4% と設定 直近の外国株式の現地通貨建てのベンチマークリターンと
Microsoft Word - 5_‚æ3ŁÒ.doc
 第 3 編企業行動に関する意識調査 64 Ⅰ. 調査要領 特別アンケート企業行動に関する意識調査結果 2011 年 7 月 調査時期 :2011 年 7 月 1 日 ( 金 ) を期日として実施 調査対象 :2010 2011 2012 年度設備投資計画調査の対象企業 調査名 対象 回答状況 ( 回答率 ) 製造業非製造業 企業行動に関する意識調査 大企業 ( 資本金 10 億円以上 ) 3,302
Microsoft PowerPoint - 【0918】統合版.pptx
 車体課税関係資料 資料 1 車体課税の見直し ( 平成 27 年度税制改正 ) 自動車取得税における エコカー減税 の見直し 平成 32 年度燃費基準への置き換えを行うとともに 平成 32 年度燃費基準未達成の現行エコカー減税対象車の一部を 引き続き減税対象とする措置を講じ 2 年延長 例 : 乗用車 改正前 ( 適用期限 :H27.3.31) 改正後 基準切替えと重点化 内容 対象車 内 容 対
事例2_自動車用材料
 省エネルギーその 1- 自動車用材料 ( 炭素繊維複合材料 ) 1. 調査の目的自動車用材料としての炭素繊維複合材料 (CFRP) は 様々な箇所に使用されている 炭素繊維複合材料を用いることにより 従来と同じ強度 安全性を保ちつつ自動車の軽量化が可能となる CFRP 自動車は 車体の 17% に炭素繊維複合材料を使用しても 従来自動車以上の強度を発揮することができる さらに炭素繊維複合材料を使用することによって機体の重量を低減することができ
( 出所 ) 中国自動車工業協会公表資料等より作成現在 中国で販売されている電気自動車のほとんどは民族系メーカーによる国産車である 15 年に販売された電気自動車のうち 約 6 割が乗用車で 約 4 割弱がバスであった 乗用車の中で 整備重量が1,kg 以下の小型車が9 割近くを占めた 14 年 8
 中国自動車工業協会公表資料等より作成現在 中国で販売されている電気自動車のほとんどは民族系メーカーによる国産車である 15 年に販売された電気自動車のうち 約 6 割が乗用車で 約 4 割弱がバスであった 乗用車の中で 整備重量が1,kg 以下の小型車が9 割近くを占めた 14 年 8") IEEJ 17 年 1 月掲載禁無断転載 EDMC エネルギートレンドトピック 中国における電気自動車による CO 排出削減に関する一考察 計量分析ユニット呂正 15 年 中国における電気自動車の販売台数は4 万台を超え 前年の約 5 倍に増加し 米国を抜いて世界 1 位となった 中国における電気自動車の急拡大の背景には 電気自動車購入への補助金と税金の減額 北京 上海などの大都市のナンバープレート規制で電気自動車が除外対象になっていることが大きい
IEEJ 17 年 1 月掲載禁無断転載 EDMC エネルギートレンドトピック 中国における電気自動車による CO 排出削減に関する一考察 計量分析ユニット呂正 15 年 中国における電気自動車の販売台数は4 万台を超え 前年の約 5 倍に増加し 米国を抜いて世界 1 位となった 中国における電気自動車の急拡大の背景には 電気自動車購入への補助金と税金の減額 北京 上海などの大都市のナンバープレート規制で電気自動車が除外対象になっていることが大きい
目次 要旨 1 Ⅰ. 通信 放送業界 3 1. 放送業界の歩み (1) 年表 3 (2) これまでの主なケーブルテレビの制度に関する改正状況 4 2. 通信 放送業界における環境変化とケーブルテレビの位置づけ (1) コンテンツ視聴環境の多様化 5 (2) 通信 放送業界の業績動向 6 (3) 国民
 年表 3 (2) これまでの主なケーブルテレビの制度に関する改正状況 4 2. 通信 放送業界における環境変化とケーブルテレビの位置づけ (1) コンテンツ視聴環境の多様化 5 (2) 通信 放送業界の業績動向 6 (3) 国民") ケーブルテレビ事業の現状 (2015 年度決算版 ) 2016 年 11 月 株式会社日本政策投資銀行 企業金融第 2 部 産業調査部 目次 要旨 1 Ⅰ. 通信 放送業界 3 1. 放送業界の歩み (1) 年表 3 (2) これまでの主なケーブルテレビの制度に関する改正状況 4 2. 通信 放送業界における環境変化とケーブルテレビの位置づけ (1) コンテンツ視聴環境の多様化 5 (2) 通信 放送業界の業績動向
ケーブルテレビ事業の現状 (2015 年度決算版 ) 2016 年 11 月 株式会社日本政策投資銀行 企業金融第 2 部 産業調査部 目次 要旨 1 Ⅰ. 通信 放送業界 3 1. 放送業界の歩み (1) 年表 3 (2) これまでの主なケーブルテレビの制度に関する改正状況 4 2. 通信 放送業界における環境変化とケーブルテレビの位置づけ (1) コンテンツ視聴環境の多様化 5 (2) 通信 放送業界の業績動向
電気自動車・燃料電池車の普及について
 電気自動車の普及について 福井県立大学 杉山ゼミ 林 延行 吉村 公佑 伊藤 稜真 加藤 駿佑 ~ はじめに ~ 現在 街中で多くの電気自動車を見かけるようになった 2017 年時点で数多くの電気自動車が 市販されている その数は今後も増えると予想されている 電気自動車用の充電スタンドもショッピングセンター等に 数多く設置されている 電気自動車に対する世界の政策 動き 2017 年夏 フランスの環境相が
資料1 :住宅(家庭部門)の中期の対策・施策検討
の中期の対策・施策検討") 住宅 ( 家庭部門 ) の中期の対策 施策検討 資料 1 1. 削減内訳 (2020 年固定ケース比 ) 高効率家電 16~17Mt-CO2 機器買い替えでトップランナー購入 高効率給湯 11~13Mt-CO2 機器買い替えでトップランナー購入太陽熱温水器含む 太陽光発電 4~11Mt-CO2 普及の加速化 高効率照明 4Mt-CO2 機器買い替えでトップランナー購入 高効率空調 3Mt-CO2 機器買い替えでトップランナー購入
住宅 ( 家庭部門 ) の中期の対策 施策検討 資料 1 1. 削減内訳 (2020 年固定ケース比 ) 高効率家電 16~17Mt-CO2 機器買い替えでトップランナー購入 高効率給湯 11~13Mt-CO2 機器買い替えでトップランナー購入太陽熱温水器含む 太陽光発電 4~11Mt-CO2 普及の加速化 高効率照明 4Mt-CO2 機器買い替えでトップランナー購入 高効率空調 3Mt-CO2 機器買い替えでトップランナー購入
2-2 需要予測モデルの全体構造交通需要予測の方法としては,1950 年代より四段階推定法が開発され, 広く実務的に適用されてきた 四段階推定法とは, 以下の4つの手順によって交通需要を予測する方法である 四段階推定法将来人口を出発点に, 1 発生集中交通量 ( 交通が, どこで発生し, どこへ集中
 資料 2 2 需要予測 2-1 需要予測モデルの構築地下鉄などの将来の交通需要の見通しを検討するに当たっては パーソントリップ調査をベースとした交通需要予測手法が一般的に行われている その代表的なものとしては 国土交通省では 近畿圏における望ましい交通のあり方について ( 近畿地方交通審議会答申第 8 号 ) ( 以下 8 号答申 と略す ) などにおいて 交通需要予測手法についても検討が行われ これを用いて提案路線の検討が行われている
別紙2
 別紙 2 年シミュレーション結果 26 年 6 月 社団法人経済同友会 人口一億人時代の日本委員会 1. シミュレーションの前提 (1) 人口動態の前提 P1 (2) その他の主な前提条件 P2 (3) 実質 GDPの決定要素 P3 2. シミュレーション結果 ~ (1) 実質 GDPの寄与度分解 P4 (2) 実質 GDP P5 (3) 国民一人当たり実質 GDP P6 (4) プライマリーバランスと政府債務残高
つのシナリオにおける社会保障給付費の超長期見通し ( マクロ ) (GDP 比 %) 年金 医療 介護の社会保障給付費合計 現行制度に即して社会保障給付の将来を推計 生産性 ( 実質賃金 ) 人口の規模や構成によって将来像 (1 人当たりや GDP 比 ) が違ってくる
 (GDP 比 %) 年金 医療 介護の社会保障給付費合計 現行制度に即して社会保障給付の将来を推計 生産性 ( 実質賃金 ) 人口の規模や構成によって将来像 (1 人当たりや GDP 比 ) が違ってくる") 資料 7 選択する未来 委員会成長 発展ワーキンググループ超高齢社会における社会保障システムと政府財政の持続可能性 大和総研主席研究員パブリックポリシーリサーチ担当鈴木準 1 年 1 月 1 日 Public Policy Research つのシナリオにおける社会保障給付費の超長期見通し ( マクロ ) (GDP 比 %) 35 3 5 15 1 5 年金 医療 介護の社会保障給付費合計 現行制度に即して社会保障給付の将来を推計
資料 7 選択する未来 委員会成長 発展ワーキンググループ超高齢社会における社会保障システムと政府財政の持続可能性 大和総研主席研究員パブリックポリシーリサーチ担当鈴木準 1 年 1 月 1 日 Public Policy Research つのシナリオにおける社会保障給付費の超長期見通し ( マクロ ) (GDP 比 %) 35 3 5 15 1 5 年金 医療 介護の社会保障給付費合計 現行制度に即して社会保障給付の将来を推計
H28秋_24地方税財源
 次世代に向けて持続可能な地方税財政基盤の確立について 1. 提案 要望項目 提案 要望先 総務省 (1) 地方交付税総額の確保 充実 減少等特別対策事業費等における取組の成果を反映した算定 減少等特別対策事業費 における 取組の成果 へ配分の段階的引き上げ 地域の元気創造事業費 における 地域活性化分 へ配分の重点化 緊急防災 減災事業債の延長および対象事業等の拡大 老朽化対策に係る地方財政計画における所要総額の確保
社会的責任に関する円卓会議の役割と協働プロジェクト 1. 役割 本円卓会議の役割は 安全 安心で持続可能な経済社会を実現するために 多様な担い手が様々な課題を 協働の力 で解決するための協働戦略を策定し その実現に向けて行動することにあります この役割を果たすために 現在 以下の担い手の代表等が参加
 私たちの社会的責任 宣言 ~ 協働の力 で新しい公共を実現する~ 平成 22 年 5 月 12 日社会的責任に関する円卓会議 社会的責任に関する円卓会議 ( 以下 本円卓会議 という ) は 経済 社会 文化 生活など 様々な分野における多様な担い手が対等 平等に意見交換し 政府だけでは解決できない諸課題を 協働の力 で解決するための道筋を見出していく会議体として 平成 21 年 3 月に設立されました
3 特許保有数 図表 Ⅰ-3 調査対象者の特許保有数 Ⅱ. 分析結果 1. 減免制度 (1) 減免制度の利用状況本調査研究のヒアリング対象の中小企業が利用している法律別の減免制度の利用状況を 図表 Ⅱ-1 に示す 企業数は延べ数でカウントしている 図表 Ⅱ-1 減免制度の利用状況 この結果から 産業
 減免制度の利用状況本調査研究のヒアリング対象の中小企業が利用している法律別の減免制度の利用状況を 図表 Ⅱ-1 に示す 企業数は延べ数でカウントしている 図表 Ⅱ-1 減免制度の利用状況 この結果から 産業") 中小企業等に対する料金減免制度を中心とした支援施策に関する 調査研究報告書 Ⅰ. 序 1. 目的本調査研究は これまでに減免制度を利用した中小企業等に対し ヒアリング調査により 中小企業等への支援施策全体における減免制度の位置付けや減免制度による効果等に関して情報収集を行い 調査により得られた情報を整理 分析することにより 減免制度の政策的な効果について検証し 現行の減免制度の評価や今後の減免制度の在り方等について検討するための基礎資料を得ることを目的として行った
中小企業等に対する料金減免制度を中心とした支援施策に関する 調査研究報告書 Ⅰ. 序 1. 目的本調査研究は これまでに減免制度を利用した中小企業等に対し ヒアリング調査により 中小企業等への支援施策全体における減免制度の位置付けや減免制度による効果等に関して情報収集を行い 調査により得られた情報を整理 分析することにより 減免制度の政策的な効果について検証し 現行の減免制度の評価や今後の減免制度の在り方等について検討するための基礎資料を得ることを目的として行った
「自動運転車」に関する意識調査(アンケート調査)~「自動運転技術」に対する認知度はドイツの消費者の方が高いことが判明~_損保ジャパン日本興亜
~「自動運転技術」に対する認知度はドイツの消費者の方が高いことが判明~_損保ジャパン日本興亜") 2018 年 4 月 10 日 自動運転車 に関する意識調査 ( アンケート調査 ) ~ 自動運転技術 に対する認知度はドイツの消費者の方が高いことが判明 ~ 損害保険ジャパン日本興亜株式会社 ( 社長 : 西澤敬二 以下 損保ジャパン日本興亜 ) は 4 月 10 日の 交通事故死ゼロを目指す日 を前に 事故のない安心 安全な社会の実現 の重要な手段と考えられている自動運転技術の普及促進に向けて
2018 年 4 月 10 日 自動運転車 に関する意識調査 ( アンケート調査 ) ~ 自動運転技術 に対する認知度はドイツの消費者の方が高いことが判明 ~ 損害保険ジャパン日本興亜株式会社 ( 社長 : 西澤敬二 以下 損保ジャパン日本興亜 ) は 4 月 10 日の 交通事故死ゼロを目指す日 を前に 事故のない安心 安全な社会の実現 の重要な手段と考えられている自動運転技術の普及促進に向けて
このジニ係数は 所得等の格差を示すときに用いられる指標であり 所得等が完全に平等に分配されている場合に比べて どれだけ分配が偏っているかを数値で示す ジニ係数は 0~1の値をとり 0 に近づくほど格差が小さく 1に近づくほど格差が大きいことを表す したがって 年間収入のジニ係数が上昇しているというこ
 大格差みずほインサイト 政策 2017 年 1 月 11 日 世帯の年間収入格差が拡大高齢者世帯の格差は中長期的には縮小傾向 政策調査部上席主任研究員 堀江奈保子 03-3591-1308 naoko. horie@mizuho-ri.co.jp 総務省 全国消費実態調査 によると 二人以上の世帯の年間収入格差は拡大が続いている 世帯主の年齢階級別にみると おおむね年齢の上昇とともに格差が拡大する
タイトル
 Economic Trends マクロ経済分析レポート テーマ : 消費増税使途見直しの影響 2017 年 9 月 26 日 ( 火 ) ~ 景気次第では8% 引き上げ時の使途見直しも検討に~ 第一生命経済研究所経済調査部首席エコノミスト永濱利廣 (TEL:03-5221-4531) ( 要旨 ) 消費増税の使途見直しは 社会保障の充実以外にも 借金返済額の縮小を通じて民間部門の負担の軽減となる 軽減税率を想定した場合
Microsoft PowerPoint - 08economics4_2.ppt
 経済学第 4 章資源配分と所得分配の決定 (2) 4.2 所得分配の決定 中村学園大学吉川卓也 1 所得を決定する要因 資源配分が変化する過程で 賃金などの生産要素価格が変化する 生産要素価格は ( 賃金を想定すればわかるように ) 人々の所得と密接な関係がある 人々の所得がどのように決まるかを考えるために 会社で働いている人を例にとる 2 (1) 賃金 会社で働いている人は 給与を得ている これは
扉〜目次
 2017 年版 EDMC/ エネルギー 経済統計要覧 目次 I. エネルギーと経済 1. 主要経済指標... 2 a GDPとエネルギー関連主要指標... 3 s 国内総支出 ( 平成 23 年基準国民経済計算 : 連鎖方式 )... 4 d 消費... 6 f 投資... 7 g 鉱工業生産 出荷指数... 8 h 金融... 9 j 人口 労働 物価... 10 k 貿易 国際収支... 12
Microsoft PowerPoint - 01_Presentation_Prof_Wildemann_PressConference_Japan_J_ver.1 [Compatibility Mode]
![Microsoft PowerPoint - 01_Presentation_Prof_Wildemann_PressConference_Japan_J_ver.1 [Compatibility Mode]](/thumbs/86/93878016.jpg "Microsoft PowerPoint - 01_Presentation_Prof_Wildemann_PressConference_Japan_J_ver.1 [Compatibility Mode]") TCW TCW Transfer-Centrum GmbH & Co. KG for Production-Logistics and Technology-Management ラベリング制度とエコタイヤ 日本 韓国 中国における国内法規制 道路基盤と市場環境 ホルスト ヴィルデマン 1 1 ラベリング制度とエコタイヤ : 市場での普及拡大のための主要指標 2 日本 : 2010 年から業界自主基準として低燃費タイヤのラベリング制度を導入
TCW TCW Transfer-Centrum GmbH & Co. KG for Production-Logistics and Technology-Management ラベリング制度とエコタイヤ 日本 韓国 中国における国内法規制 道路基盤と市場環境 ホルスト ヴィルデマン 1 1 ラベリング制度とエコタイヤ : 市場での普及拡大のための主要指標 2 日本 : 2010 年から業界自主基準として低燃費タイヤのラベリング制度を導入
<4D F736F F F696E74202D E9197BF A A C5816A CE97CD82CC90A28A458E738FEA2E B8CDD8AB B83685D>
 世界の火力発電の市場動向 次世代 発電協議会 ( 第 5 回会合 ) 資料 2 1. はじめに 2. 世界の発電動向 3. 世界の国 地域別発電市場動向 4. 我が国の発電市場動向 5. 世界の火力発電の発電効率 6. 今後の世界の火力発電市場 一般財団法人エネルギー総合工学研究所小野崎正樹 1 1. はじめに 東南アジアを中心とした急激な経済成長にともない 発電設備の拡充が進んでいる 2040~2050
IFRS基礎講座 IAS第11号/18号 収益
 IFRS 基礎講座 収益 のモジュールを始めます このモジュールには IAS 第 18 号 収益 および IAS 第 11 号 工事契約 に関する解説が含まれます これらの基準書は IFRS 第 15 号 顧客との契約による収益 の適用開始により 廃止されます パート 1 では 収益に関連する取引の識別を中心に解説します パート 2 では 収益の認識規準を中心に解説します パート 3 では 工事契約について解説します
<4D F736F F D A30318F8A93BE8A698DB782C689C692EB82CC C838B834D815B8EF997762E646F63>
 所得格差と家庭のエネルギー需要 計量分析ユニット需給分析 予測グループ研究主幹栁澤明 要旨 所得格差の拡大が懸念されている 1 年前と比べると 年収 3 万 ~5 万円の世帯が大幅に増加 7 万 ~9 万円を中心とする世帯の減少も著しい 二極化の流れの中 中間層が最も厳しい状況に直面しており 平均以下へ転落する世帯が発生している 低所得層が急増している一方で 富裕層の減収率は中間層に比べ小さなものにとどまり
IT 人材需給に関する調査 ( 概要 ) 平成 31 年 4 月経済産業省情報技術利用促進課 1. 調査の目的 実施体制 未来投資戦略 2017 ( 平成 29 年 6 月 9 日閣議決定 ) に基づき 第四次産業革命下で求められる人材の必要性やミスマッチの状況を明確化するため 経済産業省 厚生労働
 平成 31 年 4 月経済産業省情報技術利用促進課 1. 調査の目的 実施体制 未来投資戦略 2017 ( 平成 29 年 6 月 9 日閣議決定 ) に基づき 第四次産業革命下で求められる人材の必要性やミスマッチの状況を明確化するため 経済産業省 厚生労働") IT 人材需給に関する調査 ( 概要 ) 平成 31 年 4 月経済産業省情報技術利用促進課 1. 調査の目的 実施体制 未来投資戦略 2017 ( 平成 29 年 6 月 9 日閣議決定 ) に基づき 第四次産業革命下で求められる人材の必要性やミスマッチの状況を明確化するため 経済産業省 厚生労働省 文部科学省の三省連携で人材需給の試算を行った 試算にあたっては 経済産業省情報技術利用促進課とみずほ情報総研株式会社が事務局となり
IT 人材需給に関する調査 ( 概要 ) 平成 31 年 4 月経済産業省情報技術利用促進課 1. 調査の目的 実施体制 未来投資戦略 2017 ( 平成 29 年 6 月 9 日閣議決定 ) に基づき 第四次産業革命下で求められる人材の必要性やミスマッチの状況を明確化するため 経済産業省 厚生労働省 文部科学省の三省連携で人材需給の試算を行った 試算にあたっては 経済産業省情報技術利用促進課とみずほ情報総研株式会社が事務局となり
分析手法の選択 燃費や車体重量 排気量に応じて減税措置が異なるエコカー減税 グリーン化特例の分析には 車種別データ等を扱うことができる非集計モデルが適切である 分析手法の分類 車体課税における税制グリーン化の分析に係る先行研究の多くは 部分均衡分析の手法が使われている 本分析手法のロジットモデルは
 資料 3-2 車体課税のグリーン化による環境効果の分析について ( 推計結果 ) 分析手法の選択 燃費や車体重量 排気量に応じて減税措置が異なるエコカー減税 グリーン化特例の分析には 車種別データ等を扱うことができる非集計モデルが適切である 分析手法の分類 車体課税における税制グリーン化の分析に係る先行研究の多くは 部分均衡分析の手法が使われている 本分析手法のロジットモデルは 非集計モデルに分類される
配慮事項 1 鉛の使用量 ( バッテリーに使用されているものを除く ) が可能な限り削減されていること 2 資源有効利用促進法の判断の基準を踏まえ 製品の長寿命化及び省資源化又は部品の再使用若しくは材料の再生利用のための設計上の工夫がなされていること 特に 希少金属類の減量化や再生利用のための設計上
 が可能な限り削減されていること 2 資源有効利用促進法の判断の基準を踏まえ 製品の長寿命化及び省資源化又は部品の再使用若しくは材料の再生利用のための設計上の工夫がなされていること 特に 希少金属類の減量化や再生利用のための設計上") 11. 自動車等 11-1 自動車 (1) 品目及び判断の基準等 自動車 判断の基準 新しい技術の活用等により従来の自動車と比較して著しく環境負荷の低減を実現した自動車であって 次に掲げる自動車であること 1 電気自動車 2 天然ガス自動車 3 ハイブリッド自動車 4 プラグインハイブリッド自動車 5 燃料電池自動車 6 水素自動車 7 クリーンディーゼル自動車 ( 乗車定員 10 人以下の乗用の用に供する自動車
11. 自動車等 11-1 自動車 (1) 品目及び判断の基準等 自動車 判断の基準 新しい技術の活用等により従来の自動車と比較して著しく環境負荷の低減を実現した自動車であって 次に掲げる自動車であること 1 電気自動車 2 天然ガス自動車 3 ハイブリッド自動車 4 プラグインハイブリッド自動車 5 燃料電池自動車 6 水素自動車 7 クリーンディーゼル自動車 ( 乗車定員 10 人以下の乗用の用に供する自動車
第9章 タイの二輪車産業-好調な国内市場と中国の影響-
 第9章第 9 章タイの二輪車産業 - 好調な国内市場と中国の影響 - 1 横山光紀 はじめに 第 1 節 二輪車産業の概観 1. 二輪車の普及状況 図 1 二輪車登録台数の推移 出所 : 運輸通信省 (Ministry of Transport and Communications) 第9章 表 1 二輪車の普及率 ( 二輪車 1 台あたりの人口 ) ( 単位 : 人 / 台 ) 1993 1994
Microsoft Word - 報告書.doc
 第 4 節 電力市場自由化の先進地域の現状 PPS 事業者 オンサイト事業者などの新規参入者はターゲットとなる需要家が多い地域から優先的に事業展開を図る傾向があるため 参入状況は地域によって大きく異なる 図表 23 に示すとおり PPS 事業者の販売量シェアが高い地域のうち関東 近畿及び九州地域を先進地域と位置づけ 新規参入者の参入状況 その結果としての電力価格の推移等の情報を整理する 図表 24
Microsoft PowerPoint - WS案 ppt [互換モード]
![Microsoft PowerPoint - WS案 ppt [互換モード]](/thumbs/91/105137982.jpg "Microsoft PowerPoint - WS案 ppt [互換モード]") Transport Future Workshop 第 2 回自動車とエネルギーに関するワークショップ 自動車部門を中心とした 世界のエネルギーおよび運輸需要予測 平成 24 年 3 月 29 日 日本エネルギー経済研究所 末広茂 1 はじめに 背景 化石燃料の価格高騰や資源問題 地球温暖化問題など エネルギー 環境に関するさまざまな課題が表面化している 新興国のモータリゼーションの進展を背景に 石油需要及び
Transport Future Workshop 第 2 回自動車とエネルギーに関するワークショップ 自動車部門を中心とした 世界のエネルギーおよび運輸需要予測 平成 24 年 3 月 29 日 日本エネルギー経済研究所 末広茂 1 はじめに 背景 化石燃料の価格高騰や資源問題 地球温暖化問題など エネルギー 環境に関するさまざまな課題が表面化している 新興国のモータリゼーションの進展を背景に 石油需要及び
問題意識 民生部門 ( 業務部門と家庭部門 ) の温室効果ガス排出量削減が喫緊の課題 民生部門対策が進まなければ 他部門の対策強化や 海外からの排出クレジット取得に頼らざるを得ない 民生部門対策において IT の重要性が増大 ( 利用拡大に伴う排出量増加と省エネポテンシャル ) IT を有効に活用し
 の温室効果ガス排出量削減が喫緊の課題 民生部門対策が進まなければ 他部門の対策強化や 海外からの排出クレジット取得に頼らざるを得ない 民生部門対策において IT の重要性が増大 ( 利用拡大に伴う排出量増加と省エネポテンシャル ) IT を有効に活用し") 民生部門対策のための グリーン IT 普及支援の枠組み 富士通総研経済研究所主任研究員生田孝史 ikuta.takafumi@jp.fujitsu.com 問題意識 民生部門 ( 業務部門と家庭部門 ) の温室効果ガス排出量削減が喫緊の課題 民生部門対策が進まなければ 他部門の対策強化や 海外からの排出クレジット取得に頼らざるを得ない 民生部門対策において IT の重要性が増大 ( 利用拡大に伴う排出量増加と省エネポテンシャル
民生部門対策のための グリーン IT 普及支援の枠組み 富士通総研経済研究所主任研究員生田孝史 ikuta.takafumi@jp.fujitsu.com 問題意識 民生部門 ( 業務部門と家庭部門 ) の温室効果ガス排出量削減が喫緊の課題 民生部門対策が進まなければ 他部門の対策強化や 海外からの排出クレジット取得に頼らざるを得ない 民生部門対策において IT の重要性が増大 ( 利用拡大に伴う排出量増加と省エネポテンシャル
参考 平成 27 年 11 月 政府税制調査会 経済社会の構造変化を踏まえた税制のあり方に関する論点整理 において示された個人所得課税についての考え方 4 平成 28 年 11 月 14 日 政府税制調査会から 経済社会の構造変化を踏まえた税制のあり方に関する中間報告 が公表され 前記 1 の 配偶
 1. 所得税改革の流れ 1. ポイント 1 所得税抜本改革 は先送りされたが 平成 30 年度税制改正は 働き方の多様化を踏まえて 働き方改革 を後押しするため 人的控除 ( 基礎控除 ) の見直し 所得の種類に応じた控除の見直し が行われる 2 今後の見直しに向けた方向性は 人的控除について今回の改正の影響を見極めながら基礎控除への更なる振替えの検討 経済社会の ICT 化等を踏まえて所得把握に向けた取り組み
目次 1. 奈良市域の温室効果ガス排出量 温室効果ガス排出量の推移 年度 2010 年度の温室効果ガス排出状況 部門別温室効果ガス排出状況 温室効果ガス排出量の増減要因 産業部門 民生家庭部門
 目次 1. 奈良市域の温室効果ガス排出量... 1 1 温室効果ガス排出量の推移... 1 29 21 の温室効果ガス排出状況... 2 3 部門別温室効果ガス排出状況... 3 2. 温室効果ガス排出量の増減要因... 4 1 産業部門... 4 2 民生家庭部門... 5 3 民生業務部門... 7 4 運輸部門... 8 5 廃棄物分野... 9 ( 参考 ) 温室効果ガス排出量の推計方法...
3 流動比率 (%) 流動資産流動負債 短期的な債務に対する支払能力を表す指標である 平成 26 年度からは 会計制度の見直しに伴い 流動負債に 1 年以内に償還される企業債や賞与引当金等が計上されることとなったため それ以前と比べ 比率は下がっている 分析にあたっての一般的な考え方 当該指標は 1
 流動資産流動負債 短期的な債務に対する支払能力を表す指標である 平成 26 年度からは 会計制度の見直しに伴い 流動負債に 1 年以内に償還される企業債や賞与引当金等が計上されることとなったため それ以前と比べ 比率は下がっている 分析にあたっての一般的な考え方 当該指標は 1") 経営指標の概要 1. 経営の健全性 効率性 1 経常収支比率 (%) 経常収益 経常費用 経常収支比率は 当該年度において 給水収益等の収益で維持管理費や支払利息等の費用をどの程度賄えているかを表す指標である 平成 26 年度からは 会計制度の見直しに伴い 収益に長期前受金戻入が計上されることとなったため それ以前と比べ 比率は上がっている 分析にあたっての一般的な考え方 当該指標は 単年度の収支が黒字であることを示す
経営指標の概要 1. 経営の健全性 効率性 1 経常収支比率 (%) 経常収益 経常費用 経常収支比率は 当該年度において 給水収益等の収益で維持管理費や支払利息等の費用をどの程度賄えているかを表す指標である 平成 26 年度からは 会計制度の見直しに伴い 収益に長期前受金戻入が計上されることとなったため それ以前と比べ 比率は上がっている 分析にあたっての一般的な考え方 当該指標は 単年度の収支が黒字であることを示す
< 目次 > Ⅰ. 基準シナリオ : 経済成長持続ケース 1. 中間所得層 + 高所得層の推移 2. 中間所得層の推移 3. 高所得層の推移 Ⅱ. シナリオ2: 中国とインド経済が急激にダウンしたら? 1. 中間所得層 + 高所得層の推移 2. 中間所得層の推移 3. 高所得層の推移 Ⅲ. シナリオ
 NIRA モノグラフシリーズ 2.6 No.31 資料 アジアの 内需 を牽引する所得層 景気が失速しても 中間所得層の拡大は大きい < シミュレーション結果のデータ編 > 柳川範之 総合研究開発機構理事東京大学大学院経済学研究科准教授 森直子 総合研究開発機構主任研究員 < 目次 > Ⅰ. 基準シナリオ : 経済成長持続ケース 1. 中間所得層 + 高所得層の推移 2. 中間所得層の推移 3. 高所得層の推移
2007年12月10日 初稿
 LNG 価格のこれまでの経緯と将来の展望 ( パート Ⅰ) 世界の3 大 LNG 市場世界の LNG 市場は アジア 太平洋 欧州 北米と大きく3つに区分することが出来る 世界の地域別 LNG 輸入割合は輸入量の多い地域を順に挙げると 1アジア 太平洋 64.0% 2 ヨーロッパ 27.2% 3 北米 8.3% 4 中南米 0.5% となる 図 1 は世界の地域別 LNG 輸入割合を示したものである
資料2 紙類の判断の基準等の設定に係る検討経緯について
 資料 2 紙類の判断の基準等の設定に係る検討経緯について 1. 率先実行計画における推奨リストの策定 (1) 率先実行計画第一次環境基本計画 ( 平成 6 年 12 月閣議決定 ) における 4 つの長期的な目標の 参加 の施策の一つの柱として 国の事業者 消費者としての環境保全に向けた取組の率先実行 が掲げられ これに基づき 国の各行政機関共通の実行計画として 平成 7 年 6 月に 国の事業者
第1章
 エネルギー価格と為替レートが消費者物価指数へ与える影響 化石 電力ユニットガスグループ 上野宏一 1. はじめに 2013 年 4 月の日本銀行による異次元緩和政策の導入以降 一時は 1.5% まで上昇した消費者物価指数上昇率 ( 消費税を除く ) は 2014 年後半からの原油価格急落を要因として急激に低下した コアCPI(CPI 総合 < 生鮮食品除く>) の足元の動きをみると 2016 年初頭から原油価格は徐々に持ち直し
RIETI Highlight Vol.66
 2 0 1 7 F A L L 66 1 RIETI HIGHLIGHT 2017 FALL RIETI HIGHLIGHT 2017 FALL 3 Interviewer 4 RIETI HIGHLIGHT 2017 FALL DPNo No. 17-E-082-0 http://www.rieti.go.jp/jp/publications/dp/17e082.pdf RIETI HIGHLIGHT
Microsoft PowerPoint - Itoh_IEEJ(150410)_rev
_rev") 第 4 回エネルギー輸送ルートの多様化への対応に関する検討会 日本の LNG 原油輸入と 米国シェール革命の現況 2015 年 4 月 10 日於国土交通省 ( 中央合同庁舎 3 号館 ) 伊藤庄一 戦略研究ユニット国際情勢分析第 2 グループ マネージャー 研究主幹一般財団法人日本エネルギー経済研究所 日本の LNG 原油輸入状況 (2014 年 ) 1 LNG 原油 ( 出所 ) 日本貿易月表
第 4 回エネルギー輸送ルートの多様化への対応に関する検討会 日本の LNG 原油輸入と 米国シェール革命の現況 2015 年 4 月 10 日於国土交通省 ( 中央合同庁舎 3 号館 ) 伊藤庄一 戦略研究ユニット国際情勢分析第 2 グループ マネージャー 研究主幹一般財団法人日本エネルギー経済研究所 日本の LNG 原油輸入状況 (2014 年 ) 1 LNG 原油 ( 出所 ) 日本貿易月表
PowerPoint プレゼンテーション
 ( 注 ) 当該データ及び数値を利用したことについて生じる結果について NRI は 一切の責任を負うものではなく また 当該データ及び数値の内容について 完全性 最新性 特定目的への適合性等 一切の保証を行いません また 利用者が 利用者の判断の主要な根拠として依拠すべきものではなく 利用者は 行おうとする取引について 必要に応じ ビジネス アドバイザー 弁護士 税理士 会計士等の専門家と相談するようお願いいたします
<8A C52E786C7378>
 第 12 回 トラック運送業界の景況感 ( 速報 ) 平成 3 年 4 月 ~6 月期 平成 3 年 4 月 ~6 月期の日銀短観 ( 業況判断指数 ) は 原油等の原材料価格上昇によるコストアップ要因により 製造業 ( 大企業 ) の業況判断指数は2 四半期連続で悪化した こうしたなか トラック運送業では運賃 料金の水準が 一般貨物 19.( 12.2) 宅配貨物 76.9( 41.7) 宅配以外の貨物
取組概要 ( 申請書からの転記 ) 全 般 排 出 量 の 認 識 取組名称 認証取得者名取組の概要 適用したカーボン オフセット第三者認証基準のバージョン認証の有効期間オフセット主体認証ラベルの使途 認証対象活動 認証番号 :CO 有効期間満了報告書受領済み 持続可能な島嶼社会の発展に
 全 般 排 出 量 の 認 識 取組名称 認証取得者名取組の概要 適用したカーボン オフセット第三者認証基準のバージョン認証の有効期間オフセット主体認証ラベルの使途 認証対象活動 認証番号 :CO 有効期間満了報告書受領済み 持続可能な島嶼社会の発展に") 取組概要 ( 申請書からの転記 ) 全 般 排 出 量 の 認 識 取組名称 認証取得者名取組の概要 適用したカーボン オフセット第三者認証基準のバージョン認証の有効期間オフセット主体認証ラベルの使途 認証対象活動 持続可能な島嶼社会の発展に関する専門家会議 の開催に係る国内での CO2 排出量のカーボン オフセット株式会社コングレ 2014 年 6 月 29 日 ~30 日に開催された 持続可能な島嶼社会の発展に関する専門家会議
取組概要 ( 申請書からの転記 ) 全 般 排 出 量 の 認 識 取組名称 認証取得者名取組の概要 適用したカーボン オフセット第三者認証基準のバージョン認証の有効期間オフセット主体認証ラベルの使途 認証対象活動 持続可能な島嶼社会の発展に関する専門家会議 の開催に係る国内での CO2 排出量のカーボン オフセット株式会社コングレ 2014 年 6 月 29 日 ~30 日に開催された 持続可能な島嶼社会の発展に関する専門家会議
第 3 章隠岐の島町のエネルギー需要構造 1 エネルギーの消費量の状況 ここでは 隠岐の島町におけるエネルギー消費量を調査します なお 算出方法は資料編第 5 章に詳しく述べます (1) 調査対象 町内のエネルギー消費量は 電気 ガス 燃料油 ( ガソリン 軽油 灯油 重油 ) 新エ ネルギー (
 調査対象 町内のエネルギー消費量は 電気 ガス 燃料油 ( ガソリン 軽油 灯油 重油 ) 新エ ネルギー (") 第 3 章のエネルギー需要構造 1 エネルギーの消費量の状況 ここでは におけるエネルギー消費量を調査します なお 算出方法は資料編第 5 章に詳しく述べます (1) 調査対象 町内のエネルギー消費量は 電気 ガス 燃料油 ( ガソリン 軽油 灯油 重油 ) 新エ ネルギー ( 太陽光 太陽熱 ) について 資源エネルギー庁から出される公式統計 総合 エネルギー統計 での最終エネルギー消費量 28
第 3 章のエネルギー需要構造 1 エネルギーの消費量の状況 ここでは におけるエネルギー消費量を調査します なお 算出方法は資料編第 5 章に詳しく述べます (1) 調査対象 町内のエネルギー消費量は 電気 ガス 燃料油 ( ガソリン 軽油 灯油 重油 ) 新エ ネルギー ( 太陽光 太陽熱 ) について 資源エネルギー庁から出される公式統計 総合 エネルギー統計 での最終エネルギー消費量 28
エコカー減税グリーン化特例(自動車税 軽自動車税)(自動車税 軽自動車税)環境性能割車体課税の見直し ( 自動車重量税 自動車取得税 自動車税 軽自動車税 ) トラック バス タクシーについては 営自格差 を堅持するとともに 一部見直しを行った上で エコカー減税 グリーン化特例を 2 年間延長 また
(自動車税 軽自動車税)環境性能割車体課税の見直し ( 自動車重量税 自動車取得税 自動車税 軽自動車税 ) トラック バス タクシーについては 営自格差 を堅持するとともに 一部見直しを行った上で エコカー減税 グリーン化特例を 2 年間延長 また") 減税グリーン化特例(自動車税 軽自動車税)(自動車税 軽自動車税)環境性能割車体課税の見直し ( 自動車 自動車取得税 自動車税 軽自動車税 ) トラック バス タクシーについては 営自格差 を堅持するとともに 一部見直しを行った上で 減税 グリーン化特例を 2 年間延長 また 自動車税の環境性能割について 現行の内容を維持 自家用乗用車については 地方財政に配慮しつつ 減税 グリーン化特例 環境性能割の見直しを行った上で
減税グリーン化特例(自動車税 軽自動車税)(自動車税 軽自動車税)環境性能割車体課税の見直し ( 自動車 自動車取得税 自動車税 軽自動車税 ) トラック バス タクシーについては 営自格差 を堅持するとともに 一部見直しを行った上で 減税 グリーン化特例を 2 年間延長 また 自動車税の環境性能割について 現行の内容を維持 自家用乗用車については 地方財政に配慮しつつ 減税 グリーン化特例 環境性能割の見直しを行った上で
スライド 1
 太陽光発電の新たな買取制度について 平成 21 年 9 月 24 日 経済産業省資源エネルギー庁 省エネルギー 新エネルギー部 太陽光発電の意義 日本のエネルギー事情 化石燃料依存度が一次エネルギー供給の 8 割 その 9 割超を輸入 エネルギー源の多様化 地球温暖化問題への対応が必要 太陽光発電は ほぼ無尽蔵の純国産エネルギー 発電時に CO 2 を排出しないエネルギー 産業 経済面での重要性 日本の技術力が優位
経済学でわかる金融・証券市場の話③
 純粋期待仮説 ( 物価と金融政策 ) 講義 2 図が重なっている等見えづらい箇所がありますが これはアニメを使用しているためです 講義で確認してください 文字が小さい箇所があります 印刷の際に必要に応じて拡大等してください 1 設備投資の変化要因 1 GDP= 消費 + 投資 + 政府支出 + 純輸出 GDPは 消費 投資 政府支出 純輸出 のいずれか増加すれば それだけでもGDPは増加する 消費は
これは 平成 27 年 12 月現在の清掃一組の清掃工場等の施設配置図です 建替え中の杉並清掃工場を除く 20 工場でごみ焼却による熱エネルギーを利用した発電を行っています 施設全体の焼却能力の規模としては 1 日当たり 11,700 トンとなります また 全工場の発電能力規模の合計は約 28 万キ
 清掃一組のごみ発電による電力売却の取組について説明します 施設管理部技術課発電係長の下田です よろしくお願いいたします -1- これは 平成 27 年 12 月現在の清掃一組の清掃工場等の施設配置図です 建替え中の杉並清掃工場を除く 20 工場でごみ焼却による熱エネルギーを利用した発電を行っています 施設全体の焼却能力の規模としては 1 日当たり 11,700 トンとなります また 全工場の発電能力規模の合計は約
調査要領 1. 調査の目的 : 4 月からの電力の小売り全面自由化に対する会員事業所の意識及びその影響を把握し 今後の参考資料とする 2. 調査実施機関 : 甲府商工会議所 3. 調査実施時期 : 平成 28 年 3 月 24 日 ( 木 )~31 日 ( 木 ) 4. 調査対象 : 当所会員 30
~31 日 ( 木 ) 4. 調査対象 : 当所会員 30") 電力の小売全面自由化に関する意識調査 - 結果概要報告書 - 平成 28 年 4 月 甲府商工会議所 調査要領 1. 調査の目的 : 4 月からの電力の小売り全面自由化に対する会員事業所の意識及びその影響を把握し 今後の参考資料とする 2. 調査実施機関 : 甲府商工会議所 3. 調査実施時期 : 平成 28 年 3 月 24 日 ( 木 )~31 日 ( 木 ) 4. 調査対象 : 当所会員 305
電力の小売全面自由化に関する意識調査 - 結果概要報告書 - 平成 28 年 4 月 甲府商工会議所 調査要領 1. 調査の目的 : 4 月からの電力の小売り全面自由化に対する会員事業所の意識及びその影響を把握し 今後の参考資料とする 2. 調査実施機関 : 甲府商工会議所 3. 調査実施時期 : 平成 28 年 3 月 24 日 ( 木 )~31 日 ( 木 ) 4. 調査対象 : 当所会員 305
(Microsoft Word \224N\203\215\203V\203A\213\311\223\214\223\212\216\221.doc)
") 2004 年のロシアロシア極東極東の外国投資 2005 年 10 月 日本貿易振興機構 ( ジェトロ ) 海外調査部 はじめに ジェトロでは ロシア科学アカデミー極東支部経済研究所 ( ハバロフスク経済研究所 ) の協力を得て 情報収集 調査活動を行なっているが 本レポートは 2004 年のロシア極東地域の経済情勢について同研究所に整理並びに分析を委託 とりまとめたものである 本レポートが関係各位の参考となれば幸いである
2004 年のロシアロシア極東極東の外国投資 2005 年 10 月 日本貿易振興機構 ( ジェトロ ) 海外調査部 はじめに ジェトロでは ロシア科学アカデミー極東支部経済研究所 ( ハバロフスク経済研究所 ) の協力を得て 情報収集 調査活動を行なっているが 本レポートは 2004 年のロシア極東地域の経済情勢について同研究所に整理並びに分析を委託 とりまとめたものである 本レポートが関係各位の参考となれば幸いである
1. のれんを資産として認識し その後の期間にわたり償却するという要求事項を設けるべきであることに同意するか 同意する場合 次のどの理由で償却を支持するのか (a) 取得日時点で存在しているのれんは 時の経過に応じて消費され 自己創設のれんに置き換わる したがって のれんは 企業を取得するコストの一
 取得日時点で存在しているのれんは 時の経過に応じて消費され 自己創設のれんに置き換わる したがって のれんは 企業を取得するコストの一") ディスカッション ペーパー のれんはなお償却しなくてよいか のれんの会計処理及び開示 に対する意見 平成 26 年 9 月 30 日 日本公認会計士協会 日本公認会計士協会は 企業会計基準委員会 (ASBJ) 欧州財務報告諮問グループ (EFRAG) 及びイタリアの会計基準設定主体 (OIC) のリサーチ グループによるリサーチ活動に敬意を表すとともに ディスカッション ペーパー のれんはなお償却しなくてよいか
ディスカッション ペーパー のれんはなお償却しなくてよいか のれんの会計処理及び開示 に対する意見 平成 26 年 9 月 30 日 日本公認会計士協会 日本公認会計士協会は 企業会計基準委員会 (ASBJ) 欧州財務報告諮問グループ (EFRAG) 及びイタリアの会計基準設定主体 (OIC) のリサーチ グループによるリサーチ活動に敬意を表すとともに ディスカッション ペーパー のれんはなお償却しなくてよいか
平均車齢 平均車齢 ( 軽自動車を除く ) とは 平成 30 年 3 月末現在において わが国でナンバープレートを付けている自動車が初度登録 ( 注 1) してからの経過年の平均であり 人間の平均年齢に相当する 平均車齢は 新車販売台数が減少し 自動車が長く使われると高齢化が進む 逆に新車販売台数が
 とは 平成 30 年 3 月末現在において わが国でナンバープレートを付けている自動車が初度登録 ( 注 1) してからの経過年の平均であり 人間の平均年齢に相当する 平均車齢は 新車販売台数が減少し 自動車が長く使われると高齢化が進む 逆に新車販売台数が") 平均車齢 平均車齢 ( 軽自動車を除く ) とは 平成 30 年 3 月末現在において わが国でナンバープレートを付けている自動車が初度登録 ( 注 1) してからの経過年の平均であり 人間の平均年齢に相当する 平均車齢は 新車販売台数が減少し 自動車が長く使われると高齢化が進む 逆に新車販売台数が増加し 高齢の自動車のスクラップや海外輸出が増えると若返る 算出には 保有台数を初度登録年度別に (
平均車齢 平均車齢 ( 軽自動車を除く ) とは 平成 30 年 3 月末現在において わが国でナンバープレートを付けている自動車が初度登録 ( 注 1) してからの経過年の平均であり 人間の平均年齢に相当する 平均車齢は 新車販売台数が減少し 自動車が長く使われると高齢化が進む 逆に新車販売台数が増加し 高齢の自動車のスクラップや海外輸出が増えると若返る 算出には 保有台数を初度登録年度別に (
平成 28 年度エネルギー消費統計における製造業 ( 石油等消費動態統計対象事業所を除く ) のエネルギー消費量を部門別にみると 製造部門で消費されるエネルギーは 1,234PJ ( 構成比 90.7%) で 残りの 127PJ( 構成比 9.3%) は管理部門で消費されています 平成 28 年度エ
 のエネルギー消費量を部門別にみると 製造部門で消費されるエネルギーは 1,234PJ ( 構成比 90.7%) で 残りの 127PJ( 構成比 9.3%) は管理部門で消費されています 平成 28 年度エ") 平成 28 年度エネルギー消費統計結果概要 経済産業省資源エネルギー庁平成 30 年 3 月 平成 28 年度エネルギー消費統計における調査の結果 最終エネルギー消費量計は 3,889PJ 1 ( 原油換算 10,044 万 kl) でした 最終エネルギー消費量をエネルギー種別割合で見ると 燃料 ( 石油 石炭製品 + ガス + 再生可能等 ) が 36.2 % 電力が 51.7% 蒸気 熱が 12.2%
平成 28 年度エネルギー消費統計結果概要 経済産業省資源エネルギー庁平成 30 年 3 月 平成 28 年度エネルギー消費統計における調査の結果 最終エネルギー消費量計は 3,889PJ 1 ( 原油換算 10,044 万 kl) でした 最終エネルギー消費量をエネルギー種別割合で見ると 燃料 ( 石油 石炭製品 + ガス + 再生可能等 ) が 36.2 % 電力が 51.7% 蒸気 熱が 12.2%
Ⅰ. 世界海運とわが国海運の輸送活動 1. 主要資源の対外依存度 わが国は エネルギー資源のほぼ全量を海外に依存し 衣食住の面で欠くことのでき ない多くの資源を輸入に頼っている わが国海運は こうした海外からの貿易物質の安定輸送に大きな役割を果たしている 石 炭 100% 原 油 99.6% 天然ガ
 1. 主要資源の対外依存度 わが国は エネルギー資源のほぼ全量を海外に依存し 衣食住の面で欠くことのでき ない多くの資源を輸入に頼っている わが国海運は こうした海外からの貿易物質の安定輸送に大きな役割を果たしている 石 炭 100% 原 油 99.6% 天然ガス 97.2% 鉄 鉱石 100.0% 羊 毛 100.0% 綿 花 100.0% 大 92% 豆 小 88% 麦 木材 72% 注 ) 食料需給表
資料1 自動車WG中長期ロードマップ中間報告
 1グリーン税制 エコカー減税 エコカー補助金の概要 グリーン税制(21.4.1~): 排ガス及び燃費性能に優れた自動車の税率を軽減する一方 新規登録から一定年数以上を経過した自動車の税率を重課 エコカー減税(29.4.1~): 新車及び中古車についての自動車重量税及び自動車取得税を減税 エコカー補助金(29.4.1~): 環境対応車への買換補助 経年車の廃車を伴う新車購入には補助額を増額
年 車種 主な車種の平均車齢推移 乗用車貨物車乗合車 乗用車計普通車小型車貨物車計普通車小型車乗合車計普通車小型車 昭和 52 年 (1977 年 ) 昭和 53 年 (1978 年 )
 昭和 53 年 (1978 年 )") 平均車齢 平均車齢 ( 軽自動車を除く ) とは 平成 28 年 3 月末現在において わが国でナンバープレートを付けている自動車が初度登録 ( 注 1) してからの経過年の平均であり 人間の平均年齢に相当する 平均車齢は 新車販売台数が減少し 自動車が長く使われると高齢化が進む 逆に新車販売台数が増加し 高齢の自動車のスクラップや海外輸出が増えると若返る 算出には 保有台数を初度登録年度別に (
平均車齢 平均車齢 ( 軽自動車を除く ) とは 平成 28 年 3 月末現在において わが国でナンバープレートを付けている自動車が初度登録 ( 注 1) してからの経過年の平均であり 人間の平均年齢に相当する 平均車齢は 新車販売台数が減少し 自動車が長く使われると高齢化が進む 逆に新車販売台数が増加し 高齢の自動車のスクラップや海外輸出が増えると若返る 算出には 保有台数を初度登録年度別に (
資料3 船舶ワーキンググループにおける検討方針等について
 資料 3 船舶ワーキンググループにおける検討方針等について 1. 検討経緯 (1) 環境配慮契約法基本方針について環境配慮契約法基本方針 ( 以下 基本方針 という ) では 環境配慮契約の推進に関する基本的考え方 の一つとして 以下の項目があげられている 1 環境配慮契約に当たっては 経済性に留意しつつ価格以外の多様な要素をも考慮することで 環境に配慮した物品や役務など ( 以下 物品等 という
PowerPoint プレゼンテーション
 企業年金 個人年金制度に関する検討課題 2019 年 3 月 29 日 生命保険会社が提供する企業年金 個人年金 生命保険会社は 企業年金 個人年金として DB DC 個人年金保険等を提供し お客様の退職給付制度の安定的な運営や高齢期の所得確保等をサポートしている 主な保険商品お引受けの状況等 1 企業年金 確定給付企業年金保険 (DB) 資産管理運用機関等として 確定給付企業年金保険を提供 規約数
( 参考 ) と直近四半期末の資産構成割合について 乖離許容幅 資産構成割合 ( 平成 27(2015) 年 12 月末 ) 国内債券 35% ±10% 37.76% 国内株式 25% ±9% 23.35% 外国債券 15% ±4% 13.50% 外国株式 25% ±8% 22.82% 短期資産 -
 と直近四半期末の資産構成割合について 乖離許容幅 資産構成割合 ( 平成 27(2015) 年 12 月末 ) 国内債券 35% ±10% 37.76% 国内株式 25% ±9% 23.35% 外国債券 15% ±4% 13.50% 外国株式 25% ±8% 22.82% 短期資産 -") 第 106 回運用委員会平成 28 年 5 月 30 日 資料 年金積立金管理運用独立行政法人 Government Pension Investment Fund の定期検証について 定期検証のポイント GPIFは 運用委員会において 現行のの定期検証を行いました この結果 以下の点を確認し 現行のは 見直す必要がないとの結論になりました 年初からの金利低下等により国内債券の期待リターン低下の影響は見られるが
第 106 回運用委員会平成 28 年 5 月 30 日 資料 年金積立金管理運用独立行政法人 Government Pension Investment Fund の定期検証について 定期検証のポイント GPIFは 運用委員会において 現行のの定期検証を行いました この結果 以下の点を確認し 現行のは 見直す必要がないとの結論になりました 年初からの金利低下等により国内債券の期待リターン低下の影響は見られるが
資料3-1 温室効果ガス「見える化」の役割について
 資料 3-1 温室効果ガス 見える化 の役割について (1) 本検討の目的 (2) 温室効果ガス 見える化 の意義と範囲 (3) 温室効果ガス 見える化 の目的 (4) 温室効果ガス 見える化 の構成要素の検討 (5) 温室効果ガス 見える化 取組の現状整理 (6) 温室効果ガス削減の対象と 見える化 の活用範囲 (1) 本検討の目的 温室効果ガス 見える化 推進戦略会議では 温室効果ガス排出量削減を目的とした温室効果ガス
Microsoft PowerPoint - NIES
 増井利彦 ( 国立環境研究所 ) 資料 地球温暖化シンポジウム COP15 に向けた日本の戦略を考える パネル討論中期目標選択肢の評価と日本の戦略 長期目標 ( 参考 )IPCC 第 4 次評価報告書のシナリオ区分 出典 :IPCC 第 4 次評価報告書統合報告書政策決定者向け要約 温室効果ガスの濃度と気温上昇との関係を示す気候感度は,2 ~4.5 の幅をとる可能性が高いとされているが, 本表においては
年 車種 主な車種の平均車齢推移 乗用車貨物車乗合車 乗用車計普通車小型車貨物車計普通車小型車乗合車計普通車小型車 昭和 53 年 (1978 年 ) 昭和 54 年 (1979 年 )
 昭和 54 年 (1979 年 )") 平均車齢 平均車齢 ( 軽自動車を除く ) とは 平成 29 年 3 月末現在において わが国でナンバープレートを付けている自動車が初度登録 ( 注 1) してからの経過年の平均であり 人間の平均年齢に相当する 平均車齢は 新車販売台数が減少し 自動車が長く使われると高齢化が進む 逆に新車販売台数が増加し 高齢の自動車のスクラップや海外輸出が増えると若返る 算出には 保有台数を初度登録年度別に (
平均車齢 平均車齢 ( 軽自動車を除く ) とは 平成 29 年 3 月末現在において わが国でナンバープレートを付けている自動車が初度登録 ( 注 1) してからの経過年の平均であり 人間の平均年齢に相当する 平均車齢は 新車販売台数が減少し 自動車が長く使われると高齢化が進む 逆に新車販売台数が増加し 高齢の自動車のスクラップや海外輸出が増えると若返る 算出には 保有台数を初度登録年度別に (
Microsoft Word - 報告書.doc
 第 2 節 東北地域における電力小売市場の状況 本調査では 電力小売自由化の影響を把握するため 業務用需要に該当する施設を多く所有する自治体 大学 病院に絞った需要家の電力調達の状況及び電力自由化に関する認識についてアンケート調査を実施した また 電力自由化に関する需要家の認識を詳細に把握するために ヒアリング調査も合わせて実施した 以下には 上記のアンケート調査 ヒアリング調査の結果を示すとともに
Microsoft Word 寄付アンケート記者報告.docx
 2011 年 8 月 23 日関西社会経済研究所 06-6441-0550 山本 東日本大震災に際しての寄付アンケート の調査結果について 東日本大震災以降 寄付に強い関心が集まり 2011 年 4 月の税制改正で寄付金控除が拡充されました 関西社会経済研究所では 寄付金控除と その拡充の政策効果を検証するためにアンケート調査を実施しましたので その調査結果をご報告致します なお 本調査は当研究所の税財政研究会
イノベーション活動に対する山梨県内企業の意識調査
 甲府支店山梨県甲府市飯田 1-1-24 OSD-Ⅲ ヒ ル 4F TEL: 055-233-0241 URL:http://www.tdb.co.jp/ イノベーション活動 企業の 4 割超が実施 ~ イノベーション活動の阻害要因 能力のある従業員の不足が半数に迫る ~ はじめに 日本再興戦略改訂 2015( 成長戦略 ) においてイノベーションによる 稼ぐ力 の強化が掲げられているほか 女性の活躍推進政策のなかで
おカネはどこから来てどこに行くのか―資金循環統計の読み方― 第4回 表情が変わる保険会社のお金
 なるほど金融 おカネはどこから来てどこに行くのか 資金循環統計の読み方 第 4 回 2013 年 11 月 6 日全 6 頁 表情が変わる保険会社のお金 金融調査部主任研究員島津洋隆 前回 日本の年金を通じてどのようにおカネが流れているのかということについて説明しました 今回は 保険会社を巡るおカネの流れについて注目します Q1 保険会社のおカネの流れはどうなっていますか A1 保険会社は加入者から預かった保険料を金融資産として運用する一方で
バイオマス比率をめぐる現状 課題と対応の方向性 1 FIT 認定を受けたバイオマス発電設備については 毎の総売電量のうち そのにおける各区分のバイオマス燃料の投入比率 ( バイオマス比率 ) を乗じた分が FIT による売電量となっている 現状 各区分のバイオマス比率については FIT 入札の落札案
 を乗じた分が FIT による売電量となっている 現状 各区分のバイオマス比率については FIT 入札の落札案") 既認定案件による国民負担 の抑制に向けた対応 ( バイオマス比率の変更への対応 ) 2018 12 21 日資源エネルギー庁 バイオマス比率をめぐる現状 課題と対応の方向性 1 FIT 認定を受けたバイオマス発電設備については 毎の総売電量のうち そのにおける各区分のバイオマス燃料の投入比率 ( バイオマス比率 ) を乗じた分が FIT による売電量となっている 現状 各区分のバイオマス比率については
既認定案件による国民負担 の抑制に向けた対応 ( バイオマス比率の変更への対応 ) 2018 12 21 日資源エネルギー庁 バイオマス比率をめぐる現状 課題と対応の方向性 1 FIT 認定を受けたバイオマス発電設備については 毎の総売電量のうち そのにおける各区分のバイオマス燃料の投入比率 ( バイオマス比率 ) を乗じた分が FIT による売電量となっている 現状 各区分のバイオマス比率については
電解水素製造の経済性 再エネからの水素製造 - 余剰電力の特定 - 再エネの水素製造への利用方法 エネルギー貯蔵としての再エネ水素 まとめ Copyright 215, IEEJ, All rights reserved 2
 国内再生可能エネルギーからの水素製造の展望と課題 第 2 回 CO2フリー水素ワーキンググループ水素 燃料電池戦略協議会 216 年 6 月 22 日 日本エネルギー経済研究所 柴田善朗 Copyright 215, IEEJ, All rights reserved 1 電解水素製造の経済性 再エネからの水素製造 - 余剰電力の特定 - 再エネの水素製造への利用方法 エネルギー貯蔵としての再エネ水素
<81798A6D92E8817A F925093C682C6834E838D83582E786C7378>
 リサイクル部品に関するアンケートの調査結果について < 目的 > < 期間 > < 対象 > < 方法 > リサイクル部品に対する自動車ユーザーの意識や利用実態を把握し 一層の活用を推進するとともに アンケート結果を公表し リサイクル部品に対する認知度を高める 2013 年 10 月 1 日 ( 火 )~11 月 30 日 ( 土 ) 一般消費者 (10 代以上の男女 10,477 人 ) インターネットおよびはがき
トラック運送事業の経営実態 全日本トラック協会は全国のトラック運送事業者 2,188 社 ( 有効数 ) の平成 25 年度事業報告書に基づき集計 分析した 経営分析報告書 ( 平成 25 年度決算版 ) をまとめた 全日本トラック協会が平成 4 年度から発行しているこの報告書は 会員事業者が自社の
 の平成 25 年度事業報告書に基づき集計 分析した 経営分析報告書 ( 平成 25 年度決算版 ) をまとめた 全日本トラック協会が平成 4 年度から発行しているこの報告書は 会員事業者が自社の") 平成 27 年 3 月 23 日 全ト協の経営分析平成 25 年度決算版 ( 対象期間 : 平成 24 年 1 月 ~ 平成 26 年 8 月 ) 業界の大半を占める 5 台以下の 64% が営業赤字 ~ 貨物流動の活発化で売上高増加も赤字拡大 ~ 貨物運送事業の営業収益 営業利益率の推移 (1 社平均 ) 区分 営業収益 ( 千円 ) 営業利益率 (%) 23 年度 24 年度 25 年度 23
平成 27 年 3 月 23 日 全ト協の経営分析平成 25 年度決算版 ( 対象期間 : 平成 24 年 1 月 ~ 平成 26 年 8 月 ) 業界の大半を占める 5 台以下の 64% が営業赤字 ~ 貨物流動の活発化で売上高増加も赤字拡大 ~ 貨物運送事業の営業収益 営業利益率の推移 (1 社平均 ) 区分 営業収益 ( 千円 ) 営業利益率 (%) 23 年度 24 年度 25 年度 23
参考資料3(第1回検討会資料3)
") 参考資料 3 平成 28 年度環境配慮契約法基本方針等の検討方針等 ( 案 ) - 平成 28 年度第 1 回環境配慮契約法基本方針検討会掲出資料 1. 基本方針等の見直しの考え方 (1) 本年度の見直しに当たっての考え方環境配慮契約法に基づく基本方針については 必要に応じた見直しを実施することとされており 以下に掲げたいずれかの項目を満たす製品 サービスが契約の対象となる場合に見直しを検討することを基本的な考え方としている
参考資料 3 平成 28 年度環境配慮契約法基本方針等の検討方針等 ( 案 ) - 平成 28 年度第 1 回環境配慮契約法基本方針検討会掲出資料 1. 基本方針等の見直しの考え方 (1) 本年度の見直しに当たっての考え方環境配慮契約法に基づく基本方針については 必要に応じた見直しを実施することとされており 以下に掲げたいずれかの項目を満たす製品 サービスが契約の対象となる場合に見直しを検討することを基本的な考え方としている
Microsoft Word 後藤佑介.doc
 課題アプローチ技法 Ⅲ 73070310 後藤佑介テーマ 住宅用太陽光発電システムの利用効果 1. はじめに近年 地球温暖化問題に関心が集まっている その要因である二酸化炭素は私たちの生活を支える電力利用から排出される 二酸化炭素の排出を削減するためには再生可能エネルギー利用の技術が必要である その技術の一つである太陽光発電システム (PV システム ) はクリーンで無公害なエネルギーとして大きな期待が寄せられている
我が国中小企業の課題と対応策
 資料 3 我が国中小 小規模企業を取り巻く環境と現状 平成 24 年 月 8 日 中小企業庁 本資料は 第 回法制検討ワーキンググループでの 2000 年以降の中小企業を取り巻く環境についての分析を行う必要があるのではないか との委員のご指摘等を受けて 経済社会環境の中長期的な動向 中小 小規模企業の財務 経営を中心とした状況をまとめたもの 目次. 中小 小規模企業を取り巻く経済社会環境 p. 2.
chap03.indd
 3 表示効果や木材についての消費者及び事業者へのアンケートの実施 国内外において 既に制度化あるいは計画されている木材等に関する環境貢献度等の表示の制度及び製品事例の調査 分析を行った また 制度の特徴を踏まえ 今後 公共建築物を中心とした国内建築物等において国産材の利用を推進するために有効な環境貢献度等表示のあり方の検討を合わせて行うことを前提に 情報の整理を行った 調査手法としては 消費者及び事業者へのアンケートに依る事とし
調査結果の概要 1. 自社チャンネルの加入者動向については消極的な見通しが大勢を占めた自社チャンネルの全体的な加入者動向としては 現状 では 減少 (50.6%) が最も多く 続いて 横ばい (33.7%) 増加 (13.5%) の順となっている 1 年後 についても 減少 (53.9%) 横ばい
 が最も多く 続いて 横ばい (33.7%) 増加 (13.5%) の順となっている 1 年後 についても 減少 (53.9%) 横ばい") 2017 年 7 月 18 日 多チャンネル放送研究所 所長音好宏 第 20 回 多チャンネル放送市場 事業者予測調査 結果発表 ネット配信系サービスへの 意識 と懸念が示される 多チャンネル放送研究所 ( 所長 : 音好宏 ) では 第 20 回目となる 多チャンネル放送市場 事業者予測調査 を実施しました 本調査は 同研究所が ( 一社 ) 衛星放送協会の正会員社の各チャンネルを対象に 多チャンネル放送市場の現状と見通しについて年
2017 年 7 月 18 日 多チャンネル放送研究所 所長音好宏 第 20 回 多チャンネル放送市場 事業者予測調査 結果発表 ネット配信系サービスへの 意識 と懸念が示される 多チャンネル放送研究所 ( 所長 : 音好宏 ) では 第 20 回目となる 多チャンネル放送市場 事業者予測調査 を実施しました 本調査は 同研究所が ( 一社 ) 衛星放送協会の正会員社の各チャンネルを対象に 多チャンネル放送市場の現状と見通しについて年
企画書タイトル - 企画書サブタイトル -
 中期経営計画 ( 平成 27~29 年度 ) 一部改定 基本目標 JBIC ならではの金融仲介機能の発揮により 我が国企業の国際事業展開及び資源獲得への支援を深化し 我が国の持続的な成長に繋がる新たなビジネス機会の探索と創造に貢献します 平成 29 年 1 月 一部改定のコンセプト 株式会社国際協力銀行 (JBIC) は 平成 27 年 6 月に策定した 平成 27~29 年度中期経営計画 ( 中期経営計画
1
 1 2 3 4 イーストスプリング インド消費関連ファンド当ファンドのリスクについて 基準価額の変動要因 投資信託は預貯金とは異なります 当ファンドは 投資信託証券への投資を通じて主に値動きのある有価証券に投資するため 当ファンドの基準価額は投資する有価証券等の値動きによる影響を受け 変動します また 外貨建資産に投資しますので 為替変動リスクもあります したがって 当ファンドは投資元本が保証されているものではなく
新とする理由⑴ 政策目的 車体課税については 平成 23 年度税制改正大綱において エコカー減税の期限到来時までに 地球温暖化対策の観点や国及び地方の財政の状況を踏まえつつ 当分の間として適用される税率の取扱いを含め 簡素化 グリーン化 負担の軽減等を行う方向で抜本的な見直しを検討 することとされて
 税目自動車重量税要望の内容平成 2 4 年度税制改正 ( 租税特別措置 ) 要望事項 ( 新設 拡充 延長 ) 制度名車体課税の一層のグリーン化等 ( 環境省 ) 車体課税については 平成 23 年度税制改正大綱において エコカー減税の期限到来時までに 地球温暖化対策の観点や国及び地方の財政の状況も踏まえつつ 当分の間として適用されている税率の取扱いを含め 簡素化 グリーン化 負担の軽減等を行う方向で抜本的な見直しを検討
1 平成 22 年度の取組み結果 平成 22 年度の取り組み結果は 下記のとおりです 温室効果ガスの総排出量 平成 22 年度 温室効果ガス総排出量 (t-co2) 26,876 27, % 具体的取り組み 平成 22 年度 電気使用量 (kwh) 37,334,706 38,665,4
 26,876 27, % 具体的取り組み 平成 22 年度 電気使用量 (kwh) 37,334,706 38,665,4") 平成 22 年度豊川市役所地球温暖化対策実行計画の進捗状況 ( 報告 ) 平成 23 年 9 月 経済環境部環境課 市は 豊川市環境基本計画に基づき 事業者の立場から平成 23 年 2 月に豊川市 役所地球温暖化対策実行計画を策定し 環境負荷の低減と地球温暖化防止に向けて 温室効果ガスの総排出量の削減に取り組んでいます 計画の期間は 平成 22 年度から平成 26 年度までの 5 年間で 温室効果ガスの
平成 22 年度豊川市役所地球温暖化対策実行計画の進捗状況 ( 報告 ) 平成 23 年 9 月 経済環境部環境課 市は 豊川市環境基本計画に基づき 事業者の立場から平成 23 年 2 月に豊川市 役所地球温暖化対策実行計画を策定し 環境負荷の低減と地球温暖化防止に向けて 温室効果ガスの総排出量の削減に取り組んでいます 計画の期間は 平成 22 年度から平成 26 年度までの 5 年間で 温室効果ガスの
番号文書項目現行改定案 ( 仮 ) 1 モニタリン 別表 : 各種係 グ 算定規程 ( 排出削 数 ( 単位発熱量 排出係数 年度 排出係数 (kg-co2/kwh) 全電源 限界電源 平成 21 年度 年度 排出係数 (kg-co2/kwh) 全電源 限界電源 平成 21 年度 -
 1 モニタリン 別表 : 各種係 グ 算定規程 ( 排出削 数 ( 単位発熱量 排出係数 年度 排出係数 (kg-co2/kwh) 全電源 限界電源 平成 21 年度 年度 排出係数 (kg-co2/kwh) 全電源 限界電源 平成 21 年度 -") 制度文書改定案新旧対照表 ( 単位発熱量 排出係数等 ) 別紙 番号文書項目現行改定案 1 モニタリング 算定規程 ( 排出削減プロジェクト用 ) 別表 : 各種係数 ( 単位発熱量 排出係数等 ) 燃料の単位発熱量 排出係数等 燃料種 燃料形態 単位 単位発熱量 [GJ/ 単位 ] 排出係数 [t-co2/gj] 換算係数 ( 高位 低位発熱量 ) 燃料種 燃料形態 単位 単位発熱量 [GJ/ 単位
制度文書改定案新旧対照表 ( 単位発熱量 排出係数等 ) 別紙 番号文書項目現行改定案 1 モニタリング 算定規程 ( 排出削減プロジェクト用 ) 別表 : 各種係数 ( 単位発熱量 排出係数等 ) 燃料の単位発熱量 排出係数等 燃料種 燃料形態 単位 単位発熱量 [GJ/ 単位 ] 排出係数 [t-co2/gj] 換算係数 ( 高位 低位発熱量 ) 燃料種 燃料形態 単位 単位発熱量 [GJ/ 単位
2013(平成25年度) 確定拠出年金実態調査 調査結果について.PDF
 確定拠出年金実態調査 調査結果について.PDF") ( 本件に関する問合せ先 ) 企業年金連合会会員センター運用 運営調査室板屋 工藤 TEL 03-5401-8712 FAX 03-5401-8727 2013( 平成 25 年度 ) 確定拠出年金実態調査調査結果について 平成 26 年 12 月 16 日 企業年金連合会 企業年金連合会では 確定拠出年金の運営状況について統計的に把握し 実施事業主の制度運営上の参考に供するとともに 制度の普及および発展に資することを目的に
( 本件に関する問合せ先 ) 企業年金連合会会員センター運用 運営調査室板屋 工藤 TEL 03-5401-8712 FAX 03-5401-8727 2013( 平成 25 年度 ) 確定拠出年金実態調査調査結果について 平成 26 年 12 月 16 日 企業年金連合会 企業年金連合会では 確定拠出年金の運営状況について統計的に把握し 実施事業主の制度運営上の参考に供するとともに 制度の普及および発展に資することを目的に
参考資料 1 約束草案関連資料 中央環境審議会地球環境部会 2020 年以降の地球温暖化対策検討小委員会 産業構造審議会産業技術環境分科会地球環境小委員会約束草案検討ワーキンググループ合同会合事務局 平成 27 年 4 月 30 日
 参考資料 1 約束草案関連資料 中央環境審議会地球環境部会 2020 年以降の地球温暖化対策検討小委員会 産業構造審議会産業技術環境分科会地球環境小委員会約束草案検討ワーキンググループ合同会合事務局 平成 27 年 4 月 30 日 約束草案の提出に関する各国の状況 (2015 年 4 月 28 日時点 ) 2015 年 4 月 28 日時点で 7 か国 1 地域 (EU28 カ国 ) が約束草案を提出
エネルギー供給事業者による非化石エネルギー源の利用及び化石エネルギー原料の有効な利用の促進に関する法律の制定の背景及び概要 ( 平成 22 年 11 月 ) 資源エネルギー庁総合政策課編
 資源エネルギー庁総合政策課編") エネルギー供給事業者による非化石エネルギー源の利用及び化石エネルギー原料の有効な利用の促進に関する法律の制定の背景及び概要 ( 平成 22 年 11 月 ) 資源エネルギー庁総合政策課編 エネルギー供給構造高度化法制定の背景 Ⅰ エネルギーを巡る情勢 (1) 我が国のエネルギー供給の推移及び各国との比較 我が国では高度経済成長以降 比較的安価で調達 かつ安定的に供給するこ とができた石油がエネルギー供給の中心だった
エネルギー供給事業者による非化石エネルギー源の利用及び化石エネルギー原料の有効な利用の促進に関する法律の制定の背景及び概要 ( 平成 22 年 11 月 ) 資源エネルギー庁総合政策課編 エネルギー供給構造高度化法制定の背景 Ⅰ エネルギーを巡る情勢 (1) 我が国のエネルギー供給の推移及び各国との比較 我が国では高度経済成長以降 比較的安価で調達 かつ安定的に供給するこ とができた石油がエネルギー供給の中心だった
(*2) ハイブリッド自動車 ハイブリッドバス トラック ハイブリッド乗用車等車両総重量 3.5t 以下は 車 (*4) かつ燃費基準 +25% 達成車 (*5) 車両総重量 3.5t 超は重量車 車 (*9) かつ重量車燃費基準達成車 (*7) (*3) クリーンディーゼル乗用車平成 21 年排出
 ハイブリッド自動車 ハイブリッドバス トラック ハイブリッド乗用車等車両総重量 3.5t 以下は 車 (*4) かつ燃費基準 +25% 達成車 (*5) 車両総重量 3.5t 超は重量車 車 (*9) かつ重量車燃費基準達成車 (*7) (*3) クリーンディーゼル乗用車平成 21 年排出") 7 平成 21 年度の税制改正の概要について 1 自動車重量税 自動車取得税の時限的減免関係について 厳しい経済状況の中 自動車の買換 購入需要を促進しつつ 低炭素社会の実現を図るため 環境性能に優れた自動車に対する自動車重量税 自動車取得税の時限的免除 軽減を図ります 自動車重量税 自動車取得税の特例 以下の場合に 自動車重量税及び自動車取得税を免除 軽減いたします 自動車重量税 : 下記の自動車について
7 平成 21 年度の税制改正の概要について 1 自動車重量税 自動車取得税の時限的減免関係について 厳しい経済状況の中 自動車の買換 購入需要を促進しつつ 低炭素社会の実現を図るため 環境性能に優れた自動車に対する自動車重量税 自動車取得税の時限的免除 軽減を図ります 自動車重量税 自動車取得税の特例 以下の場合に 自動車重量税及び自動車取得税を免除 軽減いたします 自動車重量税 : 下記の自動車について
<4D F736F F D208D8291AC93B BF8BE08E7B8DF482CC89658BBF92B28DB E92B A2E646F63>
 高速道路の新料金施策に関する影響調査について 2010 年 12 月 28 日財団法人運輸調査局 1. 調査の目的 2011 年 4 月以降の高速道路の新料金施策について 乗用車を平日上限 2,000 円 土日祝日上限 1,000 円とする上限料金制度を導入する方向で 政府で調整が進められていることを受け 施策実施による影響を把握することを目的に調査を行った 高速道路の新料金施策が実施された場合における
資料 4 個人消費者に対するアンケート調査結果 第 1 調査の概要 1 調査の目的本調査は 個人消費者が低公害車を購入した動機 理由 低公害車を購入した者と低公害車以外の自動車を購入した者との相違点 個人消費者の国の施策の認知状況等を把握し 世界最先端の 低公害車 社会の構築に関する政策の評価に活用
 資料 4 個人消費者に対するアンケート調査結果 第 1 調査の概要 1 調査の目的本調査は 個人消費者が低公害車を購入した動機 理由 低公害車を購入した者と低公害車以外の自動車を購入した者との相違点 個人消費者の国の施策の認知状況等を把握し 世界最先端の 低公害車 社会の構築に関する政策の評価に活用するために実施した ( 注 ) 本調査における 低公害車 とは 天然ガス自動車 (CNG 自動車 )
<4D F736F F F696E74202D A F95BD90AC E31308C8E8AFA5F8C888E5A90E096BE89EF81408DC58F4994C530362E70707
 目次 1. 2015 年 10 月期連結業績 2. 2016 年 10 月期業績予想 3. 今後の展開 Copyright 2015 Kanamoto Co., Ltd. All Rights Reserved. 22 BULL55 Build UpaLegendaryL d Leading company plan for the 55th 現状把握と課題認識新長期ビジョン数値目標 Copyright
Microsoft PowerPoint - (参考資料1)介護保険サービスに関する消費税の取扱い等について
介護保険サービスに関する消費税の取扱い等について") 社保審 - 介護給付費分科会 第 97 回 (H25.12.10) 参考資料 1 介護給付費分科会 - 介護事業経営調査委員会 第 9 回 (H25.12.4) 資料 2 介護保険サービスに関する消費税の取扱い等について 1 1. 介護報酬における対応について 基本的な考え方 消費税 8% 引上げ時の介護報酬改定については 基本単位数への上乗せを基本としつつ 消費税負担が相当程度見込まれる加算についても
社保審 - 介護給付費分科会 第 97 回 (H25.12.10) 参考資料 1 介護給付費分科会 - 介護事業経営調査委員会 第 9 回 (H25.12.4) 資料 2 介護保険サービスに関する消費税の取扱い等について 1 1. 介護報酬における対応について 基本的な考え方 消費税 8% 引上げ時の介護報酬改定については 基本単位数への上乗せを基本としつつ 消費税負担が相当程度見込まれる加算についても
労働市場分析レポート第 43 号平成 26 年 10 月 31 日 マッチング指標を用いたマッチング状況の分析 労働市場における労働力需給調整を評価するための指標として 就職率や充足率があるが 求人倍率が上昇する時には 就職率が上昇し充足率が低下するなどの動きがみられ それぞれ単独の利用には注意が必
 労働市場分析レポート第 43 号平成 26 年 1 月 31 日 マッチング指標を用いたマッチング状況の分析 労働市場における労働力需給調整を評価するための指標として 就職率や充足率があるが 求人倍率が上昇する時には 就職率が上昇し充足率が低下するなどの動きがみられ それぞれ単独の利用には注意が必要である このレポートでは 就職率と充足率の双方を加味して 労働市場の機能を評価する指標を計測し マッチング状況の分析を行う
平成 22 年度エネルギー消費統計結果概要 経済産業省資源エネルギー庁平成 24 年 4 月 エネルギー種別に見ると 最終エネルギー消費総量の 37.5% が燃料 54.8% が電力 7.4% が熱となっています 調査の対象となった非製造業 製造業 ( 石油等消費動態統計対象事業所を除く ) 業務部
 業務部") 平成 22 年度エネルギー消費統計結果概要 経済産業省資源エネルギー庁平成 24 年 4 月 エネルギー種別に見ると 最終エネルギー消費総量の 37.5% が燃料 54.8% が電力 7.4% が熱となっています 調査の対象となった非製造業 製造業 ( 石油等消費動態統計対象事業所を除く ) のエネルギー消費量計は 3,805PJ( 原油換算 9,828 万 kl) でした PJ( ペタ ジュール
平成 22 年度エネルギー消費統計結果概要 経済産業省資源エネルギー庁平成 24 年 4 月 エネルギー種別に見ると 最終エネルギー消費総量の 37.5% が燃料 54.8% が電力 7.4% が熱となっています 調査の対象となった非製造業 製造業 ( 石油等消費動態統計対象事業所を除く ) のエネルギー消費量計は 3,805PJ( 原油換算 9,828 万 kl) でした PJ( ペタ ジュール
日本経済の現状と見通し ( インフレーションを中心に ) 2017 年 2 月 17 日 関根敏隆日本銀行調査統計局
 2017 年 2 月 17 日 関根敏隆日本銀行調査統計局") 日本経済の現状と見通し ( インフレーションを中心に ) 17 月 17 日 関根敏隆日本銀行調査統計局 基準改定の GDP への影響 (1) 名目 GDP 水準の変化 実質 GDP 成長率の変化 35 3 5 ( 名目 兆円 ) その他 ( 確報化等の影響 ) その他 8SNA 対応 (R&D 投資以外 ) R&D 投資 ( 設備投資 公共投資 ) 基準改定後 - 基準改定前 1..5 ( 基準改定後の前比
日本経済の現状と見通し ( インフレーションを中心に ) 17 月 17 日 関根敏隆日本銀行調査統計局 基準改定の GDP への影響 (1) 名目 GDP 水準の変化 実質 GDP 成長率の変化 35 3 5 ( 名目 兆円 ) その他 ( 確報化等の影響 ) その他 8SNA 対応 (R&D 投資以外 ) R&D 投資 ( 設備投資 公共投資 ) 基準改定後 - 基準改定前 1..5 ( 基準改定後の前比
バイオ燃料
 別添 1 熱利用エコ燃料の導入量の目安の考え方 (1) 短期的な導入量 2010 年度の導入量目標は 京都議定書目標達成計画により定められているので ここでは 各バイオマスのエコ燃料への変換可能量を試算した これらのエコ燃料変換可能量の数字から 目標達成に必要となる熱利用比率を算定した なお エコ燃料変換可能量は 各バイオマスを既存の技術を用いてすべて熱利用した場合を仮定した数字であり 実際にはバイオマスの性状に応じて熱利用以外のマテリアル利用も行われていることから
女性の活躍推進に向けた公共調達及び補助金の活用に関する取組指針について
 女性の活躍推進に向けた公共調達及び補助金の活用に関する取組指針について 平成 2 8 年 3 月 2 2 日すべての女性が輝く社会づくり本部決定 女性の活躍推進に向けた公共調達及び補助金の活用に関する取組指針について別紙のとおり定める 女性の活躍推進に向けた公共調達及び補助金の活用に関する取組指針 第 1 基本的な考え方人口減少社会を迎える中で 我が国の持続的成長を実現し 社会の活力を維持していくためには
TCS_AI_STUDY_PART201_PRINT_170426_fhj
 日々進歩する能力 AIをビジネス向上に活用し始めたグローバル企業 TCSグローバル トレンド スタディ Contents 調査結果の概要 4 5 6 AIに関するグローバルトレンドレポート 前編 タタコンサルタンシーサービシーズ TCS では今年 世界 4 地域の大企業が認識技術をどのように活用 しているかを調査したレポートを 前編 後編の 2 巻にわたって発行する 本レポートはその前編にあたり