APPENDIX 1
|
|
|
- ありあ さかわ
- 5 years ago
- Views:
Transcription
1 20163 会
2 APPENDIX 1
3 2
4 3
5 1-1 4
6 ,330 2,608 8, ,914 2,156 6, ,599 2,518 9, , , ,488 1,611 3, ,834 2, ,239 1, , , , /793 IFRS EBIT 88.77/ 5
7
8
9


10 1-3 9
11 1-4 () 2015/3 2016/3 2016/3 51,717 48, % 95, % 2,635 2, % 3, % % % 2015/3 2016/3 2,381 2, () () , , % 19,757 19, % 14,120 14, % E V EV 35,013 35, /3 2016/
12 11
13 2-1 12
14 2-2 13
15 2-3 14
16 15


17 3-1 13,100 3, HD
18 3-2 17
19 JP Toll(20155) LentonGeopost(201410) Aflac 20,000 HD (20157) JV20144 JP IBMApple
20 19
21
22


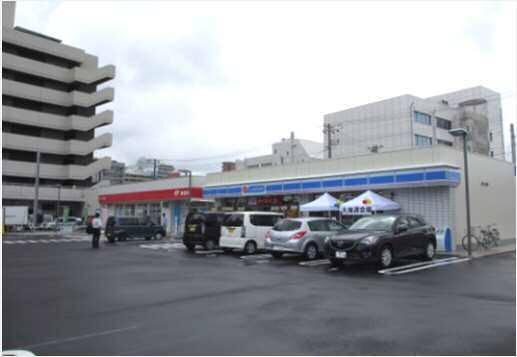
23 EC 2FamiFami 3Fami 4 22
24
25
26
27
28 4-2-2 Resources and Government Logistics Global Logistics Global Forwarding Global Express Contract logistics driven businesses Network driven businesses Domestic Forwarding 3PL Australia, Asia, Africa Asia Pacific International Australia, Asia Australia, New Zealand 1 22% 10 1, % /2013 6/2014 6/ IFRSIFRS20156/ 2. Annual ReportAnnual Report IFRS 27

29 ,200 28
30
31
32


33 4-3-3 ECEC JP ,200 1,


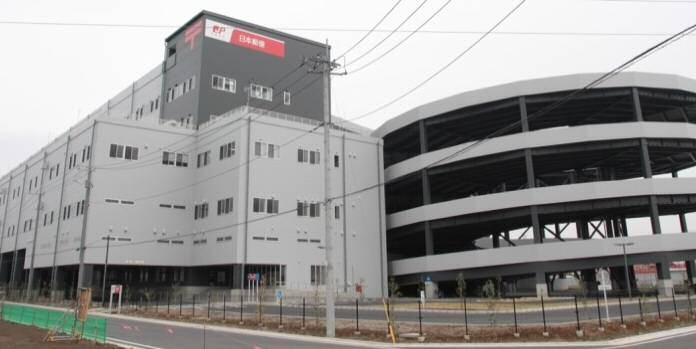
34 , ,783 91, ,628 3,903 8, KITTE , , ,133 4, JP JP JP 14.8 JP JP KITTE JP JP 14.8 JRJP KITTE 16.3 JRJP 16.4 JP KITTE
35 , ,072 DaysJP


36


37 before after 36
38
39 APPENDIX 38

40 IBM 2009 CEO JX % % % % 2 :
41 50% % % 50% %
42 1/2 1/2 (i)(ii) 21 1, ,00041,
43
44 ,700 4, ,000 19,600 Toll6,200 4, CTM ,300 43
45 , , /3 2012/3 2013/3 2014/3 2015/ /3 2011/3 2012/3 2013/3 2014/3 2015/
46 1-1.8% % -2.5% -3.1% -3.8% -4.3% -4.7% -8.5% -8.6% Universal postal union % -9.3% BtoC-EC 1 6,000 5,000 4,000 3,000 2,000 1, ,133 5,243 5,339 5,471 5,638 5,464 3,137 3,220 3,401 3,526 3,637 3, CAGR (2010/3-2015/3) 1.3% 2.9% % % 8.6% % EC 2 4.4% % % % 25.0% 20.0% 15.0% 10.0% 5.0% 0.0% 26 BtoC-EC ECEC 45

47 46
48 47

49 48
50
51 1 12, ,522 10,250 10,121 10,072 10, ,000 8,000 6,319 6,190 6,095 6,072 6,024 6,000 4,000 2, ,024 3,842 3,785 3,671 3, ,5092, ,7311,
52 51
53 52
日本郵政株式会社 会社説明会
 1 32 35,000 2919,470 2001 2002 2006 2012 2015 2016 2006123 6,287 424,827 2 3 4 5 234 27,314 24,452 82 200 859 1,333 1,505 2,596 2,589 3,464 2,271 1,503 1,186 3,461 2,452 1,033 0.2 1.3 2.4 2.0 1.9 6 24,000
2018年3月期中間決算説明会
 2018 3 2017 1120 APPENDIX 1 201834,0001,80120.3 2525 63,796 2.7 4,206 38.7 1,801 20.3 142,575 133,265 124,600 9,662 7,952 7,800 4,259 4,000 7,035 6,558 6,380 4,733 3,032 4,206 2,134 1,497 1,801 289 2016
,575 36,484 19,689 96, ,864 1,091 5, % 23.2% 5.2% 5.5% 9, ,819 4,115 1, % 85.1% 15.3% 16.5% 4,259 47
 2016283 2016 5 13 2016 3 142,575 36,484 19,689 96,057 13 6,864 1,091 5,634 0.0% 23.2% 5.2% 5.5% 9,662 423 4,819 4,115 1,495 194 874 811 13.4% 85.1% 15.3% 16.5% 4,259 472 3,250 848 567 250 443 35 11.7%
個人投資家向け会社説明会
 1 32 35,000 2914,026 2001 2002 2006 2012 2015 2016 2006123 5,937 415,801 2 201729 10 3 4 5 234 27,561 24,421 82 199 860 1,331 1,501 2,597 2,590 3,462 2,263 1,184 3,458 2,440 1,034 1,502 0.3 1.3 2.4 2.0
個人投資家向け会社説明会
 2019 3 2020 1 2 31 35,000 2906,401 2001 2002 2006 2012 2015 2016 2006123 42 + 20181012 3 JP 201325 4 5 5,981 3,722 17920183 24,000 17,000 20183 41420183 6 6,000 5,627 4,000 4,227 4,502 2,967 4,189 3,163
20 18 () () SNA SNA IMF World Economic Outlook, October 2017
 () SNA SNA IMF World Economic Outlook, October 2017") 20 18 () 18.6 16 14 12 10 11.2 8 6 4 4.9 2 0 1991 1996 2001 2006 2011 2016 () 1 219931993SNA19942008SNA IMF World Economic Outlook, October 2017 19891993SNA199520162008SNA IMF World Economic Outlook, October
20 18 () 18.6 16 14 12 10 11.2 8 6 4 4.9 2 0 1991 1996 2001 2006 2011 2016 () 1 219931993SNA19942008SNA IMF World Economic Outlook, October 2017 19891993SNA199520162008SNA IMF World Economic Outlook, October

C O N T E N T S 1. 2. 3. 4. 5. 6. 7. 8. 9. 10. 11. 12. 13. 14. 15. 16. 17. 18. 2009 Annual Report
 C O N T E N T S 1. 2. 3. 4. 5. 6. 7. 8. 9. 10. 11. 12. 13. 14. 15. 16. 17. 18. 2009 Annual Report 1 1 2009 Annual Report 1. 2. 2 2 2009 Annual Report 3 3 2009 Annual Report 3. 1980 1991 1992 1993 1994
18年度石見美術館年報最終.indd
 A Annual Report Annual Report B 1 Annual Report Annual Report 2 3 Annual Report Annual Report 4 Annual Report 5 Annual Report 6 7 Annual Report Annual Report 8 9 Annual Report Annual Report 10 11 Annual

2014度事業報告書p000_018.indd
 2014 Junior Chamber International Japan Annual Report 2014 Junior Chamber International Japan 2014 Junior Chamber International Japan Annual Report 2014 Junior Chamber International Japan Annual Report

1-8-1 2 DHL FedEx DHL KWE KUEHNE+NAGEL PANALPINA FedEx UPS TOLL DB SCHENKER SG CEVA 1 2 218
 8. 217 1-8-1 2 DHL FedEx DHL KWE KUEHNE+NAGEL PANALPINA FedEx UPS TOLL DB SCHENKER SG CEVA 1 2 218 A B BCP IT 3 4 1stParty Global Auto Hight Tech Third Party Logistics Regional 1 FMCG Food 2ndParty 11997
Œ¼‘ÌŒ¢’Ý™è-1
 1995 September 9 CONTENTS 1995 September9 AMERICAS ASIA OCEANIA EUROPE AFRICA 2 September 1995 4 September 1995 September 1995 5 6 September 1995 September 1995 7 8 September 1995 September 1995 9 10

Annual Report 2009
 Creating New Value 1 3 5 7 9 11 25 25 28 31 33 35 76 77 79 80 43 54 55 56 75 43 45 48 51 53 1 3 9 11 13 37 37 38 39 40 41 17 P3~6P12Q2P25~36P43~49 P51~74 P14~15Q4Q5P17~24P27 P30P32P34P36 P16Q6Q7 P6P10P12Q1P18P25~36
")


6 1873 6 6 6 2
 140 2012 12 12 140 140 140 140 140 1 6 1873 6 6 6 2 3 4 6 6 19 10 39 5 140 7 262 24 6 50 140 7 13 =1880 8 40 9 108 31 7 1904 20 140 30 10 39 =1906 3 =1914 11 6 12 20 1945.3.10 16 1941 71 13 B29 10 14 14


(個別のテーマ) 放射線検査に関連した医療事故
 放射線検査に関連した医療事故") - 131 - III - 132 - - 133 - III - 134 - - 135 - III - 136 - - 137 - III - 138 - - 139 - III - 140 - - 141 - III - 142 - - 143 - III - 144 - - 145 - III - 146 - - 147 - III - 148 - - 149 - III - 150 - -
- 131 - III - 132 - - 133 - III - 134 - - 135 - III - 136 - - 137 - III - 138 - - 139 - III - 140 - - 141 - III - 142 - - 143 - III - 144 - - 145 - III - 146 - - 147 - III - 148 - - 149 - III - 150 - -
(個別のテーマ) 薬剤に関連した医療事故
 薬剤に関連した医療事故") - 67 - III - 68 - - 69 - III - 70 - - 71 - III - 72 - - 73 - III - 74 - - 75 - III - 76 - - 77 - III - 78 - - 79 - III - 80 - - 81 - III - 82 - - 83 - III - 84 - - 85 - - 86 - III - 87 - III - 88 - - 89
- 67 - III - 68 - - 69 - III - 70 - - 71 - III - 72 - - 73 - III - 74 - - 75 - III - 76 - - 77 - III - 78 - - 79 - III - 80 - - 81 - III - 82 - - 83 - III - 84 - - 85 - - 86 - III - 87 - III - 88 - - 89
 医療機器の使用に関連した医療事故")
 医療処置に関連した医療事故")
6/9-98-資生堂-前半AR-6.5pm
 1998 1998 3 1998 1997 1996 620,910 39,278 16,868 588,572 42,898 19,152 560,821 37,012 17,507 1998 4,776,231 302,139 129,754 457,333 99,310 64,267 436,705 94,610 57,257 404,181 101,675 54,965 3,517,946
H1-H4_0906 [更新済み]
![H1-H4_0906 [更新済み]](/thumbs/43/23136860.jpg "H1-H4_0906 [更新済み]") 0570-016-100 Q&A 0570-016-100 1 2 3 4 5 1 23 123 0570-064-717 1 2 3 0570-016-100 0570-016-100 3 1 2 Q&A Q &A After Before After Before After Before After Before Before After Before Before After
0570-016-100 Q&A 0570-016-100 1 2 3 4 5 1 23 123 0570-064-717 1 2 3 0570-016-100 0570-016-100 3 1 2 Q&A Q &A After Before After Before After Before After Before Before After Before Before After


0614三校責了.indd")


 4 beautiful teeth now 5 6 7 8 9 3.5 mm 3.3 mm 10 11.5 13 15 4.1 mm 3.75 mm 8.5 10 11.5 13 15 18 4 mm 8.5 10 11.5 13 15 18 5.1 mm 5 mm 8.5 10 11.5 13 15 18 10 5.5 mm 7mm 4.1 mm 5.1 mm 3.75 mm 4 mm 5 mm
名称未設定-2
 1 2 3 4 6 11 13 15 16 17 20 24 26 27 28 30 31 32 33 CONTENTS KENSHIN ANNUAL REPORT 2008 KENSHIN KENSHIN KENSHIN KENSHIN ANNUAL REPORT 2008 KENSHIN 19 KENSHIN ANNUAL REPORT 2008 KENSHIN ANNUAL REPORT 2008

6.indd
 page 37 page 4 page 14 page 30 3 4 6 8 11 13 14 17 19 22 26 27 30 33 34 37 38 4 // CT * CT * * * 1 // 5 2 6 // 2 // 7 3.5 3.9 3.9 3.5 4.3 5.0 RP NP 3.5 3.5 3.0 8.5 10 11.5 13 15 18 RP 3.9 4.3 5.0 3.4
01 カラーリバーサル現像 NEW
 ブローニー 6 6 6 4.5 ブローニー 6 7 6 8 9 ブローニー 6 6 6 4.5 ブローニー 6 7 6 8 9 ブローニー 6 6 6 4.5 ブローニー 6 7 6 8 9 2339 1654 3307 2339 4000 2803 3291 2677 3441 4252 4000 6000 3803 2591 1362 945 1630 1268 1929 1543 2323

15690B_表紙1-4.pdf
 ISO 14001 ISO 13485:2003 0086 Beautiful Teeth Now...4...5...6...7...8...9...9...10...10....11...11...12...13...14...17...18...23...24...29 1...30 2...32 3...33 4...34...35...39 3 beautiful teeth now 2


1 SHIMA SEIKI Annual Report 218
 Ever Onward 1 SHIMA SEIKI Annual Report 218 1 2 3 4 5 SHIMA SEIKI Annual Report 218 2 1964 1978 1995 * 2 1964 1978 3 SHIMA SEIKI Annual Report 218 * * New 1995 2 SHIMA SEIKI Annual Report 218 4 5 SHIMA
(6) (111) (148) (129) (169) CAPCOM ANNUAL REPORT
 (111) (148) (129) (169) CAPCOM ANNUAL REPORT") 62 63 65 69 71 72 73 74 91 61 CAPCOM ANNUAL REPORT 213 22 26 276 143 92 13 113 73 122 (6) (111) (148) (129) (169) 23 24 25 27 28 29 21 211 212 213 CAPCOM ANNUAL REPORT 213 62 63 CAPCOM ANNUAL REPORT 213
62 63 65 69 71 72 73 74 91 61 CAPCOM ANNUAL REPORT 213 22 26 276 143 92 13 113 73 122 (6) (111) (148) (129) (169) 23 24 25 27 28 29 21 211 212 213 CAPCOM ANNUAL REPORT 213 62 63 CAPCOM ANNUAL REPORT 213
untitled
 Q&A Q Q Q Q Q Q Q Q Q Q Q Q Q Q Q Q Q Q Q Q Q -88- 1 Q 3,000 4,500 3,000 P.110-89- Q 3,000 4,500 3,000 4,500 3-90- 7 21 2,500 4,500 5,000-91- Q 2,500 5,000 2,500 5,000-92- 3,000 4,500 2,500 5,000 2,600
IPR INGO 2, 3 1 1 1962 IPR INGO IPR INGO IPR IPR 1929 3 2 1 IPR IPR 3 1 1928 IPR IPR IPR IPR IPR IPR IPR IPR IPR 3 181
 10 40 The Institute of Pacific Relations IPR IPR 30 40 52 9 IPR 3 IPR IPR 180 IPR INGO 2, 3 1 1 1962 IPR INGO IPR INGO IPR IPR 1929 3 2 1 IPR IPR 3 1 1928 IPR IPR IPR IPR IPR IPR IPR IPR IPR 3 181 2 5

KDDI Annual Report 2002
 pg.22 KDDI CORPORATION Annual Report $ 515 3,610 (194) 734 247 275 5,187 21,239 3,607 975 483 1,081 141 27,526 (12,882) 14,644 489 298 1,833 460 378 842 (90) 4,210 $24,041 68,596 481,064 (25,793) 97,797
untitled
 .. 1 2000 2010 +43%+16%+15%+13% +11% +10%+8% +1% +0.4% 100.0 80.0 60.0 % 40.0 20.0 80.3 9.0 70.3 9.1 67.9 9.9 85 9.8 150.0 100.0 50.0 119.1 10.7 92.4 9.6 73.5 8.0 60.7 9.5 100.0 80.0 60.0 40.0 20.0 54.0
2010年愛知教育大学年次報告書
 Annual Report Aichi University of Education 875 (3)1764 (5)2357 (8)4121 4.71 (2)1332 (4)1602 (6)2934 3.35 462 (2)578 (2)1040 439 (2)548 (2)987 643 1239 (1)1443 (1)2682 4.17 950 (1)1024 (1)1974


untitled
 . B to C B to C EC 645 20 3,360 1,740 8,240 3,780 14,840 6,730 26,850 11,870 B to C 44,240 15,150 1. 2. 3. 4. 5. 6. 1. 2. 3. 4. 5. 1. 2. 3. ( Edy Mobile Edy Edy 20675050 179086.9 Edy
4% P % 11.1%1, % %1, %1, % 3.5%1, % %1, % Santen Ph
 Financial Section 11 5 54 56 58 59 6 63 http://www.santen.co.jp/ja/ir/document/securities.jsp Santen Pharmaceutical Co., Ltd. Annual Report 215 49 4% 215 3 214 3 P.8 2 98.4% 11.1%1,592 62 12.6% 25 69 1.6%1,618
c3 FAST RETAILING ANNUAL REPORT 2006
 c3 FAST RETAILING ANNUAL REPORT 2006 FAST RETAILING ANNUAL REPORT 2006 c4 2 FAST RETAILING ANNUAL REPORT 2006 FAST RETAILING ANNUAL REPORT 2006 3 4 FAST RETAILING ANNUAL REPORT 2006 FAST RETAILING ANNUAL
アニュアルレポート2018
 ANNUAL REPORT 2018 Contents 001 009 110 001 a. 2017 3 31 2018 3 31 2018 3 31................................................................................ 8 2,183,102 3,334,650 $ 31,387,895...........................................................................
P.7 56
 Financial Section http://www.santen.co.jp/ja/ir/document/securities.jsp 55 P.7 56 57 57 58 59 60 60 61 2006 2007 2008 2009 98,398 100,486 103,394 101,619 34,535 35,484 36,513 35,947 28,897 30,926 33,569


010_9553901302406.indd
 2011 WDB REPORT CONTENTS 1 WDB Holdings co.,ltd. Annual Report 2011 2 WDB Holdings co.,ltd. Annual Report 2011 3 WDB Holdings co.,ltd. Annual Report 2011 4 WDB Holdings co.,ltd. Annual Report 2011 5 WDB

LIFULL アニュアルレポート 2017
 LIFULL LIFULL ANNUAL REPORT 2017 Contents 2 4 6 12 16 Vision and Strategy 18 LIFULL 20 LIFULL Value Model 22 22 24 26 28 28 30 30 34 CFO&CSO Fact Data 38 40 3 41 42 44 45 2017 4 1 LIFULL ANNUAL REPORT
2 24
 J-REIT 2012/05/18 2 24 J-REIT 3 J-REIT 2001 9J-REIT10 2007 J-REIT7 42 42 33 2010 2 3 J-REIT 22012 4 IPO 4 343.5 4 J-REIT10 3000.00 2500.00 REIT TOPIX 2000.00 1500.00 1000.00 NCR(*) 2010/6 500.00 2001/9
 ;;; ;;; ;; ;; ;; ;; ;; ;; ;; ;; ;;;; ;;;; ;;;; ;;;;; ;;;; ;;;; ;;;; The World Bank Annual Report World Development

卒論 提出用ファイル.doc
 11 13 1LT99097W (i) (ii) 0. 0....1 1....3 1.1....3 1.2....4 2....7 2.1....7 2.2....8 2.2.1....8 2.2.2....9 2.2.3.... 10 2.3.... 12 3.... 15 Appendix... 17 1.... 17 2.... 19 3.... 20... 22 (1) a. b. c.

1 Copyright 2017 JAPAN POST INSURANCE Co.,Ltd. All Rights Reserved. 1
 20183 2017 11 20 1 Copyright 2017 JAPAN POST INSURANCE Co.,Ltd. All Rights Reserved. 1 1956219 19794 20078 20126 20136 20137 20144 20156 20176 Copyright 2017 JAPAN POST INSURANCE Co.,Ltd. All Rights Reserved.
untitled
 4 4 14 1. 2. 20 20 1. 2. 3. 24 1. 2. 3. 4. 5. 33 1. 2. 38 1. 2. 3. 4. 5. 6. 49 1. 2. 3. -1/176- 60 60 1. 2. 3. 4. 5. 70 1. 2. 3. 4. 5. 98 98 1. 2004 2008 2. 3. 109 1. 2. 3. 4. 5. 6. 7. 8. 120 1. 2. -2/176-


- 1 -
 - 1 - - 2 - - 3 - - 4 - - 5 - - 6 - - 7 - - 8 - - 9 - - 10 - - 11 - - 12 - - 13 - - 14 - - 15 - - 16 - - 17 - - 18 - - 19 - - 20 - - 21 - - 22 - - 23 - - 24 - - 25 - - 26 - EC NEC - 27 - NEC - 28 - R NEC
日立評論2009年6月号 : 開拓者たちの系譜 13
 Vol.91 No.06 478-479 100 13 1 1970 40 HDD Hard Disk Drive HDD 20 HDD 2 1970 1 1968 4 2009.06 1945 1970 1999 2000 Hitachi Data Systems CEO 2003 Hitachi Global Storage Technologies CEO 2006 special contribution
2015 contents
 2015 contents I N R R R R R R R R OUT I N OUT R R R R R R 1 1 67 64 35 40 New 37.5 C ite Report ite Report ite Report ite Report ite Report ite Report ite Report ite Report ite Report
1 2 20163 Copyright 2015 JAPAN POST GROUP. All Rights Reserved. 1
 20163 20151120 1 2 20163 Copyright 2015 JAPAN POST GROUP. All Rights Reserved. 1 1 Copyright 2015 JAPAN POST GROUP. All Rights Reserved. 2 99 2 1916 2007 1.3 3,300 85 2,5002 2 2014320153 Copyright 2015
DocuPrint C5450 ユーザーズガイド
 1 2 3 4 5 6 7 8 1 10 1 11 1 12 1 13 1 14 1 15 1 16 17 1 1 18 1 19 1 20 1 21 1 22 1 23 1 24 1 25 1 26 27 1 1 28 1 29 1 30 1 31 1 2 12 13 3 2 10 11 4 9 8 7 6 5 34 24 23 14 15 22 21 20 16 19 18 17 2 35
What s GGC GLOBAL GATEWAY CLUB GLOBAL GATEWAY CLUB 1 2
 56,000 1,000 48,000 GLOBAL GATEWAY CLUB http://global-gateway-club.com Global Gateway Ltd.Global Asia Investment Ltd. What s GGC GLOBAL GATEWAY CLUB GLOBAL GATEWAY CLUB 1 2 Molek Pine3Molek Pine4Ponderosa
8 8 2012 PB 8 8 PB PB PB PB 1
 2013 4 26 Vol.127 8 shingo.tanaka@mizuho-cb.co.jp BtoC 3 8 2011 8 8 8 8 2012 PB 8 8 PB PB PB PB 1 2012 PB NB PB 2012 BtoC 2013 3 15 TPP 1 3 3 1998 31.9 1998 28.7 2006 2 2006 2006 2012 2008 31.4 2011 2012

IBM Watson EV Copyright 2016 JAPAN POST GROUP. All Rights Reserved. 1
 2016 3 2016 5 20 1 100 2016 3 2 2016 3 IBM Watson EV Copyright 2016 JAPAN POST GROUP. All Rights Reserved. 1 1 Copyright 2016 JAPAN POST GROUP. All Rights Reserved. 2 100 1916 100 100100 100 100 ( 4 )
”‚’¶fi° JAR 97 Ł\”ƒ-1
 1997 1996 1995 588,572 42,898 19,152 560,821 37,012 17,507 540,361 26,490 11,382 1997 5,118,017 373,026 166,539 436,705 94,610 57,257 404,181 101,675 54,965 387,314 97,606 55,441 3,797,435 822,695 497,887
 I? 3 1 3 1.1?................................. 3 1.2?............................... 3 1.3!................................... 3 2 4 2.1........................................ 4 2.2.......................................


 20 15 14.6 15.3 14.9 15.7 16.0 15.7 13.4 14.5 13.7 14.2 10 10 13 16 19 22 1 70,000 60,000 50,000 40,000 30,000 20,000 10,000 0 2,500 59,862 56,384 2,000 42,662 44,211 40,639 37,323 1,500 33,408 34,472

- 2 -
 - 2 - - 3 - (1) (2) (3) (1) - 4 - ~ - 5 - (2) - 6 - (1) (1) - 7 - - 8 - (i) (ii) (iii) (ii) (iii) (ii) 10 - 9 - (3) - 10 - (3) - 11 - - 12 - (1) - 13 - - 14 - (2) - 15 - - 16 - (3) - 17 - - 18 - (4) -
2 1980 8 4 4 4 4 4 3 4 2 4 4 2 4 6 0 0 6 4 2 4 1 2 2 1 4 4 4 2 3 3 3 4 3 4 4 4 4 2 5 5 2 4 4 4 0 3 3 0 9 10 10 9 1 1
 1 1979 6 24 3 4 4 4 4 3 4 4 2 3 4 4 6 0 0 6 2 4 4 4 3 0 0 3 3 3 4 3 2 4 3? 4 3 4 3 4 4 4 4 3 3 4 4 4 4 2 1 1 2 15 4 4 15 0 1 2 1980 8 4 4 4 4 4 3 4 2 4 4 2 4 6 0 0 6 4 2 4 1 2 2 1 4 4 4 2 3 3 3 4 3 4 4
野村資本市場研究所|拡大するタイの住宅金融(PDF)
") 2013 Spring 1. 81 2004 79 2008 2010 10 6,893 10 2011 1 2. 25 15 5 4,000 3. 2006 2001 6,875 2011 2 368 3 2011 6 3 GDP 2011 1943 3836 4. 2010 5 2 5,000 90 30 3 3 5. RMBS 126 2012 ASEAN IMF GDP 2001 1,155
2013 Spring 1. 81 2004 79 2008 2010 10 6,893 10 2011 1 2. 25 15 5 4,000 3. 2006 2001 6,875 2011 2 368 3 2011 6 3 GDP 2011 1943 3836 4. 2010 5 2 5,000 90 30 3 3 5. RMBS 126 2012 ASEAN IMF GDP 2001 1,155
<836D815B B E95E292D48AD BB A835E838D834F5F4D4B D8CB32E706466>
 ノーベルエステティック補綴関連製品 カタログ & 価格表 価格改定2015.04 re.jp ンストア elbioca オンライ re.nob /sto https:/ 3 4 6 10 12 14 / 16 20 24 28 30 / 36 38 42 44 / & 46 & 49 50 58 & 59 61 62 63 64 66 74 82 & 92 94 96 4 // 3 6 12 CC