untitled
|
|
|
- えりか たもん
- 7 years ago
- Views:
Transcription
1

2

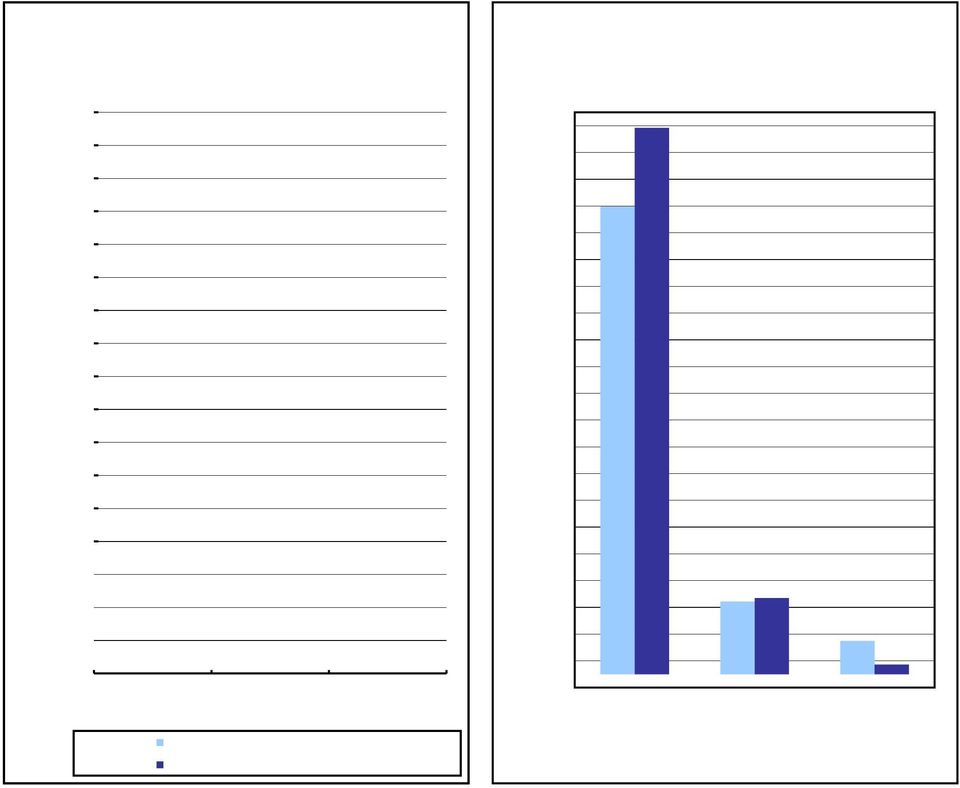
3 業 績 ハイライト Financial Highlights 本 表 記 載 の 内 容 については15ページ 記 載 の 注 釈 を 必 ずお 読 み 下 さい Information herein should be read in conjunction with the notes on page 15. 尚 このページのグラフで 示 した 各 会 計 年 度 の 数 値 は それぞれ 以 下 の 財 務 データに 基 づくものです The financial figures shown in the graphs on this page are based on the following financial information: 2003 年 3 月 期 : 結 合 財 務 情 報 Fiscal year ended March 2003: Combined statement of income 2004 年 3 月 期 : 調 整 後 連 結 損 益 計 算 書 Fiscal year ended March 2004: Adjusted consolidated statement of income 2005 年 3 月 期 2006 年 3 月 期 2007 年 3 月 期 : 連 結 損 益 計 算 書 Fiscal year ended March 2005, March 2006 and March 2007: Consolidated statement of income ( 百 万 円 Millions of yen) 売 上 高 Billings 売 上 総 利 益 Revenue 売 上 総 利 益 率 Gross margin 営 業 利 益 Operating income 1,200,000 1,000, , , , , ,033,220 1,044,773 1,089,524 1,111,121 1,088, 年 3 月 期 04 年 3 月 期 05 年 3 月 期 06 年 3 月 期 07 年 3 月 期 March '03 March '04 March '05 March '06 March '07 175, , , ,000 75,000 50,000 25, , , , , , 年 3 月 期 04 年 3 月 期 05 年 3 月 期 06 年 3 月 期 07 年 3 月 期 March '03 March '04 March '05 March '06 March ' % 10.0% 5.0% 0.0% 13.3% 03 年 3 月 期 March '03 04 年 3 月 期 March ' % 13.9% 14.0% 05 年 3 月 期 March '05 06 年 3 月 期 March ' % 07 年 3 月 期 March '07 30,000 25,000 20,000 15,000 10,000 5, ,345 17,762 22,393 24,710 24, 年 3 月 期 04 年 3 月 期 05 年 3 月 期 06 年 3 月 期 07 年 3 月 期 March '03 March '04 March '05 March '06 March '07 オヘ レーティンク マーシ ン Operating margin 経 常 利 益 Ordinary income 当 期 純 利 益 Net income 自 己 資 本 利 益 率 Return on equity 15.0% 10.0% 5.0% 8.3% 12.3% 14.8% 15.8% 15.4% 30,000 25,000 20,000 15,000 10,000 5,000 11,204 17,595 22,842 25,782 26,928 14,000 12,000 10,000 8,000 6,000 4,000 2,000 1,828 4,218 10,390 11,313 12, % 6.0% 4.0% 2.0% < 2.6% > < 1.1% > 5.7% 5.8% 5.8% 0.0% 03 年 3 月 期 04 年 3 月 期 05 年 3 月 期 06 年 3 月 期 07 年 3 月 期 March '03 March '04 March '05 March '06 March ' 年 3 月 期 04 年 3 月 期 05 年 3 月 期 06 年 3 月 期 07 年 3 月 期 March '03 March '04 March '05 March '06 March ' 年 3 月 期 04 年 3 月 期 05 年 3 月 期 06 年 3 月 期 07 年 3 月 期 March '03 March '04 March '05 March '06 March '07 0.0% 03 年 3 月 期 March '03 04 年 3 月 期 March '04 05 年 3 月 期 March '05 06 年 3 月 期 March '06 07 年 3 月 期 March ' 年 3 月 期 の 結 合 財 務 情 報 及 び2004 年 3 月 期 の 調 整 後 連 結 損 益 計 算 書 の 自 己 資 本 利 益 率 は いずれも 貸 借 対 照 表 がないため 2004 年 3 月 期 の 連 結 損 益 計 算 書 の 自 己 資 本 利 益 率 の 計 算 に 使 用 した 自 己 資 本 額 を 元 に 算 出 した 参 考 値 となります Returns on equity of the combined statement of income for the fiscal year ended March 31, 2003 and the adjusted consolidated statement of income for the fiscal year ended March 31, 2004 are provided for reference, and were calculated using the shareholders' equity for the consolidated statement of income for the fiscal year ended March 31, 2004 because the balance sheets for these statements of income were not prepared. 1
 売 上 高 Billings 売 上 総 利 益 Revenue 売 上 総 利 益 率 Gross margin 営 業")
4

5

6 四 半 期 毎 の 主 要 連 結 財 務 データ Quarterly Consolidated Financial Information (2) 連 結 損 益 計 算 書 の 主 要 項 目 Main items of consolidated statements of income 2007 年 3 月 期 Fiscal year ended March 2007 ( 百 万 円 Millions of yen) 第 1 四 半 期 第 2 四 半 期 上 期 第 3 四 半 期 第 3 四 半 期 累 計 第 4 四 半 期 下 期 通 期 1Q 1 2Q 2(=3-1) 1H 3 3Q 4(=5-3) 売 上 高 Billings 248, % 258, % 506, % 280, % 787, % 300, % 581, % 1,088, % 売 上 総 利 益 Revenue 34, % 37, % 72, % 41, % 113, % 45, % 86, % 158, % 販 管 費 Selling, general and administrative expenses 31, % 32, % 64, % 32, % 97, % 36, % 69, % 134, % 内 人 件 費 Including personnel costs 20, % 20, % 41, % 20, % 61, % 22, % 43, % 84, % 営 業 利 益 Operating income 2, % 4, % 7, % 8, % 15, % 8, % 17, % 24, % 営 業 外 損 益 Non-operating items % % % % 1, % 1, % 1, % 2, % 経 常 利 益 Ordinary income 3, % 4, % 8, % 9, % 17, % 9, % 18, % 26, % 特 別 利 益 Extraordinary gains % 1, % 1, % % 1, % (26) (5) 1, % 特 別 損 失 Extraordinary losses % 2, % 2, % % 2, % 4, % 4, % 6, % 税 金 等 調 整 前 当 期 純 利 益 Income before income taxes and minority interests 3, % 3, % 6, % 8, % 15, % 5, % 14, % 21, % 当 期 純 利 益 Net income 1, % 2, % 3, % 5, % 8, % 3, % 8, % 12, % Accum.3Q 5 4Q 6(=8-5) 2H 7(=8-3) Fiscal year 8 売 上 総 利 益 率 Gross margin 人 件 費 の 対 売 上 総 利 益 率 Ratio of personnel costs to revenue オヘ レーティンク マーシ ン Operating margin 14.0% 0.5% 14.4% 0.3% 14.2% 0.4% 14.7% 0.4% 14.4% 0.4% 15.1% 0.9% 14.9% 0.7% 14.6% 0.6% 59.6% 0.4% 55.0% 1.4% 57.2% 0.9% 49.9% -1.4% 54.6% 0.1% 49.4% -0.2% 49.6% -0.8% 53.1% 0.0% 8.4% -2.1% 11.7% -3.3% 10.1% -2.7% 20.7% 2.1% 14.0% -0.9% 19.0% 0.7% 19.8% 1.4% 15.4% -0.4% 2006 年 3 月 期 Fiscal year ended March 2006 ( 百 万 円 Millions of yen) 第 1 四 半 期 第 2 四 半 期 上 期 第 3 四 半 期 第 3 四 半 期 累 計 第 4 四 半 期 下 期 通 期 1Q 1 2Q 2(=3-1) 1H 3 3Q 4(=5-3) 売 上 高 Billings 257, % 262, % 519, % 281, % 801, % 309, % 591, % 1,111, % 売 上 総 利 益 Revenue 34, % 36, % 71, % 40, % 112, % 43, % 84, % 155, % 販 管 費 Selling, general and administrative expenses 31, % 31, % 62, % 32, % 95, % 35, % 68, % 131, % 内 人 件 費 Including personnel costs 20, % 19, % 40, % 20, % 61, % 21, % 42, % 82, % 営 業 利 益 Operating income 3, % 5, % 9, % 7, % 16, % 8, % 15, % 24, % 営 業 外 損 益 Non-operating items % % % % % % % 1, % 経 常 利 益 Ordinary income 3, % 5, % 9, % 7, % 17, % 8, % 16, % 25, % 特 別 利 益 Extraordinary gains % % % % % % % % 特 別 損 失 Extraordinary losses % % 1, % % 1, % 1, % 2, % 3, % 税 金 等 調 整 前 当 期 純 利 益 Income before income taxes and minority interests 3, % 5, % 8, % 7, % 15, % 6, % 14, % 22, % 当 期 純 利 益 Net income 1, % 2, % 4, % 4, % 9, % 2, % 7, % 11, % 売 上 総 利 益 率 Gross margin 人 件 費 の 対 売 上 総 利 益 率 Ratio of personnel costs to revenue オヘ レーティンク マーシ ン Operating margin Accum.3Q 5 4Q 6(=8-5) 2H 7(=8-3) 13.5% -0.4% 14.1% -0.2% 13.8% -0.3% 14.3% 0.2% 14.0% -0.1% 14.2% 0.7% 14.2% 0.4% 14.0% 0.1% 59.2% 1.0% 53.6% 1.4% 56.3% 1.2% 51.3% 1.1% 54.5% 1.2% 49.6% -2.9% 50.4% -1.0% 53.1% 0.0% 10.4% -0.1% 15.0% -1.7% 12.8% -1.0% 18.6% -1.7% 14.9% -1.2% 18.3% 7.1% 18.4% 2.8% 15.8% 1.1% 1 第 1 四 半 期 及 び 第 3 四 半 期 については 会 計 監 査 を 受 けておりません 2 売 上 総 利 益 率 人 件 費 の 対 売 上 総 利 益 率 オヘ レーティンク マーシ ンの は 前 年 数 値 との 差 を 記 載 しております 1 Figures for the first quarter and the third quarter have not been audited. 2 of Gross margin, Ratio of personnel costs to revenue and Operating margin are stated as the differences from the figures of the previous year. Fiscal year 8 4

7

8

9 Change % Change % Change % Education/Medical services/religion Billings of other consolidated subsidiaries, etc.

10 Change % Change % Change % Change % Change % Education/Medical services/religion Billings of other consolidated subsidiaries, etc.

11 Accum.3Q Energy/Material/Machinery Change % Change % Change % Change % Change % Change % Change % Change % Foodstuffs Beverages/Cigarettes/Luxury foods Pharmaceuticals/Medical supplies Cosmetics/Toiletries Apparel/Accessories Precision machinery/office supplies Home electric appliances/av equipment Automobiles/Related products Household products Hobby supplies/sporting goods Real estate/housing facilities Publications Information/Communications Distribution/Retailing Finance/Insurance Transportation/Leisure Restaurant/Services Government/Organizations Education/Medical services/religion Classified advertising/other Subtotal Billings of other consolidated subsidiaries, etc. Consolidated billings 1 Billings in each category are the sum of the non-consolidated billings of Hakuhodo, Daiko, Yomiko and Hakuhodo DY Media Partners (after exclusion of internal billings from Hakuhodo, Daiko and Yomiko to Hakuhodo DY Media Partners). Overlaps resulting from the combination of these billings are included in the Billings of other consolidated subsidiaries, etc. item. 2 Billings of other consolidated subsidiaries, etc. is the total of billings of domestic and overseas consolidated advertising companies that are not included in the advertising segment listed in 1 above and sales of consolidated subsidiaries in the others segment. 3 Above figures are the ones controlled inside the company, and thus are not audited.

12 1 Billings in each category are the sum of the non-consolidated billings of Hakuhodo, Daiko, Yomiko and Hakuhodo DY Media Partners (after exclusion of internal billings from Hakuhodo, Daiko and Yomiko to Hakuhodo DY Media Partners). Overlaps resulting from the combination of these billings are included in the "Billings of other consolidated subsidiaries, etc." item. 2 "Billings of other consolidated subsidiaries, etc." is the total of billings of domestic and overseas consolidated advertising companies that are not included in the advertising segment listed in 1 above and sales of consolidated subsidiaries in the others segment. 3 "Shares" are described as ratio against "Subtotal" which does not include "Billings of other consolidated subsidiaries, etc." 4 "Newspapers", "Magazines", "Radio" and "Television" are the total expenses for placement of domestic and export advertising."television" includes advertising expenses for CS/BS media related. 5 Internet media are the transactions for placement of advertising spots on the Internet and cell phones. However, transactions concerned with creating and producing advertisements for the Internet and cell phones are included in Creative. 6 Outdoor media is the total of space charge and production billings involving outdoor advertising, train and other transportation advertising, insertions and other advertising media. 7 Creative includes billings for creating and producing advertisements for newspapers, magazines, radio, television and the Internet, including contract money for advertising performers. 8 Marketing/promotion includes transactions concerned with consulting, planning and surveys in the marketing, communication and brand management domains, and other consulting, planning and implementation transactions in such areas as sales promotion, special events, public relations and customer relationship management. 9 Others includes transactions concerned with sports, entertainment and other similar content. 10 Above figures are the ones controlled inside the company, and thus are not audited.

13 1 'Billings have been categorized as described above beginning with the current fiscal year. These categories may differ from the categories in prior fiscal years. Above figures for the fiscal ended March 2006 are based on the new categories respectively. 2 Please see the notes on page 8.

14 1 Billings in each category are the sum of the non-consolidated billings of Hakuhodo, Daiko, Yomiko and Hakuhodo DY Media Partners (after exclusion of internal billings from Hakuhodo, Daiko and Yomiko to Hakuhodo DY Media Partners). Overlaps resulting from the combination of these billings are included in the "Billings of other consolidated subsidiaries, etc." item. 2 "Shares" are described as ratio against "Subtotal" which does not include "Billings of other consolidated subsidiaries, etc." 3 "Newspapers", "Magazines", "Radio" and "Televisions" are the total expenses for placement of domestic and export advertising. 4 "Billings of other consolidated subsidiaries, etc." is the total of billings of domestic and overseas consolidated advertising companies that are not included in the advertising segment listed in 1 above and sales of consolidated subsidiaries in the others segment. 5 Billings involving BS/CS broadcasts are included in the television category of mass media services. 6 "Sales promotion" is the total of production and space charge expenses involving direct mail, insertions, outdoor advertising, train and other transportation advertising, POP (Point of Purchase) advertising materials, telephone directories and other advertising media. 7 Above figures are the ones controlled inside the company, and thus are not audited.

15
16 主 要 3 広 告 会 社 の 状 況 Information of Three Main Advertising Agencies 3 広 告 会 社 の 連 結 業 績 の 概 要 ( 続 き) Financial Outline of the Three Advertising Agencies (Consolidated) (continued) 2007 年 3 月 期 Fiscal year ended March 2007 ( 百 万 円 Millions of yen) 第 1 四 半 期 第 2 四 半 期 上 期 第 3 四 半 期 第 3 四 半 期 累 計 第 4 四 半 期 下 期 通 期 1Q 1 2Q 2(=3-1) 1H 3 3Q 4(=5-3) 1. 株 式 会 社 博 報 堂 ( 連 結 ) Hakuhodo Inc.-consolidated 売 上 高 Billings 188, % 195, % 383, % 213, % 597, % 221, % 434, % 818, % 経 常 利 益 Ordinary income 4, % 3, % 7, % 7, % 14, % 5, % 12, % 20, % 当 期 純 利 益 Net income 2, % 1, % 4, % 4, % 8, % 1, % 6, % 10, % 2. 株 式 会 社 大 広 ( 連 結 ) Daiko Advertising Inc.-consolidated 売 上 高 Billings 39, % 40, % 80, % 43, % 123, % 45, % 88, % 169, % 経 常 利 益 Ordinary income % % 1, % 1, % 2, % % 1, % 2, % 当 期 純 利 益 Net income % % % % 1, % 144 n/a % 1, % 3. 株 式 会 社 読 売 広 告 社 ( 連 結 ) Yomiko Advertising Inc.-consolidated 売 上 高 Billings 19, % 22, % 41, % 23, % 64, % 31, % 54, % 96, % 経 常 利 益 Ordinary income (397) n/a % (372) n/a (106) n/a (478) n/a % % % 当 期 純 利 益 Net income (136) n/a 22 n/a (114) n/a (54) n/a (168) n/a % % 49 n/a Accum.3Q 5 4Q 6(=8-5) 2H 7(=8-3) Fiscal year 年 3 月 期 Fiscal year ended March 2006 ( 百 万 円 Millions of yen) 第 1 四 半 期 第 2 四 半 期 上 期 第 3 四 半 期 第 3 四 半 期 累 計 第 4 四 半 期 下 期 通 期 1Q 1 2Q 2(=3-1) 1H 3 3Q 4(=5-3) 1. 株 式 会 社 博 報 堂 ( 連 結 ) Hakuhodo Inc.-consolidated 売 上 高 Billings 191, % 190, % 381, % 211, % 593, % 225, % 437, % 819, % 経 常 利 益 Ordinary income 3, % 2, % 6, % 6, % 12, % 4, % 11, % 17, % 当 期 純 利 益 Net income 1, % 1, % 3, % 4, % 7, % % 4, % 8, % 2. 株 式 会 社 大 広 ( 連 結 ) Daiko Advertising Inc.-consolidated 売 上 高 Billings 42, % 44, % 86, % 47, % 134, % 47, % 94, % 181, % 経 常 利 益 Ordinary income % 1, % 1, % % 2, % % 1, % 2, % 当 期 純 利 益 Net income % 822 n/a 962 n/a % 1,308 n/a (134) % % 1, % 3. 株 式 会 社 読 売 広 告 社 ( 連 結 ) Yomiko Advertising Inc.-consolidated 売 上 高 Billings 23, % 25, % 49, % 25, % 75, % 28, % 54, % 103, % 経 常 利 益 Ordinary income 55 n/a % % % % % % 1, % 当 期 純 利 益 Net income (373) n/a (211) n/a (584) n/a % (480) n/a % % (150) n/a 1 このページに 記 載 している( 株 ) 博 報 堂 ( 株 ) 大 広 ( 株 ) 読 売 広 告 社 の 各 社 の 連 結 数 値 は 社 内 管 理 上 の 集 計 数 値 で 個 々に 監 査 を 受 けておりません 1 The consolidated results on this page for Hakuhodo, Daiko and Yomiko are aggregate figures controlled inside the companies, and thus are not individually audited. Accum.3Q 5 4Q 6(=8-5) 2H 7(=8-3) Fiscal year 8 14

17

18

19

20

untitled
 2 0 0 9 3 FY08 2Q Statements of Income Consolidated Basis Cost of sales before inventory write-down Inventory write-down 07.9 08.9 JPY in Millions Sales 33,792 31,896 31,718 93.9 99.4 Cost of sales Gross
FINANCIAL FACT BOOK 2002 CONTENTS CONTENTS Sales Data Net Sales Sales Composition Sales by Region Profit Data Cost Composition & Operating Income/Net
 FINANCIAL FACT BOOK 2002 FINANCIAL FACT BOOK 2002 CONTENTS CONTENTS Sales Data Net Sales Sales Composition Sales by Region Profit Data Cost Composition & Operating Income/Net Sales Gross Profit Margin
2016年2月期 決算説明会 スライド資料
 決 算 説 明 資 料 Detailed Financial Data 平 成 27 年 3 月 1 日 ~ 平 成 28 年 2 月 29 日 ~ Feb. 29. 2016~ 株 式 会 社 チヨダ 目 次 CONTENTS 決 算 概 要 P.1~ (Financial Summary) 売 上 高 の 推 移 P.3 (Sales Trends Compared with Same Month
IDEC Report 2015 IDEC Report 2015
 IDEC Report2015 IDEC Report2015 Top Message Index Corporate Profile 02 Technology Report 17 Annual Report 19 CSR Report 29 Corporate Data 35 IDEC Report01 02 Top Message 42,173 26,529 16.1 14.8 15,644
スライド 1
 2016 年 3 月期 第 3 四半期決算発表資料 Financial Report For The Fiscal Year 2016 Third Quarter 2016 年 1 月 29 日 ゼビオホールディングス株式会社 XEBIO Holdings CO., LTD.(8281) 1 2016 年 3 月期第 3 四半期決算概況 Outline of Financial Results 第
YUHO
 -1- -2- -3- -4- -5- -6- -7- -8- -9- -10- -11- -12- -13- -14- -15- -16- -17- -18- -19- -20- -21- -22- -23- -24- -25- -26- -27- -28- -29- -30- -31- -32- -33- -34- -35- -36- -37- -38- -39- -40- -41- -42-
Safe harbor statement under the Private Securities Litigation Reform Act of 1995: This presentation may contain forward-looking statements that involv
 /mokamoto @mitsuhiro in/mitsuhiro Safe harbor statement under the Private Securities Litigation Reform Act of 1995: This presentation may contain forward-looking statements that involve risks, uncertainties,
Salesforce DX.key
 Salesforce DX とは? Salesforceの開発生産性向上のための新機能 Mitsuhiro Okamoto Senior Developer Evangelist Trail blazer @mitsuhiro mokamoto@salesforce.com Forward-Looking Statements Statement under the Private Securities
Ł\”ƒ.eps
 P1 P4 P2 P7 P8 Consolidated balance sheet Consolidated statement of income Consolidated statement of shareholders' equity Consolidated statement of cash flows 1 $5,644,73 262,387 146,72.27 8.2 11,436,433
Business Groups at a Glance Delivery: Small-parcel delivery services such as Takkyubin (door-to-door parcel delivery) and Kuroneko Mail BIZ-Logistics:
 and Kuroneko Mail BIZ-Logistics:") Financial Highlights (Consolidated) millions Operating Margin 1,5, 12 1,25, Operating Revenues Operating Margin 1 1,, 8 75, 6 5, 4 25, 2 932,12 972,135 1,11,343 1,71,93 1,144,96 1,161,567 1,225,973 1,251,921
Financial Highlights (Consolidated) millions Operating Margin 1,5, 12 1,25, Operating Revenues Operating Margin 1 1,, 8 75, 6 5, 4 25, 2 932,12 972,135 1,11,343 1,71,93 1,144,96 1,161,567 1,225,973 1,251,921
ANNUALREPORT2011
 5 / 5.1 5 078 5.2 079 5.3 082 5.4 089 5.5 097 5.6 / 100 5.7 117 5.8 118 5.9 120 5.10 121 / 20072008200920102011 3 31 3 31 2007 2008 2009 2010 2011 969,713 1,202,965 1,076,165 840,427 943,080 607,401 783,465
PowerPoint Presentation
 Safe harbor statement under the Private Securities Litigation Reform Act of 1995: This presentation may contain forward-looking statements that involve risks, uncertainties, and assumptions. If any such
Contents 3 Financial Highlights (Consolidated) Consolidated Balance Sheets Financials in comparison with competitors (Consolidated Consolid
 Consolidated Balance Sheets Financials in comparison with competitors (Consolidated Consolid") Facts and Figures 25 Contents 3 Financial Highlights (Consolidated) Consolidated Balance Sheets 13 14 4 15 Financials in comparison with competitors (Consolidated Consolidated Statements of Income Orders
Facts and Figures 25 Contents 3 Financial Highlights (Consolidated) Consolidated Balance Sheets 13 14 4 15 Financials in comparison with competitors (Consolidated Consolidated Statements of Income Orders
TECMO,LTD. 2003
 TECMO,LTD. 2003 Net sales by Divisions Operating income by Divisions 2004/3/31 Amount 2003/3/31 Amount Comparative increase or decrease (denotes minus) Subject 2004/3/31 Amount 2003/3/31 Amount Comparative
フィナンシャル ファクトブック 2015/3
 Financial Fact Book 2015/3 財 務 ハイライト Financial Highlights... 連 結 Consolidated 日 本 会 計 基 準 (JGAAP) 国 際 会 計 基 準 (IFRS) 3 月 3 1 日 に 終 了 した 会 計 年 度 Years ended March 31 2013/3 2014/3 2015/3 2014/3 2015/3 売
ユーザーズマニュアル
 1 2 3 4 This product (including software) is designed under Japanese domestic specifications and does not conform to overseas standards. NEC *1 will not be held responsible for any consequences resulting
 Contents FY2011 Highlight Financial Data Business Outline Of ZOZOTOWN To Overseas Customers Business Outline Of Affiliated Companies About Us Appendix : Notice of the 14th Annual General Meeting of
TECMO,LTD. 2005
 TECMO,LTD. 2005 TECMO,LTD. 2005 NET CORPORATION TECMO,LTD. Team NINJA 2005 NET CORPORATION TECMO, LTD. HEIWA CORPORATION INOKI INT'L,INC. Copyright 2004 Okumura Yu-ki Co,Ltd. All Rights Reserved. NET
Microsoft Word - 2016年06月月次データ_総合
 経 済 動 向 分 析 ) 在 日 本 国 大 使 館 経 済 動 向 1) In the Q1 2016, a faster growth of wage costs was recorded, which entailed decrease of profitability of enterprises to 49.3%. Household real consumption per capita
損益計算書 Non-consolidated statement of income 2016 年度 /FY 年度 /FY2017 前年増減 Increase (Decrease) 百万円 /Million
 百万円 /Million") 主な業績と予想 Results and forecasts for major financial indicators 2016 年度 /FY2016 2017 年度 /FY2017 2018 年度 ( 計画 )/FY2018(Forecast) 通期 /Full year 2016.3.1-2017.2.28 通期 /Full year 2017.3.1-2018.2.28 第 2 四半期累計期間
主な業績と予想 Results and forecasts for major financial indicators 2016 年度 /FY2016 2017 年度 /FY2017 2018 年度 ( 計画 )/FY2018(Forecast) 通期 /Full year 2016.3.1-2017.2.28 通期 /Full year 2017.3.1-2018.2.28 第 2 四半期累計期間
元旦ビューティ工業株式会社
 第 45 期 中 間 株 主 通 信 2014 年 4 月 1 日 から 2014 年 9 月 30 日 まで ( 証 券 コード 5935) トップメッセージ ごあいさつ 45 2 26 4 1 26 9 30 2 2 4,681 4.0 2,975 0.4 1,705 11.0 14 49 36 40 305 13 50 50 26 12 1 財 務 ハイライト 期 末 数 値 第 2 四 半
Financial Fact Book 2015/12
 Financial Fact Book 2015/12 財 務 ハイライト Financial Highlights... 連 結 Consolidated 暦 年 ベース(プロフォーマ) 2014/3 2015/3 2015/12 2014 2015 (2013.4.1- (2014.4.1- (2015.4.1- (2014.1.1- (2015.1.1-2014.3.31) 2015.3.31)
Financial Highlights 7,92,326 9,287 7,38 3,994 93,438 2,27 3,28,84,97,8 26,336 8,8 8,27,243 77,99 23,72 49,676 4,7,992 9,429 7,48 3,939 9,67 3,82 37,2
 28 Financial Highlights 7,92,326 9,287 7,38 3,994 93,438 2,27 3,28,84,97,8 26,336 8,8 8,27,243 77,99 23,72 49,676 4,7,992 9,429 7,48 3,939 9,67 3,82 37,228,96 2,92 3,39,92 6,77 7,636 73,64 38,893,2 27,47
損益計算書 Non-consolidated statement of income 2017 年度第 1 四半期累計期間 2018 年度第 1 四半期累計期間前年増減 Increase (Decrease) 百万円 /Mi
 百万円 /Mi") 主な業績と予想 Results and forecasts for major financial indicators 2017 年度 /FY2017 2018 年度 /FY2018 第 1 四半期 /1Q 2017.3.1-2017.5.31 通期 /Full year 2017.3.1-2018.2.28 第 1 四半期 /1Q 2018.3.1-2018.5.31 通期計画 /Full year
主な業績と予想 Results and forecasts for major financial indicators 2017 年度 /FY2017 2018 年度 /FY2018 第 1 四半期 /1Q 2017.3.1-2017.5.31 通期 /Full year 2017.3.1-2018.2.28 第 1 四半期 /1Q 2018.3.1-2018.5.31 通期計画 /Full year
Financial Data 2012
 Financial Data 212 Contents 1 Performance Trends 3 Segment Information 6 Profitability 7 Efficiency 8 Stability and Soundness 9 Consolidated Balance Sheets 11 Consolidated Statements of Operations Consolidated
untitled
 2003 1924 13 1951 1979 2001 10 1977 1985 JICA 2003 1 4 200 2004 12 1 2006 7 6 2007 12 6 13 2003 4 1,612 150 2004 2009 150 13 2003 4 2004 3 1,612 48 742 156 150 4 A D A B A001 C D A B C D C D 2010 8 001
株式会社グローバルダイニング
 15,453 7,390 4,292 1,662 3,786 3,176 1,319 717 2,044 796 791 598 1,704 1,808 2,309 2,415 1,934 2,010 823 550 8,333 1,777 1,539 610 59 58 58 278 343 172 444 188 410 496 16,355 17,233 933 1,261 3,515 3,882
業績報告|ディスクロージャー│チューリッヒ|Business Report 2008 会社概要編
 V ision Statement Contents 03 04 06 08 09 10 12 13 16 19 20 23 Greeting from Our CEO - Makoto Ozeki Zurich Insurance Company, Japan Branch Profile Zurich Financial Services Group Profile Financial Highlights
2017年12月期 決算説明資料
 FINANCIAL RESULTS FOR FISCAL YEAR 2017 TABLE OF CONTENTS 2 HIGHLIGHTS OF FISCAL YEAR 2017 3 OUTLOOK ON FISCAL YEAR 2017 4 CONSOLIDATED NET SALES 4.4% 6,000 5,728 5,981 5,000 4,000 3,000 2,000 1,000 3,830
1990 年度 1991 年度 平成 2 年度 平成 3 年度 March 31, 1991 March 31, 1992 米国会計基準 (U.S.GAAP)excludesrestatements 1992 年度 1993 年度 1994 年度 1995 年度 1996 年度 1997 年度 19
excludesrestatements 1992 年度 1993 年度 1994 年度 1995 年度 1996 年度 1997 年度 19") 業績推移データ主要連結業績データ推移 1 主要連結業績データ推移 2 所在地別セグメント情報海外 Historical Financial Data Overview_1 Overview_2 Geographic Segment Information Overseas sales 本資料の連結経営指標等は 米国において一般に公正妥当と認められる会計基準 ( 米国会計基準 ) に基づく当該年度の連結財務諸表に基づいています
業績推移データ主要連結業績データ推移 1 主要連結業績データ推移 2 所在地別セグメント情報海外 Historical Financial Data Overview_1 Overview_2 Geographic Segment Information Overseas sales 本資料の連結経営指標等は 米国において一般に公正妥当と認められる会計基準 ( 米国会計基準 ) に基づく当該年度の連結財務諸表に基づいています
第一部 2012 年 3 月期第 1 四半期決算概況 Ⅰ. 第 1 四半期決算業績 Ⅱ. 月次売上高 客数推移部門別構成比 First quarterly result of operations Sales, number of customers per month Sales segmente
 2012 年 3 月期 第 1 四半期決算発表資料 2011 年 7 月 29 日 ゼビオ株式会社 XEBIO CO.,LTD.(8281 8281) 1 第一部 2012 年 3 月期第 1 四半期決算概況 Ⅰ. 第 1 四半期決算業績 Ⅱ. 月次売上高 客数推移部門別構成比 First quarterly result of operations Sales, number of customers
 At TOKYO GAS CO., LTD. Annual Report 2001 For the year ended March 31, 2001 The Frontier Of Change 2001 2000 1999 2001.......................................... 1,086,771 992,255 997,767 $ 8,835,537........................................
商学57‐1◆/6.松本
 56 2 57 1SFAC 5 FASB 5 SFAC 1 5 2 para. 33 3 para. 34 4 5 para. 39 a b FASB, Statement of Financial Accounting Concepts No. 5 Recognition and Measurement infinancial Statements of Business Enterprises,
<81798DC58F498A4A8EA69770817A32303134944E33518C888E5A95E291AB8E9197BF2E786C73>
 第 3 四 半 期 決 算 補 足 資 料 2015 年 3 月 期 (2014 年 4 月 1 日 ~2015 年 3 月 31 日 ) Financial and Operational Highlights 目 次 Contents ページ Page 1. 業 績 の 概 要 1 Financial summary 2.セグメント 情 報 1 Segment information 3. の
38 21
 For the year ended April 3, 21 38 21 Consolidated Financial Data millions s 1997.4 1998.4 1999.4 2.4 21.4-1 Net Sales 121,67 137,32 156,557 173,966 192,79 Tea Leaves 24,68 26,28 27,994 28,196 28,275 Beverages
 Annual 2002 Report Financial Highlights 2002 2001 2000 2002 2,581,399 2,750,418 2,680,611 19,372 28,402 26,494 11,173 213 4.17 3.89 1.64 $ 0.031 907,150 979,695 889,220 6,807 4,030,596 4,232,011 4,172,459
Otsuka-people creating new products for better health worldwide Contents 02 03 07 08 11 13 15 16 17 01
 3 Otsuka-people creating new products for better health worldwide Otsuka-people creating new products for better health worldwide Contents 02 03 07 08 11 13 15 16 17 01 To Our Shareholders Otsuka-people
株式会社幸楽苑
 35th Business Report http://www.kourakuen.co.jp/ To Our Shareholders Management Report CONTENTS 1 2 3 6 7 8 9 11 14 15 16 17 1 2 Management Strategy 3 4 5 6 Management Strategy Commentary Information 7
ozu_no98_H.qxd (Page h1)
") To Our Shareholders CONTENTS 1 2 3 4 56 78 911 112 13 14 TM 1 2 Group Corporate Information Segment Information 3 4 Topics Topics1 Topics2 Topics3 5 6 8 Special Contents 7 Financial Statements [Consolidated]
To Our Shareholders CONTENTS 1 2 3 4 56 78 911 112 13 14 TM 1 2 Group Corporate Information Segment Information 3 4 Topics Topics1 Topics2 Topics3 5 6 8 Special Contents 7 Financial Statements [Consolidated]
結果の概要1
 Cabinet office, Government of Japan 内 閣 府 経 済 社 会 総 合 研 究 所 国 民 経 済 計 算 部 ( 平 成 28) 年 1~3 月 期 四 半 期 別 GDP 速 報 ( ) Quarterly Estimates of GDP:Jan. ~ Mar. (The 2nd Preliminary Estimates) Ⅰ. 国 内 総 生 産 ( 支
1. 会 計 と 簿 記 の 役 割 簿 記 と 会 計 の 役 割 は 企 業 の 経 営 財 産 管 理 企 業 の 業 績 測 定 企 業 の 財 務 状 態 把 握 と それらを 利 害 関 係 者 に 報 告 することです 2
 グローバルビジネスパーソンのための ゼロから 学 ぶ 英 文 国 際 会 計 実 務 リエゾンインターナショナル 株 式 会 社 1. 会 計 と 簿 記 の 役 割 簿 記 と 会 計 の 役 割 は 企 業 の 経 営 財 産 管 理 企 業 の 業 績 測 定 企 業 の 財 務 状 態 把 握 と それらを 利 害 関 係 者 に 報 告 することです 2 2. 会 計 5 要 素 と 会
) ,
 ,") Vol. 2, 1 17, 2013 1986 A study about the development of the basic policy in the field of reform of China s sports system 1986 HaoWen Wu Abstract: This study focuses on the development of the basic policy
Vol. 2, 1 17, 2013 1986 A study about the development of the basic policy in the field of reform of China s sports system 1986 HaoWen Wu Abstract: This study focuses on the development of the basic policy
Summary of Financial Results for FY3/2017 and Plans for FY3/2018 Takao Imamura President and Representative Director 2
 FY3/2017 Financial Results Presentation May 23, 2017 The Nisshin OilliO Group, Ltd. 1 Summary of Financial Results for FY3/2017 and Plans for FY3/2018 Takao Imamura President and Representative Director
2006
 2006 1 1 2. 3. 4. 4. 5. 6. 7 2 8. 9. 5 9. 9. 13. 15. 15. 16 3 20. 21. 21. 22. 23. 23. 23. 24 The Adam Room 17 1997 111 199 240 1 3 2006 1 . 3. 4. 4 1. 4 2. 4. 5 1. 5 2. 5 3. 5. 6 1. 6 2. 6 3. 6 1 6 2 6
2 1 To Our Shareholders Financial Highlights
 2 1 To Our Shareholders Financial Highlights Review of Operations % % % % 3 4 5 6 Special Feature Topics 4/22 2005 6/23 7/8 7/15 9/2 10/26 11/18 12/27 1/30 2006 4 5 6 7 8 9 10 11 12 1 2 3 2/10 4/8 9/8
,
 , The Big Change of Life Insurance Companies in Japan Hisayoshi TAKEDA Although the most important role of the life insurance system is to secure economic life of the insureds and their
untitled
 Financial Factbook First Half of Fiscal Year Ending March 31, 2009 April 1 to September 30, 2008 FINANCIAL FACTBOOK 2009 First Half of Fiscal Year Ending March 31,2009 Contents Housing startssales of houses
CONTENTS Financial Performance Financial Result Cosolidated on-consolidated Sales SGA expenses Cosolidated on-consolidated Financial Indicators Cosoli
 2012/5/9 2012 234124331 April 1, 2011 March 31, 2012 UNITED ARROWS LTD. http://www.united-arrows.co.jp/ CONTENTS Financial Performance Financial Result Cosolidated on-consolidated Sales SGA expenses Cosolidated
untitled
 Bloomberg ARES Price Book-value Ratio J BA A * 201226 20 2241214 1 J 25 90 90 () 15 10090 10090 () 147 A A B B A A B B A A B ToSTNet 2 2-3 2 4-6 191 9 192 11 1 p16 H20.12 H20.11 H20.10 H20.3 H19.11
Simulation1-4
 Simulation 1 AICPA 2009 Release Deferred Taxes Simulation1-1 Simulation1-4 Stanhope, Inc. C corporation 33% 2 2 Stanhope 1 12 31 $11,000 2 $5,000 $15,000 2 12 31 $21,000 $8,000 GAAP GAAP 1 12 31 2 2 12
 The Japanese economy in FY2015 suffered from sluggish growth in individual consumption, while the foreign exchange market remained unstable with high volatility. Even in such an economic environment, MSF
目 次 Index 主 要 な 連 結 経 営 指 標 等 Major Consolidated Performance Indicators ( 参 考 ) 旧 セグメントでの 開 示 情 報 (Reference) Segment Information (Previous Basis) 事 業
 旧 セグメントでの 開 示 情 報 (Reference) Segment Information (Previous Basis) 事 業") キッコーマン 株 式 会 社 Kikkoman Corporation ファクトブック Fact Book 財 務 データ 編 Financial Data 2016 年 版 Fiscal 2016 目 次 Index 主 要 な 連 結 経 営 指 標 等 Major Consolidated Performance Indicators ( 参 考 ) 旧 セグメントでの 開 示 情 報 (Reference)
キッコーマン 株 式 会 社 Kikkoman Corporation ファクトブック Fact Book 財 務 データ 編 Financial Data 2016 年 版 Fiscal 2016 目 次 Index 主 要 な 連 結 経 営 指 標 等 Major Consolidated Performance Indicators ( 参 考 ) 旧 セグメントでの 開 示 情 報 (Reference)
第112期 決算説明会
 Financial Report (January 1 ~ September 3, 214) Sumitomo Rubber Industries, Ltd. Key Subjects 214 3 rd Quarter Financial Results Summary Changes in Scope of Consolidation, Major Affiliated Companies Financial
Supplementary Report For the Year Ended March 31, /3 期決算補足資料 CONTENTS PAGE 1 OPERATING RESULTS 1 損益の状況 1 1CONSOLIDATED OPERATING RESULTS 1 連結
 Supplementary Report For the Year Ended March 31,2018 2018/3 期決算補足資料 May 10, 2018 SANDEN HOLDINGS CORPORATION Supplementary Report For the Year Ended March 31, 2018 2018/3 期決算補足資料 CONTENTS PAGE 1 OPERATING
- Forward Looking Statement - Certain statements in the following presentation regarding Tokyo Electric Power`s business operations may constitute for
 -FY2002 Interim Results Presentation- ( April 1, 2002 September 30, 2002 ) Tokyo Electric Power Company November 20, 2002 - Forward Looking Statement - Certain statements in the following presentation
2 33,**. + : +/* /++** +/* /++** +/* /++** /** /** F+ +*** F+ +*** / 1*42.,43 /14+,*42 /, , 134,.,43 / 0-41,*42.4, -/41,*43,34,,+4. +
 1 BSE *,**+ 3 BSE,**- +23,2 + +,3 3+,**, * 2 33,**. + : +/* /++** +/* /++** +/* /++** /** /** F+ +*** F+ +*** / 1*42.,43 /14+,*42 /,341 24-14+ 24- +-4, 134,.,43 / 0-41,*42.4, -/41,*43,34,,+4. +/4../42,240
レイアウト 1
 61.3% 2.5% 18.1% 11.3% 21.6% 4.3% 22 23 24 25 26 26 71,42 7,71 73,8 74,659 86,613 $74,283 7,751 9,5 7,49 7,22 5,397 46,129 3,53 4,88 3,42 4,75 66 5,179 94,93 92,289 96,66 99,428 15,41 897,786 6,42 62,994
株式会社カーマ
 Kahma 22 Fact Book KAHMA CO., LTD. PROFILE Since opening its first home center in 1973, Kahma has pursued a strategy of building up a network of stores covering the Chubu Region centered on Nagoya. Rather
4. その 他 (1) 期 中 における 重 要 な 子 会 社 の 異 動 ( 連 結 範 囲 の 変 更 を 伴 う 特 定 子 会 社 の 異 動 ) 無 (2) 簡 便 な 会 計 処 理 及 び 四 半 期 連 結 財 務 諸 表 の 作 成 に 特 有 の 会 計 処 理 の 適 用 有
 期 中 における 重 要 な 子 会 社 の 異 動 ( 連 結 範 囲 の 変 更 を 伴 う 特 定 子 会 社 の 異 動 ) 無 (2) 簡 便 な 会 計 処 理 及 び 四 半 期 連 結 財 務 諸 表 の 作 成 に 特 有 の 会 計 処 理 の 適 用 有") 平 成 22 年 3 月 期 第 2 四 半 期 決 算 短 信 平 成 21 年 11 月 11 日 上 場 会 社 名 松 井 建 設 株 式 会 社 上 場 取 引 所 東 コード 番 号 1810 URL http://www.matsui-ken.co.jp/ 代 表 者 ( 役 職 名 ) 取 締 役 社 長 ( 氏 名 ) 松 井 隆 弘 問 合 せ 先 責 任 者 ( 役 職 名 )
平 成 22 年 3 月 期 第 2 四 半 期 決 算 短 信 平 成 21 年 11 月 11 日 上 場 会 社 名 松 井 建 設 株 式 会 社 上 場 取 引 所 東 コード 番 号 1810 URL http://www.matsui-ken.co.jp/ 代 表 者 ( 役 職 名 ) 取 締 役 社 長 ( 氏 名 ) 松 井 隆 弘 問 合 せ 先 責 任 者 ( 役 職 名 )
: , , % ,299 9, , % ,
 No. 22 March 2013 1. 1 2 3 4 2. 1 2 3. 1 2 2007 : 22 1980 51 1. 1 2008 : 170 4 5 2007 2007 2008 1 2008 6 2,592 205 2,900 0.33% 2009 7 6,299 9,300 238 2,600 0.31% 2010 254 1,700 2008 13.41 191.88 14 2010
ファイナンシャルデータ(和英併記)
") Financial Data 213 Contents 1 Performance Trends 3 Segment Information 6 Profitability 7 Efficiency 8 Stability and Soundness 9 Consolidated Balance Sheets 11 Consolidated Statements of Operations Consolidated
Financial Data 213 Contents 1 Performance Trends 3 Segment Information 6 Profitability 7 Efficiency 8 Stability and Soundness 9 Consolidated Balance Sheets 11 Consolidated Statements of Operations Consolidated
https://www.online3.tdnet.info/onre/jsp/tdzz.download?uji.verb=
 平 成 21 年 3 月 期 平 成 20 年 7 月 31 日 上 場 会 社 名 松 井 建 設 株 式 会 社 上 場 取 引 所 東 コード 番 号 1810 URL http://www.matsui-ken.co.jp/ 代 表 者 ( 役 職 名 ) 取 締 役 社 長 ( 氏 名 ) 松 井 隆 弘 問 合 せ 先 責 任 者 ( 役 職 名 ) 管 理 本 部 経 理 部 長 (
CONTENTS Financial Performance Financial Result Cosolidated on-consolidated Sales SGA expenses Cosolidated on-consolidated Financial Indicators Cosoli
 2013 244125331 April 1, 2012 March 31, 2013 UNITED ARROWS LTD. http://www.united-arrows.co.jp/ CONTENTS Financial Performance Financial Result Cosolidated on-consolidated Sales SGA expenses Cosolidated
株式会社グローバルダイニング
 1 Top Message Contents 2 1,287 1,580 3,908 1,816 3,663 12,438 182 2,582 1,326 3,917 1,697 3,687 13,446 14,036 58 1,291 2,858 3,711 1,681 4,155 47 234 117 31 188 42 Topics 3 4 Restaurant Guide 5 6 7 8 Consolidated
ScanFront300/300P セットアップガイド
 libtiff Copyright (c) 1988-1996 Sam Leffler Copyright (c) 1991-1996 Silicon Graphics, Inc. Permission to use, copy, modify, distribute, and sell this software and its documentation for any purpose is hereby
定 性 的 情 報 財 務 諸 表 等 1. 連 結 経 営 成 績 に 関 する 定 性 的 情 報 当 第 3 四 半 期 連 結 累 計 期 間 の 業 績 は 売 上 高 につきましては 前 年 同 四 半 期 累 計 期 間 比 15.1% 減 少 の 454 億 27 百 万 円 となり
 平 成 21 年 3 月 期 第 3 四 半 期 決 算 短 信 平 成 21 年 2 月 10 日 上 場 会 社 名 松 井 建 設 株 式 会 社 上 場 取 引 所 東 コード 番 号 1810 URL http://www.matsui-ken.co.jp/ 代 表 者 ( 役 職 名 ) 取 締 役 社 長 ( 氏 名 ) 松 井 隆 弘 問 合 せ 先 責 任 者 ( 役 職 名 )
P1 P2 貸借対照表 Consolidated Balance Sheets 損益計算書 Consolidated Statements of Income 包括利益計算書 Consolidated Statements of Comprehensive Income キャッシュ フロー計算書 C
 218 年 3 月期決算説明会 Results of FY217 ending March 31, 218 補足資料 Reference Data 218 年 5 月 18 日 May 18, 218 南海電気鉄道株式会社 Nankai Electric Railway Co.,Ltd. P1 P2 貸借対照表 Consolidated Balance Sheets 損益計算書 Consolidated
4. その 他 (1) 期 中 における 重 要 な 子 会 社 の 異 動 ( 連 結 範 囲 の 変 更 を 伴 う 特 定 子 会 社 の 異 動 ) 無 (2) 簡 便 な 会 計 処 理 及 び 四 半 期 連 結 財 務 諸 表 の 作 成 に 特 有 の 会 計 処 理 の 適 用 有
 期 中 における 重 要 な 子 会 社 の 異 動 ( 連 結 範 囲 の 変 更 を 伴 う 特 定 子 会 社 の 異 動 ) 無 (2) 簡 便 な 会 計 処 理 及 び 四 半 期 連 結 財 務 諸 表 の 作 成 に 特 有 の 会 計 処 理 の 適 用 有") 平 成 22 年 3 月 期 第 3 四 半 期 決 算 短 信 平 成 22 年 2 月 10 日 上 場 会 社 名 松 井 建 設 株 式 会 社 上 場 取 引 所 東 コード 番 号 1810 URL http://www.matsui-ken.co.jp/ 代 表 者 ( 役 職 名 ) 取 締 役 社 長 ( 氏 名 ) 松 井 隆 弘 問 合 せ 先 責 任 者 ( 役 職 名 )
平 成 22 年 3 月 期 第 3 四 半 期 決 算 短 信 平 成 22 年 2 月 10 日 上 場 会 社 名 松 井 建 設 株 式 会 社 上 場 取 引 所 東 コード 番 号 1810 URL http://www.matsui-ken.co.jp/ 代 表 者 ( 役 職 名 ) 取 締 役 社 長 ( 氏 名 ) 松 井 隆 弘 問 合 せ 先 責 任 者 ( 役 職 名 )
基本操作ガイド
 HT7-0022-000-V.4.0 Copyright 2004 CANON INC. ALL RIGHTS RESERVED 1 2 3 1 2 3 1 2 3 1 2 3 1 2 3 4 1 1 2 3 4 5 1 2 1 2 3 1 2 3 1 2 3 1 2 3 4 1 2 3 4 1 2 3 4 5 6 1 2 3 4 5 6 7 1 2 3 4
TAC all rights reserve 1. Financial Accounting and Reporting とは ~ 株 式 会 社 は 取 引 の 結 果 を 外 部 に 報 告 しなければなりません~ Financial Accounting and Reporting of a
 U.S.CPA Introduction to Financial Accounting & Reporting Textbook Contents 1. Financial Accounting and Reporting とは 2 ~ 株 式 会 社 は 取 引 の 結 果 を 外 部 に 報 告 しなくてはなりません~ (1) 株 式 会 社 とは どのような 組 織 なのでしょうか? 2 (2)
29 30
 28 27 29 30 31 32 34 33 Corporate Social Responsibility 4 5 6 7 8 9 10 11 12 1 2 3 36 35 International Network 38 37 Domestic Network Corporate Data 39 40 Years ended March 31, 2008 For the term: Net sales...
Vol.9, 30-40, May ) ) ) ) 9), 10) 11) NHK Table Table 1 分 類 回 答 ( 抜 粋 ) 1マスメデ
 ) ) ) 9), 10) 11) NHK Table Table 1 分 類 回 答 ( 抜 粋 ) 1マスメデ") Vol.9, 30-40, May 2012 COGNITION ANALYSIS OF THE NUCLEAR ENERGY INDUSTRY PUBLIC RELATIONS STAFF WITH REGARDS TO THEIR ACTIVITIES TOWARD THE MASS MEDIA DURING ORDINARY TIMES 1 2 1 (E-mail:tsuchida.tatsuro@jaea.go.jp)
Vol.9, 30-40, May 2012 COGNITION ANALYSIS OF THE NUCLEAR ENERGY INDUSTRY PUBLIC RELATIONS STAFF WITH REGARDS TO THEIR ACTIVITIES TOWARD THE MASS MEDIA DURING ORDINARY TIMES 1 2 1 (E-mail:tsuchida.tatsuro@jaea.go.jp)
2 122
 32 2008 pp. 121 133 1 Received November 4, 2008 The aim of this paper is to clarify some profound changes in the language used in the visual media, especially in TV news programs in Japan, and show what
ANNUAL REPORT (EXCERPT)
") Financial Results for Fiscal 2009 (from April 1,2009 to March 31,2010) CONTENTS A. 連結決算情報 Page CONSOLIDATED FINANCIAL INFORMATION 1. 比較連結貸借対照表 1 CONSOLIDATED BALANCE SHEETS 2. 比較連結損益計算書 2 CONSOLIDATED
Financial Results for Fiscal 2009 (from April 1,2009 to March 31,2010) CONTENTS A. 連結決算情報 Page CONSOLIDATED FINANCIAL INFORMATION 1. 比較連結貸借対照表 1 CONSOLIDATED BALANCE SHEETS 2. 比較連結損益計算書 2 CONSOLIDATED
 44 2012 2013 3 35 48 法人化後の国立大学の収入変動 37 法人化後の国立大学の収入変動 2009 2005 2010 2012 2012 2008 2009a 2010 16 18 17 20 2 4 2012 38 44 2012 17 22 (1) (2) 2012 5 GP COE 30 WPI 1 2012 17 22 16 17 22 17 17 19 2012 2012
9104
 01 To Our Shareholders 02 03 Consolidated Financial Statements 12,000 8,878 9,039 9,102 9,972 11,300 8,000 5,636 4,000 0 2001/3 2002/3 2003/3 2004/3 2004/9 2,000 1,500 1,600 1,000 500 530 373 334 905 742
株式会社フジテレビジョン
 67 194119930 Cover 2 Top Message 3 Top Interview 6 Topics 7 Fuji TV Outline 11 Consolidated Financial Statements 13 Non-Consolidated Financial Statements 14 Corporate Social Responsibility Report 15 Group/Network
東京建物不動産販売株式会社
 Business Report To Our Shareholders 1 Tokyo Tatemono Real Estate Sales Co.,Ltd. Tokyo Tatemono Real Estate Sales Co.,Ltd. 2 Business Overview 3 Tokyo Tatemono Real Estate Sales Co.,Ltd. Tokyo Tatemono
大学論集第42号本文.indb
 42 2010 2011 3 279 295 COSO 281 COSO 1990 1 internal control 1 19962007, Internal Control Integrated Framework COSO COSO 282 42 2 2) the Committee of Sponsoring Organizations of the Treadway committee
添 付 資 料 の 目 次 1.サマリー 情 報 (その 他 )に 関 する 事 項... 2 (1) 当 四 半 期 連 結 累 計 期 間 における 重 要 な 子 会 社 の 異 動... 2 (2) 四 半 期 連 結 財 務 諸 表 の 作 成 に 特 有 の 会 計 処 理 の 適 用.
に 関 する 事 項... 2 (1) 当 四 半 期 連 結 累 計 期 間 における 重 要 な 子 会 社 の 異 動... 2 (2) 四 半 期 連 結 財 務 諸 表 の 作 成 に 特 有 の 会 計 処 理 の 適 用.") 平 成 26 年 3 月 期 第 3 四 半 期 決 算 短 信 日 本 基 準 ( 連 結 ) 平 成 26 年 1 月 29 日 会 社 名 SMBC 日 興 証 券 株 式 会 社 (URL http://www.smbcnikko.co.jp/ ) 代 表 者 ( 役 職 名 ) 取 締 役 社 長 ( 氏 名 ) 久 保 哲 也 問 合 せ 先 責 任 者 ( 役 職 名 ) 経 理 部
平 成 26 年 3 月 期 第 3 四 半 期 決 算 短 信 日 本 基 準 ( 連 結 ) 平 成 26 年 1 月 29 日 会 社 名 SMBC 日 興 証 券 株 式 会 社 (URL http://www.smbcnikko.co.jp/ ) 代 表 者 ( 役 職 名 ) 取 締 役 社 長 ( 氏 名 ) 久 保 哲 也 問 合 せ 先 責 任 者 ( 役 職 名 ) 経 理 部
ScanFront 220/220P 取扱説明書
 libtiff Copyright (c) 1988-1996 Sam Leffler Copyright (c) 1991-1996 Silicon Graphics, Inc. Permission to use, copy, modify, distribute, and sell this software and its documentation for any purpose is hereby
ScanFront 220/220P セットアップガイド
 libtiff Copyright (c) 1988-1996 Sam Leffler Copyright (c) 1991-1996 Silicon Graphics, Inc. Permission to use, copy, modify, distribute, and sell this software and its documentation for any purpose is hereby
基本操作ガイド
 HT7-0199-000-V.5.0 1. 2. 3. 4. 5. 6. 7. 8. 9. Copyright 2004 CANON INC. ALL RIGHTS RESERVED 1 2 3 1 1 2 3 4 1 2 1 2 3 1 2 3 1 2 3 1 2 3 4 1 2 3 4 1 2 3 4 5 AB AB Step 1 Step
634 (2)
") No.7, 633-644 (2006) Regime of Information Control and Its Collapse in North Korea MIYATA Atsushi Nihon University, Graduate School of Social and Cultural Studies Recently, there are cracks being formed
No.7, 633-644 (2006) Regime of Information Control and Its Collapse in North Korea MIYATA Atsushi Nihon University, Graduate School of Social and Cultural Studies Recently, there are cracks being formed
maiji2007_cover_j_0907
 27 CORPORATE PHILOSOPHY THE MEIJI DAIRIES GROUP CONTRIBUTES TO A HEALTHY AND HAPPY DAILY LIFE FOR OUR CUSTOMERS BY OFFERING NEW LEVELS OF VALUE IN FOOD. CONTENTS 2 4 6 1 1 11 12 13 14 16 18 19 2 22 23
2 3-4 5-6 7-8 9-10 11 12 13 14 1
 2 3-4 5-6 7-8 9-10 11 12 13 14 1 2 3 4 5 6 連 結 貸 借 対 照 表 (2014 年 ( 平 成 26 年 )11 月 30 日 現 在 ) ( 単 位 : 千 円 ) 科 目 金 額 科 目 金 額 資 産 の 部 流 動 資 産 現 金 及 び 預 金 受 取 手 形 及 び 売 掛 金 商 品 及 び 製 品 仕 掛 品 原 材 料 及 び 貯 蔵
操作ガイド(本体操作編)
") J QT5-0571-V03 1 ...5...10...11...11...11...12...12...15...21...21...22...25...27...28...33...37...40...47...48...54...60...64...64...68...69...70...70...71...72...73...74...75...76...77 2 ...79...79...80...81...82...83...95...98
J QT5-0571-V03 1 ...5...10...11...11...11...12...12...15...21...21...22...25...27...28...33...37...40...47...48...54...60...64...64...68...69...70...70...71...72...73...74...75...76...77 2 ...79...79...80...81...82...83...95...98
Sales Data Net Sales Sales Composition Sales by Region Profit Data Cost Composition & Operating Income / Net Sales Gross Profit Margin SG & A Expenses
 FINANCIAL FACT BOOK 2 0 0 0 Sales Data Net Sales Sales Composition Sales by Region Profit Data Cost Composition & Operating Income / Net Sales Gross Profit Margin SG & A Expenses / Net Sales, R & D Expenses
連 結 損 益 計 算 書 売 上 高 及 びその 他 の 営 業 収 入 営 業 費 用 売 上 原 価 販 売 費 及 び 一 般 管 理 費 研 究 開 発 費 営 業 費 用 合 計 営 業 利 益 営 業 外 収 益 ( 費 用 ) 受 取 利 息 支 払 利 息 営 業 外 収 益 (
 受 取 利 息 支 払 利 息 営 業 外 収 益 (") 任 意 適 用 に 伴 う 連 結 財 務 諸 表 の 変 化 点 国 際 財 務 報 告 基 準 () 任 意 適 用 に 伴 い 2015 年 4 月 下 旬 に 発 表 を 予 定 しております 2016 年 3 月 期 連 結 業 績 予 想 につきましてはで 開 示 いたします 2016 年 3 月 期 連 結 業 績 予 想 の 米 国 会 計 基 準 との 数 値 の 差 異 につきましては
任 意 適 用 に 伴 う 連 結 財 務 諸 表 の 変 化 点 国 際 財 務 報 告 基 準 () 任 意 適 用 に 伴 い 2015 年 4 月 下 旬 に 発 表 を 予 定 しております 2016 年 3 月 期 連 結 業 績 予 想 につきましてはで 開 示 いたします 2016 年 3 月 期 連 結 業 績 予 想 の 米 国 会 計 基 準 との 数 値 の 差 異 につきましては
10-渡部芳栄.indd
 COE GCOE GP ) b a b ) () ) () () ) ) .. () ) ) ) ) () ........... / / /.... 交付税額 / 経常費 : 右軸交付税額 /( 経常費 授業料 ): 右軸 . ) ()... /.. 自治体負担額 / 交付税額 : 右軸 ()......... / 自治体負担額 / 経常費 : 右軸 - No. - Vol. No. - IDE
Bull. of Nippon Sport Sci. Univ. 47 (1) Devising musical expression in teaching methods for elementary music An attempt at shared teaching
 Devising musical expression in teaching methods for elementary music An attempt at shared teaching") Bull. of Nippon Sport Sci. Univ. 47 (1) 45 70 2017 Devising musical expression in teaching methods for elementary music An attempt at shared teaching materials for singing and arrangements for piano accompaniment
Bull. of Nippon Sport Sci. Univ. 47 (1) 45 70 2017 Devising musical expression in teaching methods for elementary music An attempt at shared teaching materials for singing and arrangements for piano accompaniment
NetVehicle GX5取扱説明書 基本編
 -GX5 1 2 3 4 5 6 7 8 # @(#)COPYRIGHT 8.2 (Berkeley) 3/21/94 All of the documentation and software included in the 4.4BSD and 4.4BSD-Lite Releases is copyrighted by The Regents of the University of California.
12_11B-5-00-omote※トンボ付き.indd
 Enquiry CEPA website (http://www.tid.gov.hk/english/cepa/index.html) provides information on the content and implementation details of various CEPA liberalisation and facilitative measures, including the
_念3)医療2009_夏.indd
医療2009_夏.indd") Evaluation of the Social Benefits of the Regional Medical System Based on Land Price Information -A Hedonic Valuation of the Sense of Relief Provided by Health Care Facilities- Takuma Sugahara Ph.D. Abstract
Evaluation of the Social Benefits of the Regional Medical System Based on Land Price Information -A Hedonic Valuation of the Sense of Relief Provided by Health Care Facilities- Takuma Sugahara Ph.D. Abstract
03_野村尚司.indd
 3 2015 pp. 23 34 25 JTB 25 1 2 2016 2 24 23 JTB 3 59.8 62.7 60.6 46.7 SNS 4 77 5 3 6 7 4 2 ANA 8 1 2 2 24 3 4 5 9 6 10 7 8 2 3 300 400 25 11 9 SNS 1 26 LOOKJTB JAL KNT Trapics 2014 2 12 1 2 LOOKJTB HIS
https://www.takara-dic-net.jp/xeditor_ne/xeditor_web/html_gene.
 平 成 23 年 3 月 期 第 1 四 半 期 決 算 短 信 日 本 基 準 ( 連 結 ) 平 成 22 年 8 月 11 日 上 場 会 社 名 松 井 建 設 株 式 会 社 上 場 取 引 所 東 コ ー ド 番 号 1810 URL http://www.matsui-ken.co.jp/ 代 表 者 ( 役 職 名 ) 取 締 役 社 長 ( 氏 名 ) 松 井 隆 弘 ( 役 職
NIES ASEAN4.. NIES.....EU.. ASEAN4 NIES
 NIES ASEAN4.. NIES.....EU.. ASEAN4 NIES NIES ASEAN4 EU NIES ASEAN4 EU On-line UN Comtrade Database NIES NIES.AEAN4..EU.NIESASEAN4 NIES NIES ASEAN4. EU NIES ASEAN4. TPS: Toyota Production System.... Dunning
操作ガイド(本体操作編)
") J-1 QT5-0681-V02 1 m a b c d e f l kj i h g a b c d e f g h i j k l m n n o o s p q r p q r s w t u v x y z t u v w x y z a bc d e f g q p o n m l k j i h a b c d e f g h i j k l {}[] {}[] m n
J-1 QT5-0681-V02 1 m a b c d e f l kj i h g a b c d e f g h i j k l m n n o o s p q r p q r s w t u v x y z t u v w x y z a bc d e f g q p o n m l k j i h a b c d e f g h i j k l {}[] {}[] m n
Core Ethics Vol.
 Core Ethics Vol. Core Ethics Vol. . % % % Core Ethics Vol. %, Core Ethics Vol. % % % -. %. Core Ethics Vol. a b : Core Ethics Vol. pp... pp.. pp... pp. pp.. pp...pp.... pp. pp. pp.. pp.. Vol.. pp... pp..
Microsoft PowerPoint - 13.3ファクトデータ.ppt
 2013 年 3 月 期 決 算 説 明 資 料 Financial Fact Data Fiscal Year Ended March 31, 2013 MISAWA HOMES CO., LTD. 目 次 Index 主 な 財 務 データ 連 結 経 営 指 標 1 Consolidated Financial Summary 1 1 Financial Summary 連 結 経 営 指 標