PowerPoint プレゼンテーション
|
|
|
- あゆみ ふじた
- 7 years ago
- Views:
Transcription

1
2 40,000 40, % 35,000 30,000 30,453 30,183 29,775 32,855 35,562 25,000 20,000 15,000
3 5,000 4,000 3,000 3,483 4,011 4, % 2,000 1,000 1,344 1,
4
5 SHIFT_

6
7
8
9
10
11 1,600 1,500 1, % 1,400 1,386 1,467 1,300 1,337 1,265 1,289 1,200 1,100
12 GM Ford Chrysler Toyota NISSAN Honda

13
14
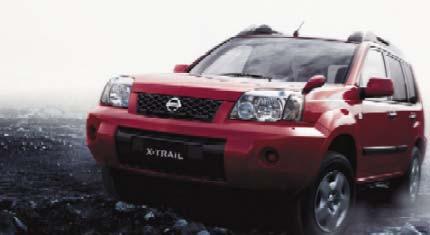
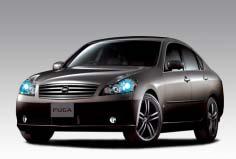
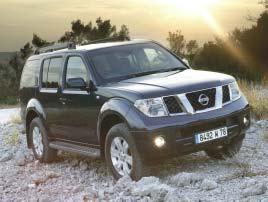
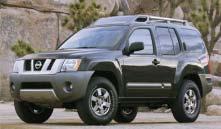
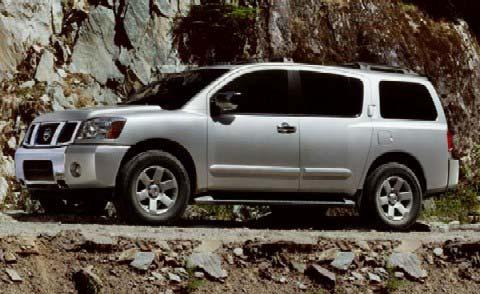
15 X-Trail
16
17
18
19 %

20 %
21
22

23
24
25 35,562 40, % 4,011 4, % 11.3% 10.1% -1.2
26 04 4, , ,000 5,000 +1, ,500 4, ,000 3,000 3,500 3,500 4,000 4,000 ( )
27 5, % % 04 ( ) 4,500 4,000 3, , ,429 3,000
28 ( ) 2,000 (+ ) 1,000 1,933 1,624 1,597 1, ,000 ) 1,
29 ( ) ,562 40, % 4,011 4, % 11.3% 10.1% ,903 4, %
30 ( ) ,562 40, % 4,011 4, % 11.3% 10.1% ,903 4, % 3,681 3, % -1,252-1, % -32.6% ,377 2, %
31 4,000 3,000 2,000 1, ,000-2,000-3,000-2, ,861-4,000-1,746-2, ,
32
33 % % (Asset*/billion yen) Asset (OP/billion yen) 30% 20% 10% 22% Lease 4% 30% 26% Retail FY03 1H FY03 2H FY04 1H % FY02 FY03 FY04 1H NFS: Nissan Financial Service, sales finance company in Japan * Asset does not include off-balance asset
34 (NMAC) 30, % (Asset*/million $) 25,000 20,000 15,000 10, Asset 22, ,721 26, (OP/million $) 50% 40% 30% 20% 15% Lease 14% 14% Retail 39% 37% 38% 5, % 0 FY03 1H FY03 2H FY04 1H 0 0% FY02 FY03 FY04 1H NMAC: Nissan Motor Acceptance Corporation, sales finance company in USA * Asset does not include off-balance asset
35 (NCFI) (Asset*/million CAD) 2,500 2,000 1,500 1, ,081 1,807 1, FY03 1H FY03 2H FY04 1H (OP/million CAD) 70% 60% 50% 40% 30% 20% 10% Lease 30% 41% 41% 19% Retail 16% 17% 0% FY02 FY03 FY04 1H NCFI:Sales financing division of Nissan Canada Inc. * Asset does not include off-balance asset
36 NFS NMAC NCFI FY04 1H Lease: 0.06% Retail: 0.24% Lease: 0.32% Retail: 0.99% Lease: 0.10% Retail: 0.16% FY03 Lease: 0.10% Retail: 0.39% Lease: 0.53% Retail: 1.13% Lease: 0.12% Retail: 0.12% NFS: Nissan Financial Service, sales finance company in Japan NMAC: Nissan Motor Acceptance Corporation, sales finance company in USA NCFI:Sales financing division of Nissan Canada Inc.
37 Equity Inter-Company ABS Off B/S 9.2% 8.1% 19.0% CP ABS On B/S 44.3% 8.4% S/T Loan 1.5% L/T Loan 7.8% Bonds 1.6% Total funding amount 3,987.1 billion Yen (= Total assets Other liabilities + off balance sources) NRFM: NR Finance Mexico NRWM: NR Wholesale Mexico NFS: Nissan Financial Service NMAC: Nissan Motor Acceptance Corporation NCFI:Sales financing division of Nissan Canada Inc.
38
39 180
40 ( ) ,292 81, % 8,249 8, % 10.5% 11.1% ,097 8, % 5,037 5, %
41 3,400 3,380 3,200 : 588 (+1.7%) ( ) 3,000 2,800 2,600 2,400 : 338 (+10.5%) : 5.8% (+0.5 ) 2,530 2,633 2,597 2,771 3,057 2,
 11.6 8.6 11.9 12.0 8.3 8.9 18.1 4.6 0.2 6.1 0.2 89.5 0.1 4.6 0.2 6.1 0.2 2.2 0.1 2.7 0.0 9.21.2 2.1 1.1 3.6 0.8 18 89.5 0.1 10 9.8 0.8 4 42.71.5 18.4 0.1 15.2 0.4 95.9 0.1 94.6 0.1 98.3 0.0 97.5 0.1
 LEXUS 1 / 248 LEXUS 2 / 248 LEXUS 3 / 248 LEXUS 4 / 248 LEXUS 5 / 248 LEXUS 6 / 248 TOYOTA 7 / 248 TOYOTA 8 / 248 TOYOTA 9 / 248 TOYOTA 10 / 248 TOYOTA 11 / 248 TOYOTA 12 / 248 TOYOTA 13 / 248 TOYOTA 14
 ABS STEP O/D OFF ABS 1 2 3 4 5 6 7 8 3 4 1 2 1 2 3 4 5 6 14 15 7
  ABS STEP O/D OFF ABS 1 2 3 4 5 6 7 8 4 5 1 2 3 1
宿泊産業活性化のための実証実験
 121 32 10 12 12 19 2 15 59 40 33 34 35 36 37 38 3637 20 39 12 19 OFF 2008/12/19 2008/12/25 3 1 1 72,000 2008/12/19 2008/12/26 2 1 1 36,000 2008/12/28 2009/1/5 2 1 1 24,000 2009/1/6 2009/1/16 3 1 1 25,200
")

 901 902 2 40 5 786 30 2 2 100 10100200 903 904 2 3 2 12 905 6765 30 3 61016 1 10162532 253240 2 2 1 2 100 24 45 545 1 2 2 510 1515 1010 50 300 0 10 2942 560 2 1 1 2 24 15 2565 2 10 2942 560 3 3 56 03 18
 1037 1038 2 40 5 876 30 2 2 100 10100200 1039 1040 2 3 2 12 1041 6765 30 1 1 2 2 1 2 100 24 45 545 1 2 2 510 1515 1010 50 300 0 10 2942 560 2 1 3 2 10 2942 560 3 61016 1 10162532 253240 1 2 24 15 2565
GC-X3
 GC-X3 Digital Still Camera GC-X3 STILL CAMERA LYT0667-001A 1 28 1 4 2 3 2 30 1 2 3 2 3 34 1 4 38 1 2 4 5 39 3 ;: 3 1 2 3 4 2 6 8 16 16 18 18 19 20 22 24 25 26 27 28 29 30 31 32 32 33 34 35 36 37 38 39


車種別接続ガイド2010年7月版
 TOYOTA TOYOTA TOYOTA TOYOTA TOYOTA TOYOTA TOYOTA TOYOTA LEXUS TOYOTA T-1a T-1b T-2a SP SP GND IGN GND IGN T-2b T-3a T-3b T-3c T-4a T-4b T-4c T-4d T-4e T-5 T-6a T-6b T-6c T-6d T-6e T-8 T-9 T-10 T-13 T-14
 32% 51% #8000 () 22 22 22 U U A A
 290 新潟大学経済論集第 92 号 2011-Ⅱ AC 3 A 3 B C
 齋藤達弘 : 株式会社ブルボンの財務政策 289 株式会社ブルボンの財務政策 齋藤達弘 2011 27 50 8 1991 1993 2009 9 17.5% 2009 1 2011 27 (C) 23530431 1 3% 3 1,022 676 66% 286 28% 59 6% 290 新潟大学経済論集第 92 号 2011-Ⅱ 1 http://www.dir.co.jp/publicity/column/070622.html
ares_018
 THE ASSOCIATION FOR REAL ESTATE SECURITIZATION May-June. 2003 1 3 5 11 20 35 37 38 44 58 65 72 80 91 95 104 107 112 2 ARES SPECIAL ARES SYMPOSIUM 2005 November-December. 2005 3 ARES SPECIAL 4 5 November-December.
損益計算書 Non-consolidated statement of income 2016 年度 /FY 年度 /FY2017 前年増減 Increase (Decrease) 百万円 /Million
 百万円 /Million") 主な業績と予想 Results and forecasts for major financial indicators 2016 年度 /FY2016 2017 年度 /FY2017 2018 年度 ( 計画 )/FY2018(Forecast) 通期 /Full year 2016.3.1-2017.2.28 通期 /Full year 2017.3.1-2018.2.28 第 2 四半期累計期間
主な業績と予想 Results and forecasts for major financial indicators 2016 年度 /FY2016 2017 年度 /FY2017 2018 年度 ( 計画 )/FY2018(Forecast) 通期 /Full year 2016.3.1-2017.2.28 通期 /Full year 2017.3.1-2018.2.28 第 2 四半期累計期間
FINANCIAL FACT BOOK 2002 CONTENTS CONTENTS Sales Data Net Sales Sales Composition Sales by Region Profit Data Cost Composition & Operating Income/Net
 FINANCIAL FACT BOOK 2002 FINANCIAL FACT BOOK 2002 CONTENTS CONTENTS Sales Data Net Sales Sales Composition Sales by Region Profit Data Cost Composition & Operating Income/Net Sales Gross Profit Margin
円借款案件・事後評価報告書1999(全文・上巻)
") 8 1999 3 199812 () 19919 19919 19981 7,854 5,335 3.0% 257 239 (1) (B) (2) 1991 1992 1993 1994 1995 JP US$ 134.71 126.65 111.20 102.21 94.06 BUS$ 025.47 025.39 025.35 025.00 025.14 CPI 105.7 110.0 113.7
8 1999 3 199812 () 19919 19919 19981 7,854 5,335 3.0% 257 239 (1) (B) (2) 1991 1992 1993 1994 1995 JP US$ 134.71 126.65 111.20 102.21 94.06 BUS$ 025.47 025.39 025.35 025.00 025.14 CPI 105.7 110.0 113.7
1990 年度 1991 年度 平成 2 年度 平成 3 年度 March 31, 1991 March 31, 1992 米国会計基準 (U.S.GAAP)excludesrestatements 1992 年度 1993 年度 1994 年度 1995 年度 1996 年度 1997 年度 19
excludesrestatements 1992 年度 1993 年度 1994 年度 1995 年度 1996 年度 1997 年度 19") 業績推移データ主要連結業績データ推移 1 主要連結業績データ推移 2 所在地別セグメント情報海外 Historical Financial Data Overview_1 Overview_2 Geographic Segment Information Overseas sales 本資料の連結経営指標等は 米国において一般に公正妥当と認められる会計基準 ( 米国会計基準 ) に基づく当該年度の連結財務諸表に基づいています
業績推移データ主要連結業績データ推移 1 主要連結業績データ推移 2 所在地別セグメント情報海外 Historical Financial Data Overview_1 Overview_2 Geographic Segment Information Overseas sales 本資料の連結経営指標等は 米国において一般に公正妥当と認められる会計基準 ( 米国会計基準 ) に基づく当該年度の連結財務諸表に基づいています
MAAB でのプレゼンテーション に関する提案
 J-MAAB 2005 10 27 (1) OBD (2) (3) (4) OEM (5) MAAB J-MAAB 1. MBD (Model-Based Development) MBD Process 2. MAAB MAAB 3. J (Japan) -MAAB J-MAAB 4. J-MAAB WG WG 5. MBD Virtual World *SILS Rapid *HILS Real
 Contents FY2011 Highlight Financial Data Business Outline Of ZOZOTOWN To Overseas Customers Business Outline Of Affiliated Companies About Us Appendix : Notice of the 14th Annual General Meeting of
20103n=3,280 7 3 40 30.2 3.4 16.9 43.1 n=3,280 2.2 8.1 n=3,280 69.8 9.6 6.9 4.7 3.3 30 19 0.3 60 28.0 0.7 20-24 19 0.3 1.4 25-29 60 28.0 3.9 30-34 1.7
 20103n=3,280 7 3 40 30.2 3.4 16.9 43.1 n=3,280 2.2 8.1 n=3,280 69.8 9.6 6.9 4.7 3.3 30 19 0.3 60 28.0 0.7 20-24 19 0.3 1.4 25-29 60 28.0 3.9 30-34 1.7 20-24 5.7 35-39 2.7 25-29 8.2 40-44 4.5 30-34 n=2,288
Supplementary Report For the Year Ended March 31, /3 期決算補足資料 CONTENTS PAGE 1 OPERATING RESULTS 1 損益の状況 1 1CONSOLIDATED OPERATING RESULTS 1 連結
 Supplementary Report For the Year Ended March 31,2018 2018/3 期決算補足資料 May 10, 2018 SANDEN HOLDINGS CORPORATION Supplementary Report For the Year Ended March 31, 2018 2018/3 期決算補足資料 CONTENTS PAGE 1 OPERATING
 Annual 2002 Report Financial Highlights 2002 2001 2000 2002 2,581,399 2,750,418 2,680,611 19,372 28,402 26,494 11,173 213 4.17 3.89 1.64 $ 0.031 907,150 979,695 889,220 6,807 4,030,596 4,232,011 4,172,459
FDR-1説明用修正版.PDF
 1 2 GM Ford Toyota Renault / Nissan Daimler Chrysler VW 400 7.5 6.3 6.1 4.9 4.4 4.0 PSA Honda Hyundai Fiat Mitsubishi Suzuki Mazda 300-100 3.1 2.7 2.5 2.4 1.6 1.5 1.0 BMW Audi 100-60 0.9 0.6 0.6 ( ) Daewoo
11モーゲージカンパニー研究論文.PDF
 2003 Outline of the Study 1. Purpose Housing finance in Japan is now at a turning point because the Government Housing Loan Corporation (the HLC) is scheduled to become an independent administrative
DCR-PC300K/IPK
 3-084-945-02(1) 6 19 31 34 39 2003 Sony Corporation * b 2 3 6 19 31 4 34 39 5 \ 6 * * * 7 1 2 * 3 b 4 1 2 5 6 8 7 1 8 1 2 *, 9 2 7 3 8 * 4 9 5 6 z 10 10 1 2 3 1 1 11 2 * 2, 11 3 8 4 5 9 6 7 12 13 b,,,,,

untitled
 financial report - 1 - - 2 - - 3 - - 4 - - 5 - - 6 - - 7 - - 8 - - 9 - - 10 - - 11 - - 12 - - 13 - - 14 - - 15 - - 16 - - 17 - - 18 - - 19 - - 20 - - 21 - - 22 - - 23 - - 24 - - 25 - - 26 - - 27 - -
untitled
 PPP 1 2 PPP 2.1 PPP 4 PPP PPP 4 (1) PPP (2) (3) (4) 2.2 PPP PPP PPP 4 2-1 PPP Country Risk Related Laws & Regulations PPP Legal and Regulatory Framework Instit l Framework Instit l Strategic Planning Capacity
GR-DX307
 GR-DX307 140 140 R 27 LYT1308-001A 2 1 2 1 5 2 4 3 R 41 1 2 3 3 1 3 4 2 R 52 1 2 3 4 1 2 3 2 1 3 4 r r 5 6 P p 5 6 1 3 2 4 r f 5 2 1 3 4 R 105 R 107 M R 76 83 R 164 R 8 R 38 R 52 R 69 7 8 R M M M 9 R 107
???
 LOTTE PROFILE 2013 PREPARED WAY contents PREPARED WAY LOTTE 3 Global Strategy 4 Message from the Chairman 6 Vision 2018 10 Global Passion 11 Social Responsibility 18 Financial Information 21 PREPARED WORLD

経 営 情 報 研 究 第 15 巻 第 1 号 (2007),29-46 ページ 2006 5 1 2 1 2003 12 ) ) 2005 2 ) 1, 1 2 2005 2 17 ( ) 4 2 1990 2 3 1,000 300 4 1 43-44 ) 2 [2006 ], 42-46 )
![経 営 情 報 研 究 第 15 巻 第 1 号 (2007),29-46 ページ 2006 5 1 2 1 2003 12 ) ) 2005 2 ) 1, 1 2 2005 2 17 ( ) 4 2 1990 2 3 1,000 300 4 1 43-44 ) 2 [2006 ], 42-46 )](/thumbs/41/22517814.jpg "経 営 情 報 研 究 第 15 巻 第 1 号 (2007),29-46 ページ 2006 5 1 2 1 2003 12 ) ) 2005 2 ) 1, 1 2 2005 2 17 ( ) 4 2 1990 2 3 1,000 300 4 1 43-44 ) 2 [2006 ], 42-46 )") 経 営 情 報 研 究 第 15 巻 第 1 号 (2007),29-46ページ A study for the abolition of minimum capital system Hirofumi KAMI 29 経 営 情 報 研 究 第 15 巻 第 1 号 (2007),29-46 ページ 2006 5 1 2 1 2003 12 ) ) 2005 2 ) 1, 1 2 2005 2 17
経 営 情 報 研 究 第 15 巻 第 1 号 (2007),29-46ページ A study for the abolition of minimum capital system Hirofumi KAMI 29 経 営 情 報 研 究 第 15 巻 第 1 号 (2007),29-46 ページ 2006 5 1 2 1 2003 12 ) ) 2005 2 ) 1, 1 2 2005 2 17
パワープロジェクター WUX10 使用説明書
 2 1 3 4 5 6 7 8 9 10 11 12 13 14 15 16 17 18 19 20 21 22 23 24 25 1 2 3 26 27 28 29 30 1 2 31 32 33 34 35 36 37 38 39 1 2 3 4 40 5 41 42 43 44 45 1 2 3 46 1 2 1 2 3 3 1 2 3 4 47 48 1 2 3 49 1 2 3 50 1
はじめに
 ( ) 19 15 1. ( ) ( ) ( ) 16 1.1 ( ) 1 ( ) 4 3 17 1. ( ) ( ) ( ) ( ) 18 1.1 19 1. 2000 4 1 3 1/1 1/5 1/6 1/7 1/9 1/11 1/15 300,000 1/15 1/15 1/16 1/19 1/20 150,000 12,000 138,000 8,000 130,000 12,000 118,000
廣済堂グループ中期経営計画
 KOSAIDO PARADIGM SHIFT 2011 2013 2 4 6 Communication Engineering Company 8 10 11 13 KOSAIDO PARADIGM SHIFT 2011 2013 14 6 15 40 200 13 4.6 : 39,743 38,500 39,000 40,000 40,900 2,017 2,600 3,000 3,380
TECMO,LTD. 2003
 TECMO,LTD. 2003 Net sales by Divisions Operating income by Divisions 2004/3/31 Amount 2003/3/31 Amount Comparative increase or decrease (denotes minus) Subject 2004/3/31 Amount 2003/3/31 Amount Comparative
(c) 2013 TOYOTA DIGITAL CRUISE, INC. All Rights Reserved.
 2013 TOYOTA DIGITAL CRUISE, INC. All Rights Reserved.") (c) 2013 TOYOTA DIGITAL CRUISE, INC. All Rights Reserved. (c) 2013 TOYOTA DIGITAL CRUISE, INC. All Rights Reserved. (c) 2013 TOYOTA DIGITAL CRUISE, INC. All Rights Reserved. (c) 2013 TOYOTA DIGITAL CRUISE,
(c) 2013 TOYOTA DIGITAL CRUISE, INC. All Rights Reserved. (c) 2013 TOYOTA DIGITAL CRUISE, INC. All Rights Reserved. (c) 2013 TOYOTA DIGITAL CRUISE, INC. All Rights Reserved. (c) 2013 TOYOTA DIGITAL CRUISE,
Microsoft, Windows Microsoft Corporation
 Copyright 2000-2002 T&D Corporation. All rights reserved. 2002.07 16004194030 Microsoft, Windows Microsoft Corporation This Modem Logger is designed for use in Japan only and can not be used in any other
業績報告|ディスクロージャー│チューリッヒ|Business Report 2008 会社概要編
 V ision Statement Contents 03 04 06 08 09 10 12 13 16 19 20 23 Greeting from Our CEO - Makoto Ozeki Zurich Insurance Company, Japan Branch Profile Zurich Financial Services Group Profile Financial Highlights
NRI 4500 4500 2 4,500 1 4500 1 1 9 2005 1 29,161,100 145,806 3 2 3 10 8,736,663 87,367 2 99,938,239 74,954 5 10 3 5 7,944,577 47,667 4,085,836 30,644
 No.8, 113-124 (2007) The Present and the Future of Mileage Points in Business Currencies YASUOKA Hiromichi Nihon University, Graduate School of Social and Cultural Stadies Mileage points and electronic

870727_ガイドブック2016_vol1.indd
 VOL.1 VOL.2 VOL.3 2016 I N D E X C h e c k! 3 C h e c k! 4 5 1 2 3 6 4 C h e c k! 5 7 8 9 10 11 12 Q Q Q A A A Q A C h e c k! 13 14 1,531,513 72,364 3,737,465 1,110,000 3,337,105 1,119,421 C h e c k! 774,000
UFJ
 UFJ UFJ () UFJ UFJ 2002 7 2 82 UFJ 2002 9 UFJ 2002 7 22 83 84 UFJ 1 2 3 4 1 2 16 15 14 90 6 5 2002 7 22 85 UFJ 1 2 DC 1 2 3 4 3 2 1 3 2 1 2 1 2002 7 22 UFJ 2002 7 22 CEO 188 2 7 2 UFJ UFJ p 86 p 18 1 2002
 1 20 10 1 21 3 31 1 20 10 1 21 3 31 437444 20 10 121 3 31 1 1 20 10 1 3420 10 121 3 31 4 OEM 100 1 3,097 71 5,495 4 3 90 1414118 41 7 14 19 3 68 9 95 4 66187 95 269 2 PNDGarmin LtdAV 4 2008 2009 3 3 2

Contents 3 Financial Highlights (Consolidated) Consolidated Balance Sheets Financials in comparison with competitors (Consolidated Consolid
 Consolidated Balance Sheets Financials in comparison with competitors (Consolidated Consolid") Facts and Figures 25 Contents 3 Financial Highlights (Consolidated) Consolidated Balance Sheets 13 14 4 15 Financials in comparison with competitors (Consolidated Consolidated Statements of Income Orders
Facts and Figures 25 Contents 3 Financial Highlights (Consolidated) Consolidated Balance Sheets 13 14 4 15 Financials in comparison with competitors (Consolidated Consolidated Statements of Income Orders