: : BSC - - :
|
|
|
- かずひろ みしま
- 9 years ago
- Views:
Transcription
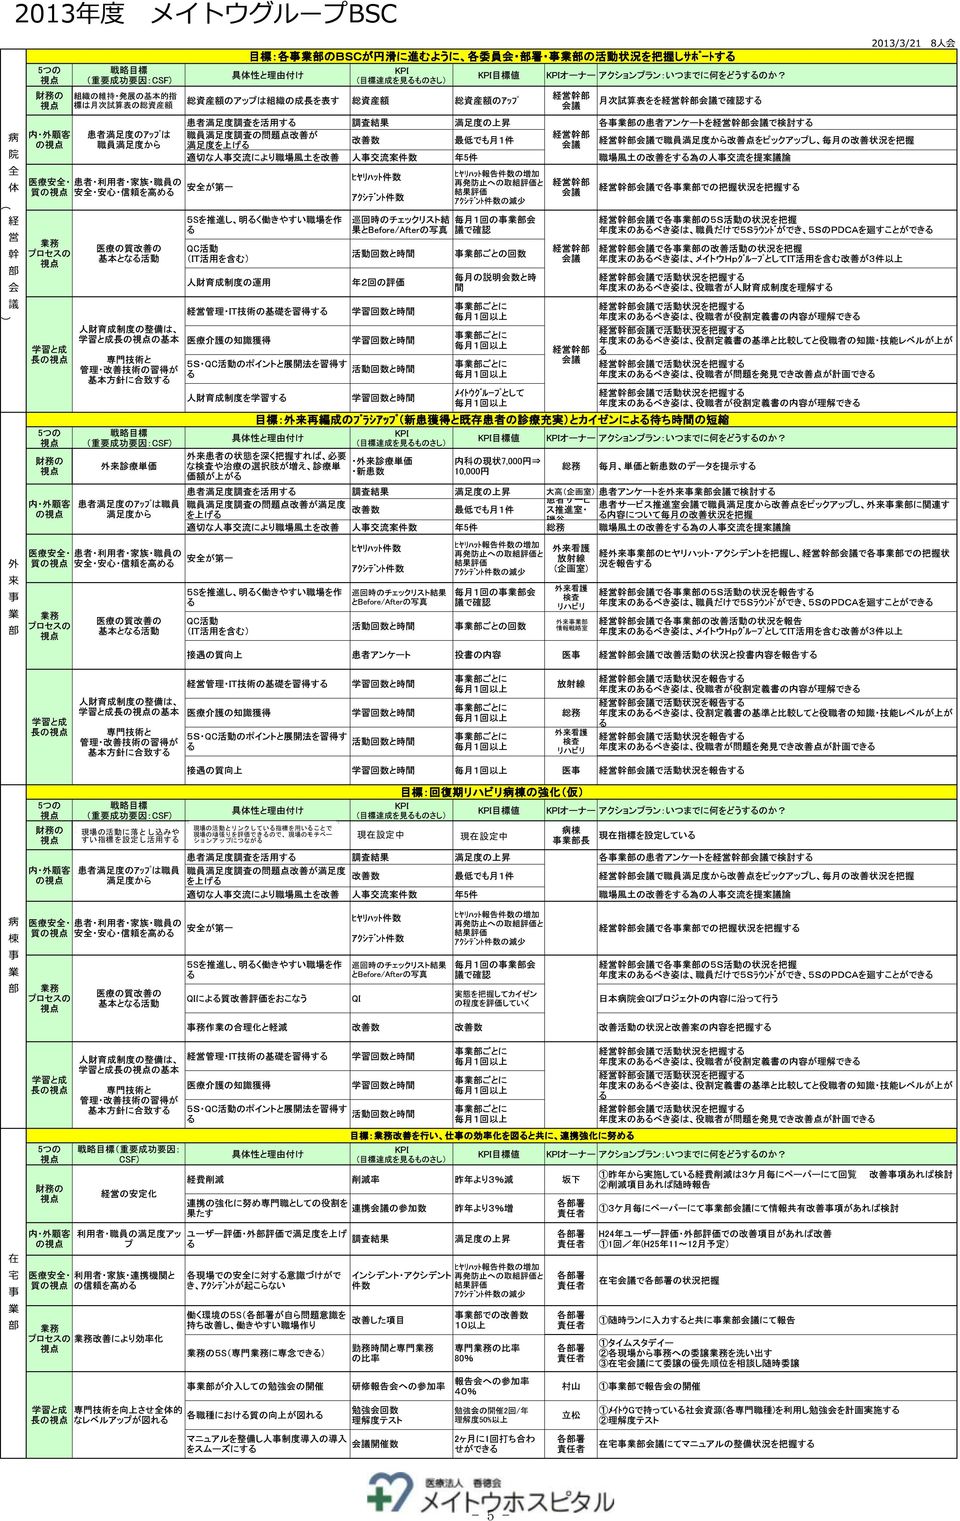
1 2013

2 : : BSC - - :
3 - -
4
5
6
7
8
9
10
11
12
13
14
15
16
17
18
19
20
21
22
23
24
25
26
27
28
29
30 Association of genetic variants of the α kinase1 gene with myocardial infarction in community dwelling individuals Abstract. ALPK1 ALPK1 AG ALPK1 Correspondence to: Key words: Introduction ALPK1 ALPK1 Materials and methods Study population.
31 et alalpk1 Genotyping of polymorphisms. Statistical analysis.
32 ALPK1 ALPK1 GG GA AA ALPK1 AA AG GG ALPK1, ALPK1 ALPK1 ALPK1 ALPK1 Results Study population. Genotype distribution and allele frequencies. Multivariable logistic regression analysis and stepwise forward selection procedure. A G
33 et alalpk1 ALPK1 ALPK1 Haplotype analysis. ALPK1 Discussion ALPK1 A G ALPK1 ALPK1 A G A G ALPK1 ALPK1 ALPK1 ALPK1ALPK1, ;
34 ALPK1 ALPK1 Acknowledgements References et al et al et al et al et al et al; et al et al et al et al et al et al et al et al et al et al et al
35
36
37
38
39
40
41
42
43
44
45
46
47
48
49
50
51
52
53 A 3
54 J o h a n s s o n ( ) % A F I M 11 5
55 A D L I A D L F I M
56 5 0 A A
57
58 , ,
59 A 3
60 NS CW ADL N S 12 CW 8 7 OT 5 ST OTST
61
62
63 . ADL 1,,p 15,H ,,p77,H
64 ) 1.5% 2 B C
65 % 41.9% 12.9% % 35.0% 15.0% 10.0% 5.0% 0% () % % 100% 30.4% % % 2 100% 2 100% 25% 25% 22%
66 100%
67 80.00% 60.00% 40.00% 20.00% 0.00% % 50% 100%
68
69 BSC
70 1
71 25
72 1 KYT
73
74
75
76 25 () BSC
77 FAX 1
78
79 BSC 49 1
80 S BSC
81 25 H25 PT15 OT7 ST S 5S 25 BSC BSC 31 A2FA3F 1) PTOT 9 S S S PTOT S PDF PDF 2
82 S SP-kine No. 2)A2F 6 3 IC 10 PT IC IC IC 91 PTOTST 6
83 3)A3F NsCW 3 20 BSC S BSC
84 S S 3 BSC
85 BSC 2
86 25 S S CPAP CBC Dr BOX S
87 CT
88 25 2 NST S 2 S S BSC
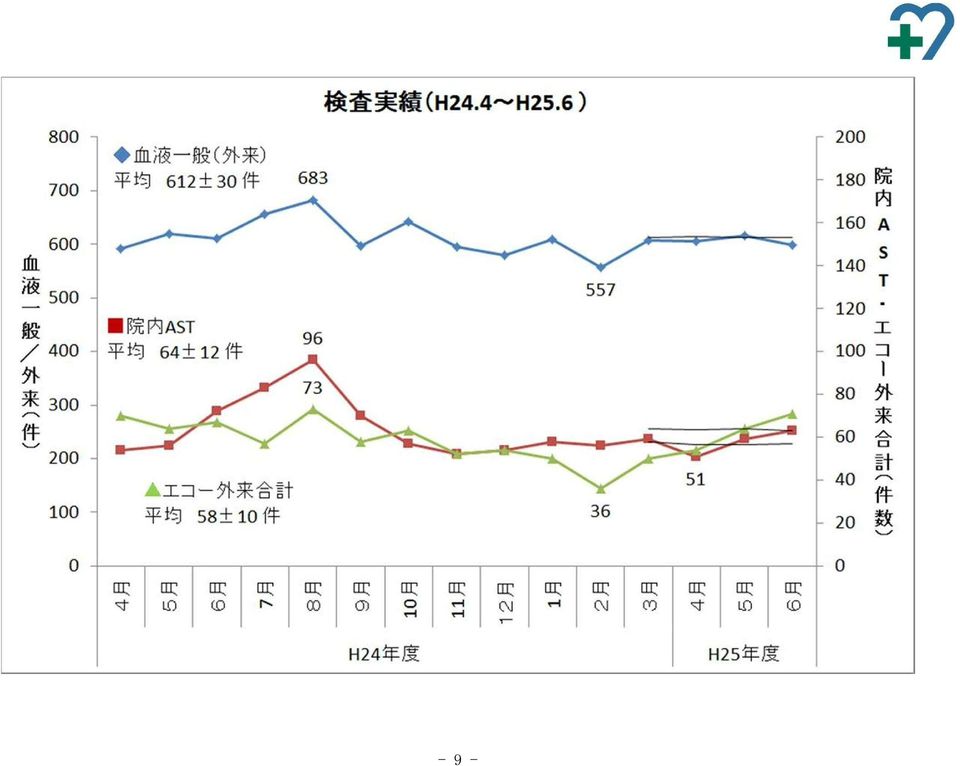
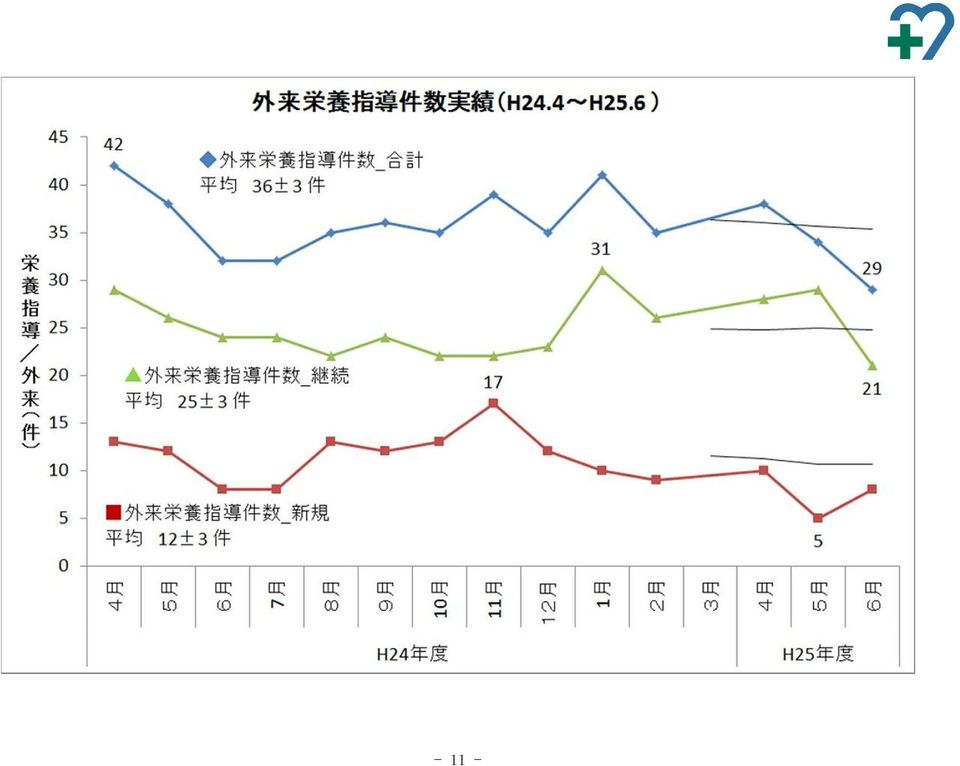
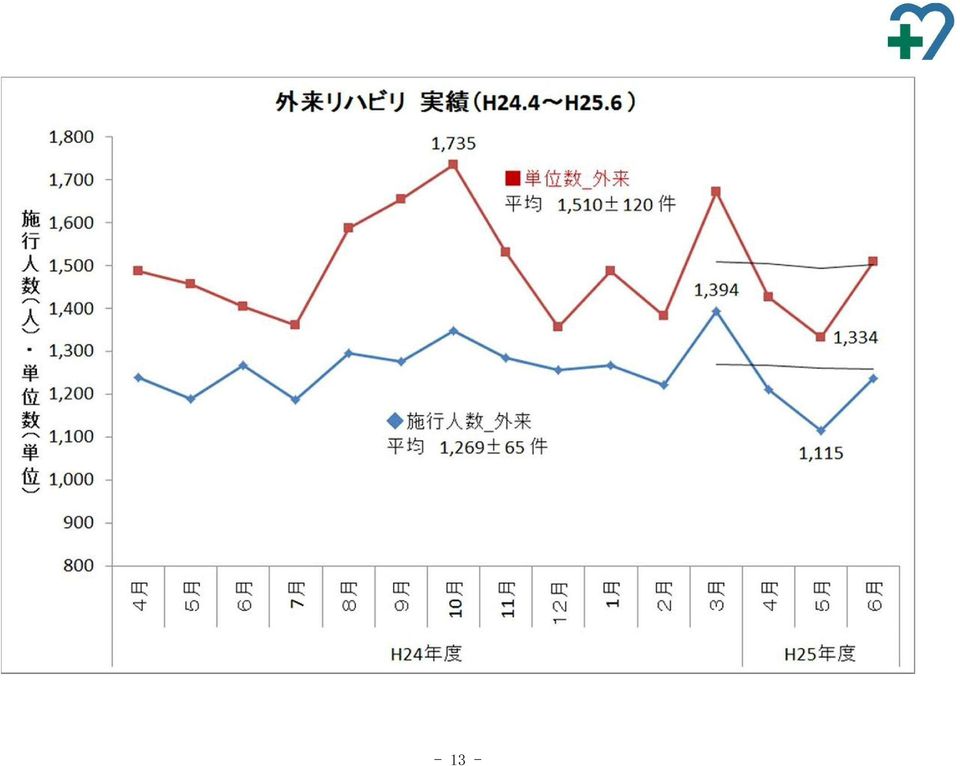
89 H24.4H
90 25 () S S BSC PDCA KPI PR
91 と と
92 25 2 CT UGI BSC PFC 5S
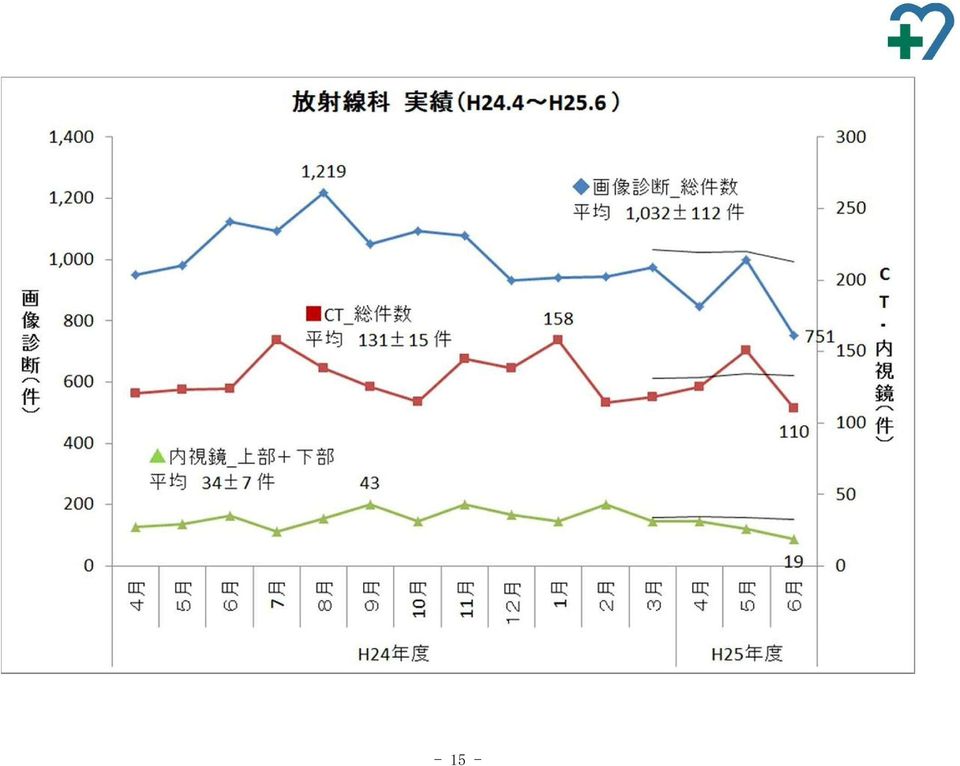
93 25 1,200 1, OPE CT CT 2 CT CT
94 CT
95 25 BSC S
96 BSC BSC
97 25 4 5S 5S 34 1
98 23 1 2
99 S 1 LAN 26 NO
100 H
101
102 5.26
103 S 26 6
1996 2000 2004 1984 2005 7150 000 9 500 9 4 13 10 95 11 11 12 20002004 9 70
 14 2006 1 Key Words 2002 3 1 2 3 3 1 2 3 1969 1987 69 1996 2000 2004 1984 2005 7150 000 9 500 9 4 13 10 95 11 11 12 20002004 9 70 14 2006 1 15 71 72 1 22 6 32 9 200 6 3 1 2 2000 10 1 2003 10 2005 6 5 4

立命館21_川端先生.indd
 21 119-132 2010 ( ) ' Key Words 119 21 2010 7 1962 2001 2001 2007 1982 1988 1997 2007 1997 1998 1863 1880 1 1998 1998 2001 1599 120 121 1599 1695 8 1695 1714 4 1714 1715 5 1715 100 1812 9 1812 1864 2001
pt % =1 1
 1 9.4 4.7pt 94.6 8.1% 12 115 11 15 1 95 9 85 8 75 7 65 1 2 3 19.1 7 2.1 7 21.1 7 22.1 7 4 5 6 7 8 9 19.1 7 2.1 7 21.1 7 22.1 7 119.4 124 14 1 6 1 17=1 19.1 7 2.1 7 21.1 7 22.1 7 1194.6-1 -2-3 -4-5 -6-7
0
 G 1 G 2 3 2 3 4 14 f f 0 G G G G a1 GF f 1 1 1 L I H M K J f 1 5 G G G G GG Aa G f 6 G G G Aa G f 1 2 1 2 3 45 C 123 3 4 1234 5 6 7 123 e 8 9 0 1 2 3 4 1 2 3 4 14 f N f f f 1 1 2 12 3 4 5 6 f 3 G G 1 12


P-12 P-13 3 4 28 16 00 17 30 P-14 P-15 P-16 4 14 29 17 00 18 30 P-17 P-18 P-19 P-20 P-21 P-22
 1 14 28 16 00 17 30 P-1 P-2 P-3 P-4 P-5 2 24 29 17 00 18 30 P-6 P-7 P-8 P-9 P-10 P-11 P-12 P-13 3 4 28 16 00 17 30 P-14 P-15 P-16 4 14 29 17 00 18 30 P-17 P-18 P-19 P-20 P-21 P-22 5 24 28 16 00 17 30 P-23


 1 1 1 46111 2 1061.0 106.3 1/10 24721 90 25 1/4 243 3 23 25 1.4 512 120 280 260 100 240 220 80 200 180 160 60 140 120 40 100 80 20 60 40 20 0 0 55 56 57 58 59 60 61 62 63 2 3 4 5 6 7 8 9 10 11 12 13 14


消防力適正配置調査報告
 8 5 5 20 11 22 4 25 1.1 1 1.2 1 1.3 2 2.1 6 2.2 6 2.3 8 2.4 8 2.5 9 3.1 10 3.2 10 3.3 13 4.1 15 4.2 17 4.3 19 4.4 21 4.5 23 (1) - 1 - (2) (1) ()1 ( ) 8 1 1 143 116 (2) 1-2 - 26 24 19 24 6 21 24 4 19 24
22 25 34 44 10 12 14 15 11 12 16 18 19 20 21 11 12 22 10 23 24 12 25 11 12 2611 27 11 28 10 12 29 10 30 10 31 32 10 11 12 33 10 11 12 34
 22 25 34 44 10 12 14 15 11 12 16 18 19 20 21 11 12 22 10 23 24 12 25 11 12 2611 27 11 28 10 12 29 10 30 10 31 32 10 11 12 33 10 11 12 34 35 10 12 36 10 12 37 10 38 10 11 12 39 10 11 12 40 11 12 41 10 11

untitled
 1 2 3 4 () 5 6 7 8 9 10 2 22 3 11 12 13 2 1-14 1 4 1 18 4 1 4 () 15 16 17 18 19 20 21 () 26 2 22 23 24 26 2 25 26 27 1 NPO 28 29 30 - 1 31 32 33 34 35 1 36 37 - 38 26 2 39 26 2 40 41 61 42 43 44 45 3 6

 131314 131314 100 16712 1 1 16624 63 4 89 27 3 2 2 1 8 38418 23203 132 252710129 134 24 30201320 136 30 144 30146-18239 23 2 132144 132 64 1322132113261 13413412 1348134212 134622 63013626 1441330 3 11520


1
 1 1. 2 1-1. 2 3 1-2.2 4 2. 5 6 7 2-1 2-2 2-3 2-4 2-5 2-1 2-2 2-3 2-4 2-5 PDF PDF 8 P10 9 2-1. 10 2-1. 11 2-1. ( ( 12 2-1. 24 13 2-1. 3 3 14 2-1. 15 2-2. 16 17 2-2. 3 18 2-2. 19 2712 3 1000 20 2841 21 ...

 Attendance Demand for J-League õ Shinsuke KAWAI* and Takeo HIRATA* Abstract The purpose of this study was to clarify the variables determining the attendance in J-league matches, using the 2,699 J-league


 21 1 1 1 2 2 5 7 9 11 13 13 14 18 18 20 28 28 29 31 31 34 35 35 36 37 37 38 39 40 56 66 74 89 99 - ------ ------ -------------- ---------------- 1 10 2-2 8 5 26 ( ) 15 3 4 19 62 2,000 26 26 5 3 30 1 13

PowerPoint Presentation
 2 9/ 3 3 9/ 9 4 5 , PR () 6 ,,, (11) 7 PR 8 9 10 11 TEL. 106 8/131512/291/3 TEL. 107 12/291/3 12 http://www.f-turn.jp/ 13 21 4 21 14 200910 U 200911 U 200911 20102 15 20102 PR 20103 20103 16 20103 20104


untitled
 ,337 37 35 0,349,09 35 55 988 3 0 0 3,387 7 90 0,369,46 5 57 5 0 90 38 8,369 3 4 5 6 7 8 9 0 3 4 5 6 7 8 9 0 3 4 5 6 8 9 30 3 3 5,400 7,00 9,000 0,800,600 4,400 6,00 8,000 9,800,600 3,400 5,00 7,000 8,800
,877 61,524 33, ,292, ,653 57,601 95,188 2,416 1,767,
 02 02 02 180,771 07 02 01 1,377 07 02 02 1,051,703 07 02 05 220,099 07 03 01 926,597 08 02 04 1,877,566 08 04 02 2,973,603 08 05 03 672,950 10 06 03 778,433 10 06 04 735,789 10 06 06 225,392 10 06 07 365,442