アニュアルレポート 2001
|
|
|
- きよはる つつの
- 5 years ago
- Views:
Transcription
1


2 / ,686,661 7,314, % $58, , , , , , , , , ,835 16, , , % $ ,182,906 2,315, % $18, ,807,197 7,827, , , ,800 : Statement of PositionSOP 00-2 Accounting by Producers or Distributors of FilmsSOP SOP , Staff Accounting BulletinSAB101Revenue Recognition in Financial Statements SAB SAB

3 CONNECTED_IDENTITY
4 TO OUR SHAREHOLDERS 2
5 3
6 4
7 * 5
8 6

9 Becoming a Knowledge-emergent Enterprise in the Broadband Era 7
10 8
11 9
12 10

13 11 Sony Corporation Annual Report 2001

14 12
15 13
16 14

17 15 Sony Corporation Annual Report 2001

18 AT A GLANCE ,000 6, ,720 4,670 5,
19 17
20 ELECTRONICS 18
21 19
22 20
23 21
24 22
25 23
26 24
27 25
28 26
29 27
30 ELECTRONICS 28
31 29
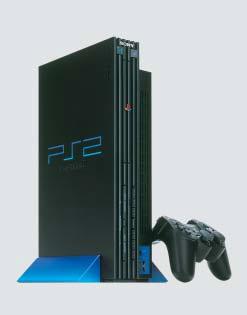
32 GAME 30
33 31
34 32
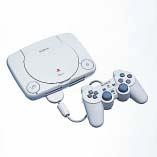
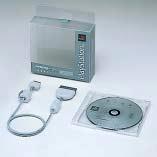

35 GAME 33

36 MUSIC 34

37 35
38 ~ ~ 36


39 MUSIC ~ ~ 37

40 PICTURES 38
41 II II 39
42 40


43 PICTURES 41


44 INSURANCE 42
45 43
46 44

47 ENVIRONMENTAL ACTIVITIES 45
48 46
49 47


50 COMMUNITY RELATIONS 48
51 49
52 TRACKING STOCK 50

53 51
54 MANAGEMENT E 52
55 53
56 54 C
57 FINANCIAL SECTION
58 56
59 57
60 58
61 8,000 1, % 1,000 6, , % 5.0% % 3.1% 400 2, % 75 % % % 4.9% 5.8% 6.3% 6.0%
62 , , % +21% (631.1) (869.4) , , % +12% , , % +249% (51.1) (9.9) (11.3) (30.3) (3.6) , , % +48% %
63 6, , , , % 200 2, % 4.5% 2.6% 1, %
64 62
65 % 13.6% 16.1% 11.8%
66 % 7.5% % 4.0% %
67 % 5.7% 7.1% 7.3% %
68 % % % 5.5% 4.2%
69 , , , , , , ,539 77,905 19,960 12, ,499 90, ,646 22,157 2,275,360 2,759,909 2,288,453 2,780, ,963 1,094, , ,891 1,075,594 1,388, , , , , , , ,908 13,255 2,457,718 2,680,391 2,469,606 2,691,482 1,383,717 1,749,294 5,491,875 6,207,589 6,807,197 7,827, ,124,873 1,366,013 1,124,873 1,366, , ,304 3,403,968 4,006,348 3,499,418 4,146, ,223,229 1,509,317 3,403,968 4,006,348 4,624,291 5,512, , ,977 2,087,907 2,201,241 2,182,906 2,315,453 1,383,717 1,749,294 5,491,875 6,207,589 6,807,197 7,827, , , , , ,308,381 6,890,346 6,306,344 6,887, , ,917 6,308,381 6,890,346 6,686,661 7,314, , ,025 6,106,223 6,683,076 6,463,457 7,089, ,855 17, , , , , (1,550) 40,791 42,256 41,106 40, ,361 16, , , , , ,788 8, , , , , , , ,573 7, ,262 8, ,835 16,754 67
70 , , , , , , (107,892) (244,411) (351,041) (534,637) (449,893) (719,048) ,474 60,037 (68,509) 134,405 (68,075) 134, (1) 3 (27,640) 21,017 (27,641) 21, ,441 55,178 (70,587) (73,997) 33,854 (18,819) , , , , , , , , , , , ,
71 69
72 70
73 71
74 250 % % 13.6% % 6.1% 0.7%
75 73
76 1,500 1,
77 2,500 % 50 3,000 2,000 1,500 1, % 28.4% 29.0% 32.1% 29.6% ,500 2,000 1,500 1,
78 76
79
80 78
81 79
82 80
83 81
84 82
85 83
86 84
87 85
88 86
89 , , , , , , , , (45.6) (3.2) (34.4) (17.4) (36.7) (92.4) (36.7) * (40.80) (40.80) (101.48) (40.80) (92.34) (40.80) ** *: ,650 15,000 8,625 12,480 15,150 10,800 16,300 9, ,425 9,490 6,690 9,900 7,605 7,560 11,725 8,040 1ADR*: $ $ $ $ $ $ $ $ * ** Statement of PositionSOP 00-2 Accounting by Producers or Distributors of FilmsSOP SOP , Staff Accounting BulletinSAB101Revenue Recognition in Financial Statements SAB SAB
90 ,658,253 6,761,004 6,804,182 6,686,661 7,314,824 $58, , , , , ,346 1, , , , , ,868 2, , , ,973 94, , , , , , , , , , ,835 16, *: $ ** , , , , ,268 $ 2, , , , , ,209 3, , , , , ,708 3, ,648 1,045,943 1,030, , ,734 $ 6, ,459,332 1,815,555 1,823,665 2,182,906 2,315,453 18,524 1 * , , , , , $ ,680,246 6,403,043 6,299,053 6,807,197 7,827,966 $62,624 * , , , , ,617 * ** Statement of PositionSOP 00-2 Accounting by Producers or Distributors of Films , SOP Financial Reporting by Producers and Distributors of Motion Picture Films Staff Accounting BulletinSAB101 Revenue Recognition in Financial Statements 2823 SAB
91 ** * ,930,614 4,380,084 4,356,254 4,395,906 4,998,688 $39, % 64.8% 64.0% 65.7% 68.4% , , , , ,147 5, , , , , ,003 4, , , , , ,227 4, , , , , ,913 3, ,621 87,721 85, , , ,658,253 6,761,004 6,804,182 6,686,661 7,314,824 $58,518 * ,029,961 1,127,788 1,072, , ,968 $ 7, % 25.7% 24.6% 21.3% 18.5% , , , ,705 1,097,847 8, , , , , ,028 6, , , ,140 1,052,707 1,332,619 10, , , , , ,226 6, ,930,614 4,380,084 4,356,254 4,395,906 4,998,688 $39, ,589,521 1,848,023 1,917,028 2,121,249 2,400,777 $19, % 27.3% 28.2% 31.7% 32.8% ,635,044 2,101,222 2,158,006 2,027,129 2,179,833 17, ,305,195 1,568,830 1,667,010 1,470,447 1,473,780 11, ,128,493 1,242,929 1,062,138 1,067,836 1,260,434 10, ,658,253 6,761,004 6,804,182 6,686,661 7,314,824 $58,518 : **
92 , ,245 $ 4, ,138 5, ,499 90, ,156,065 1,404,952 11, (100,596) (109,648) (877) , ,876 7, , ,473 1, , ,573 3, ,022,016 3,477,474 27, , ,617 2, , , ,924 1,284,956 10,280 1,075,594 1,388,988 11, , ,394 1, , ,554 6, ,955,015 2,113,005 16, , ,047 1,320 3,007,910 3,297,000 26, ,752,340 1,862,701 14,902 1,255,570 1,434,299 11, , ,289 1, , ,159 2, , ,022 2, , ,118 3,466 1,115,006 1,229,588 9,837 6,807,197 7,827,966 $62,624 90
93 : , ,535 $ 1, , ,838 1, , ,021 7, , ,532 6, , ,031 1, , ,783 3, ,160,342 2,646,740 21, , ,687 6, , ,787 1, , ,148 1, ,124,873 1,366,013 10, , ,101 1,930 2,429,384 2,846,736 22, ,565 19, : ,000, ,350,000,000453,639, , ,500,000,000919,617, ,002 3, , ,401 7, ,223,761 1,217,110 9, ,915 44, (3,678) (49,812) (398) (483,553) (323,271) (2,586) (425,316) (328,567) (2,628) , ,221, (7,805) (7,493) (60) 2,182,906 2,315,453 18, ,807,197 7,827,966 $62,624 91
94 ,415,418 6,238,401 6,829,003 $54, , , ,913 3, ,396 67,943 58, ,804,182 6,686,661 7,314,824 58, ,633,787 4,595,086 5,046,694 40, ,511,014 1,508,983 1,634,007 13, , , ,777 3,270 6,466,121 6,463,457 7,089,478 56, , , ,346 1, ,313 17,700 18, ,720 21,704 29, ,895 27, ,698 11, ,464 28,099 41, , , ,426 50,603 48, , , ,654 1, ,275 42,030 43, , ,792 63,163 68, , , ,132 1, , , ,868 2, , , , ,587 (26,159) (5,579) (45) 176,973 94, , , , ,334 1, ,151 10,001 (15,348) (123) ,563 37,830 44, , , , (104,473) (836) , ,835 16,754 $
95 $ (114.31) (0.91) (105.08) (0.84)
96 , ,835 16,754 $ , , ,268 2, , , ,649 1, ,817 22,860 21, ,151 17,423 24, (58,698) (11,120) (89) (2,464) (28,099) (41,708) (334) (5,181) (727) (18,030) (144) ,587 (26,159) (5,579) (45) ,580 38,699 47, , ,942 (132,566) (177,484) (1,420) ,160 (34,792) (103,085) (825)... (406,184) (411,103) (269,004) (2,152) (24,063) 110,207 95, (30,125) (15,433) 38, , , ,140 1, (57,417) (62,821) (68,927) (551) ,286 87,328 71, (51,882) (697) (14,017) (112) , , ,767 $ 4,358 () 94
97 (368,355) (403,013) (468,019) $(3,744) ,783 29,077 26, (651,226) (178,866) (319,149) (2,553) (89,827) (105,031) (122,563) (981) ,738 97,200 87, ,359 86,493 65, , (121,483) (70,053) (24,425) (196) ,868 78,370 34, ,876 15, (367,260) (449,893) (719,048) (5,753) ,208 30, ,118 1, (69,889) (99,454) (143,258) (1,146) (71,601) 19, , (24,501) (20,589) (22,774) (182) (445) 1,361 (889) (7)... (112,228) (68,075) 134,442 1, (14,855) (27,641) 21, ,924 33,854 (18,819) (151) , , ,064 5, , , ,245 $ 4, , ,891 93,629 $ ,096 43,668 47, , (46,794) , ,936 95
98 , , ,083 (101,266) (2,880) 1,815, ,096 10,094 20, , , ,009 9, (30,699) (30,699) (3,285) (3,285) (143,655) (143,655) , (20,496) (20,496) (4,084) (4,084) ,325 1, , ,236 1,123,591 (269,896) (5,639) 1,823, ,025 1,025 2, ,503 32,494 64, , , , , , ,819 52, (14,387) (14,387) ,321 5, (199,173) (199,173) (33,585) (21,665) (21,665) (8,697) (8,697) ,531 7, , ,716 1,223,761 (425,316) (7,805) 2,182,906 96
99 , ,716 1,223,761 (425,316) (7,805) 2,182, ,151 20,143 40, ,069 1, ,754 16, (7,490) (7,490) (9,909) (9,909) (46,134) (46,134) , , , (466) (466) (22,939) (22,939) (2,123) (2,123) ,435 2, , ,401 1,217,110 (328,567) (7,493) 2,315, $3,612 $7,526 $9,790 $(3,402) $(62) $17, (60) (60) (79) (79) (369) (369) ,282 1, (4) (4) (183) (183) (17) (17) $3,776 $7,699 $9,737 $(2,628) $(60) $18,524 97
100 98
101 99
102 100
103 101
104 102
105 103
106 104
107 () ,415,418 6,238, , , , ,055 $4, , ,198 1, , ,623 1, , ,876 $7, , ,522 $1, ,976 77, ,634 37, ,270 12, , ,617 $2,
108 , ,419 $1, , ,076 1, , ,519 1, , ,014 $4, , ,966 $1, , ,876 1, , ,172 1, , ,014 $4, , , ,213 $3, , , ,388 1, (36,862) (89,207) (65,229) (522) 106
109 ,453 19,717 $ ,085 9, ,885 32,045 31,239 $ ,932 5,301 75, ,237 40,646 7, , ,571 53,264 2, , ,759 66,905 2,594 90,070 45,868 32,555 8,119 70, , , , ,551 9, , ,932 85,882 10,515 1,021,
110 $7,069 $426 $19 $7, $7,567 $687 $84 $8,
111 ,799 1,936 $ ,713 16, ,059 37, (19,981) (22,850) (183) 25,590 33,621 $ ,396 $ , , , , , , , , , ,713 $ ,659 $ , , , , , ,779 $2,
112 110
113 % , % ,240 $ 546 : 10.5% , % , , ,535 $1, % 6.39% , % 6.69% ,908 $ 479 : 6.25%2000 ~ ,158 : 6.75% 7.25%2001 ~ , % 7.55% , % 7.55% , % % ,114 2, % , % ,380 8, , % , ,883 2, % , % ,500 3, % ,733 3, % ,696 3, : 1.55% , % ,000 80, % , : 2.04% , % , ,268 1, % ,000 () 111
114 % , % , % ,000 15,000 $ % ,000 15, % ,000 15, % , % , % , % 11.67% , % 9.30% , ,603 20, ,337 1,014,525 8, , ,838 1, , ,687 $6, ,894 $ ,264 $ , ,167 $ , ,457 $ , ,838 $1, ,375 1, , ,000 2, ,211 1,
115 113
116 (972,337) (1,893,521) (1,014,525) (1,395,706) $(8,116) $(11,166) ,479 (7,864) (17,226) (63) (138) ,422 7,422 5,964 5, (2,892) (2,892) (6,897) (6,897) (55) (55) (253) (457) (2,469) (3,797) (20) (30) (32,362) (9,032) (72) (179) (179) 114
117 ,743 46,306 46,400 $ ,020 14,898 19, (9,618) (11,236) (26,216) (209) (375) (375) (375) (3) ,032 5,733 7, ,234 1, ,036 56,661 47,079 $ ,842 17,836 16,841 $ ,333 6,095 6, (4,475) (4,989) (6,492) (52) (122) (108) (36) (0) (46) (274) (142) (341) (3) ,646 18,646 17,332 $
118 , ,803 $5,839 92, ,992 $ ,306 46, ,836 16, ,898 19, ,095 6, ,806 5, (7,665) 1, (1,708) (14) ,021 27, ,564 (326) (3) (13,861) 15, (13,424) (28,905) (231) (11,594) (13,311) (107) , ,322 6, , ,162 1, , ,943 4,064 60,297 78, ,355 (85,468) (684) 18,748 (2,567) (21) (8,332) 8, ,721 44, ,302 7, ,806 5, (6,260) (13,096) (105) (4,994) (6,895) (55) , ,167 3,681 78,842 86, , ,155 2,730 25,150 41, (121,184) (236,747) (1,894) (811) (9,943) (79) ,979 1, (3,805) (4,178) (34) 2,110 2, , ,834 $ ,659 34,174 $ , ,283 $1,514 26,659 34,174 $ (820) (1,419) (11) (6,352) (86,030) (688) , ,834 $ ,659 34,174 $
119 % 2.7% 2.7% % % %
120 ,195, , ,217, ,439, , ,028, ,979, ,639, ,639, , ,145, , ,617,
121 ,484 1,525 9, (58,698) 27,999 (30,699) (4,617) 1,332 (3,285) (151,971) 8,316 (143,655) (207,802) 39,172 (168,630) ,822 (27,003) 52, (17,196) 2,809 (14,387) ,190 (3,869) 5, (202,596) 3,423 (199,173) (130,780) (24,640) (155,420) (6,290) (1,200) (7,490) (16,095) 6,186 (9,909) (79,678) 33,544 (46,134) ,144 (8,862) 160, ,081 29,668 96,
122 $ (50) $ (10) $ (60) (129) 50 (79) (637) 268 (369) ,353 (71) 1, $ 537 $237 $
123 ,078 5,306 1,357,568 5,846 1,531,573 6,456 $ ,000 6, ,000 7,167 1,420,900 12, (53,510) 3,025 (383,995) 5,333 (111,103) 5, (41,100) 12, ,357,568 5,846 1,531,573 6,456 2,800,270 9,911 $ ,568 5, ,966 5, ,265 6,332 $ ,894 10, ,420,470 6,543 $ ,265 6,332 $ ,001 15, ,379,800 13, ,894 15, ,800,270 9,911 $ ,265 6,332 $
124 , , ,227 $ , , , , ,835 16,754 $ , ,191 14, EPS: $ EPS EPS: $ EPS % 0.60% 2.68% % 33.12% 44.07% % 0.40% 0.21% 122
125 ,400 6,106 2,190,750 5,426 4,046,490 5,443 $ ,725,850 5,234 2,306,610 5, ,700 9, (439,736) 5,308 (588,092) 5, (19,500) 5,275 (11,134) 5,502 (47,852) 5, ,190,750 5,426 4,046,490 5,443 3,565,246 6,218 $ ,496 5,711 1,397,216 5,966 $ ,732 5, ,134 4,599 $ ,727 4,596 $ ,001 10, ,268,662 6, ,289,564 6, ,001 15, ,450 13, ,925 15, ,732 15, ,565,246 6,218 $ ,397,216 5,966 $
126 124
127 ,944 70, ,987 $1, , , , , , ,868 $2, ,970 59,239 89,708 $ ,416 61,564 31, , , ,113 $ ,433 (17,977) (106) $ (1) ,154 (8,182) (5,473) (44) 18,587 (26,159) (5,579) $ (45) % 42.0% 42.0% (1.3) (1.3) (1.7) (2.8) (5.6) (6.5) (3.5) (2.1) (0.8) % 35.8% 43.5% 125
128 ,490 97,084 $ ,761 90, ,049 68, ,293 39, , ,912 34, ,774 18, , ,105 1, , ,906 4, (112,191) (198,613) (1,589) , ,293 2, (86,873) (97,345) (779) (60,518) (68,941) (552) (45,872) (42,385) (339) (35,437) (30,451) (244) (23,097) (29,967) (240) (55,778) (53,428) (426) (307,575) (322,517) (2,580) (30,226) 11,776 $ , ,473 $ 1, ,852 51, (6,316) (6,463) (52) (184,020) (175,148) (1,401) (30,226) 11,776 $
129 , , ,227 $ ,361 2,537 2, EPS , , ,644 $ , , , , ,174 79,830 EPS , , ,234 EPS $1.06 EPS $
130 128
131 ,356,254 4,395,906 4,998,688 $39, , , ,222 4, ,669,702 4,719,625 5,523,910 44, , , ,147 5, ,751 24,074 14, , , ,916 5, , , ,003 4, ,394 41,837 41, , , ,113 4, , , ,227 4, , , ,227 4, , , ,913 3, , , ,917 3, , , , , , ,269 2, , , ,115 3, (584,790) (631,121) (869,374) (6,955) ,804,182 6,686,661 7,314,824 $58,
132 , , ,652 $ 1, ,418 76,935 (51,118) (409) ,527 28,293 20, ,959 35,920 4, ,013 20,855 17, (352) (9,860) (11,276) (90) , , ,967 1, ,282 10,362 13, (22,737) (40,698) (16,997) (136) , , ,346 1, , , ,654 1, (110,067) (105,193) (127,132) (1,017) , , ,868 $ 2, ,058,355 3,074,917 3,554,615 $28, , , ,737 5, , , ,360 5, , , ,806 7, ,129,005 1,383,717 1,749,294 13, , , ,508 4, ,356,552 6,927,513 8,164,320 65, (215,732) (273,514) (464,403) (3,715) , , ,049 1, ,299,053 6,807,197 7,827,966 $62,
133 , , ,769 $1, ,895 13,414 37, ,523 32,807 34, ,377 10,599 11, ,085 23,699 40, ,354 10,666 7, , , ,263 2, ,331 3,045 2, , , ,268 $2, , , ,883 $2, , , , ,222 24,644 37, ,988 11,947 11, ,979 1, ,333 47,801 17, , , ,519 3, ,047 2,234 1, , , ,209 $3, ,072, , ,968 $ 7, , ,705 1,097,847 8, , , ,028 6, ,140 1,052,707 1,332,619 10, , , ,226 6, ,356,254 4,395,906 4,998,688 $39,
134 ,917,028 2,121,249 2,400,777 $19, ,158,006 2,027,129 2,179,833 17, ,667,010 1,470,447 1,473,780 11, ,062,138 1,067,836 1,260,434 10, ,804,182 6,686,661 7,314,824 $58, ,345 1,321,357 1,433,038 $11, , , ,148 6, , , ,174 1, , , ,249 1, ,931,180 2,229,455 2,547,609 $20,
135 ,345,717 2,560,839 2,753,063 $ 22, ,822,282 1,837,048 2,322,037 18, ,167,999 4,397,887 5,075,100 40, ,232,816 2,082,505 2,315,985 18, , , ,581 1, ,373,055 2,253,394 2,500,566 20, ,480,076 1,302,917 1,305,013 10, ,466 48,751 48, ,545,542 1,351,668 1,354,004 10, , , ,763 7, , , ,648 6, ,469,813 1,458,721 1,793,411 14, (2,752,227) (2,775,009) (3,408,257) (27,266) ,804,182 6,686,661 7,314,824 $ 58, ,704 84, ,674 $ 1, ,728 97,295 23, ,013 51,218 11, ,627 73,249 71, (75,011) (83,188) (36,159) (289) , , ,346 $ 1,
136 PricewaterhouseCoopers
137 135
138 E E 136
139 TEL: FAX: IR TEL: FAX: Sony Corporation of America Investor Relations 550 Madison Avenue, 9th Floor, New York, NY TEL: FAX: Sony Global Treasury Services Plc. Investor Relations St. Helens, 1 Undershaft, London EC3A 8NP TEL: FAX: ADR Morgan Guaranty Trust Company of New York Shareholder Relations P.O. Box , Boston, MA , U.S.A. TEL: CIBC Mellon Trust Company 2001 University Street, 16th Floor, Montreal, Quebec, H3A 2A6, Canada TEL: TEL: % % 154 VOC 617, TEL: FAX:
140 Printed in Japan
アニュアルレポート 2000
 2000 2000 3 3 31 1 : : 1 1 1999 2000 2000/1999 2000..................... 6,804,182 6,686,661 1.7% $63,082............................... 348,212 240,627 30.9 2,270............................. 377,691
”‚’¶fi° JAR 97 Ł\”ƒ-1
 1997 1996 1995 588,572 42,898 19,152 560,821 37,012 17,507 540,361 26,490 11,382 1997 5,118,017 373,026 166,539 436,705 94,610 57,257 404,181 101,675 54,965 387,314 97,606 55,441 3,797,435 822,695 497,887
 Annual 2002 Report Financial Highlights 2002 2001 2000 2002 2,581,399 2,750,418 2,680,611 19,372 28,402 26,494 11,173 213 4.17 3.89 1.64 $ 0.031 907,150 979,695 889,220 6,807 4,030,596 4,232,011 4,172,459
DCR-PC300K/IPK
 3-084-945-02(1) 6 19 31 34 39 2003 Sony Corporation * b 2 3 6 19 31 4 34 39 5 \ 6 * * * 7 1 2 * 3 b 4 1 2 5 6 8 7 1 8 1 2 *, 9 2 7 3 8 * 4 9 5 6 z 10 10 1 2 3 1 1 11 2 * 2, 11 3 8 4 5 9 6 7 12 13 b,,,,,
NEC THE INTERNET SOLUTION PROVIDER NEC NEC 12 NEC 16 NEC NEC NEC NEC NEC NEC
 NEC CORPORATION NEC NETWORKS NEC SOLUTIONS THE RIGHT STRENGTHS FOR THE INTERNET ERA NEC ELECTRON DEVICES NEC THE INTERNET SOLUTION PROVIDER NEC 1 2 6 10 NEC 12 NEC 16 NEC 20 24 54 55 56 NEC NEC NEC NEC

ゼリア新薬工業株式会社
 C O N T E N T S TOP INTERVIEW Q A Q A Q A 10.9 22.9 66.2 ZERIA Pharmaceutical Co.,Ltd. 1 TOP INTERVIEW Q A 2 ZERIA Pharmaceutical Co.,Ltd. ZERIA Pharmaceutical Co.,Ltd. 3 Q A Q A Q A Q A R&D III II I II
3 31 1 * 1 % 1 2002 2003 2003/2002 2003 7,578,258 7,473,633 1.4% $62,280 134,631 185,440 +37.7 1,545 92,775 247,621 +166.9 2,064 9,332 115,519 +1,137.
 Annual Report 2003 2003 3 3 31 1 * 1 % 1 2002 2003 2003/2002 2003 7,578,258 7,473,633 1.4% $62,280 134,631 185,440 +37.7 1,545 92,775 247,621 +166.9 2,064 9,332 115,519 +1,137.9 963 15,310 115,519 +654.5
Profi le and Contents Design for Sports
 Profi le and Contents Design for Sports DESCENTE LTD. Design for Sports 1 Interview with President 2 DESCENTE LTD. Design for Sports 3 4 DESCENTE LTD. Design for Sports 5 Medium-term Management Plan 6
Profi le and Contents Design for Sports
 Profi le and Contents Design for Sports Design for Sports DESCENTE LTD. 1 Interview with President 2 Design for Sports DESCENTE LTD. 3 4 Design for Sports DESCENTE LTD. 5 New Midium Term Management Plan
JAPAN SYSTEMS V ision Contents 2 3 5 7 8 9 11 13 14 01
 JAPAN SYSTEMS Business Report 38 Total Solution Provider For Innovation BusinessReport 2007 38 2007 JAPAN SYSTEMS V ision Contents 2 3 5 7 8 9 11 13 14 01 To Our Shareholders JAPAN SYSTEMS Business Report
Financial Statements 2004
 Financial Statements 2004 10,150 5,591 $ 92,227 16,078 13,561 146,100 463 462 4,205 193 205 1,758 915 607 8,317 1,202 1,088 10,918 (80) (83) (726) 28,921 21,431 262,799 1,435 927 13,035 657 656 5,964 537
Q A Q A 1
 IHI Report Q A Q A 1 Q A Q A To Our Shareholders 2 706 803 42 9 1,030 790 66 17 1,894 1,716 55 103 3 Business Review by Segment 1,350 57 45 1,310 704 34 16 755 103 31 16 41 763 16 10 554 4 Performance
KDDI Annual Report 2002
 pg.22 KDDI CORPORATION Annual Report $ 515 3,610 (194) 734 247 275 5,187 21,239 3,607 975 483 1,081 141 27,526 (12,882) 14,644 489 298 1,833 460 378 842 (90) 4,210 $24,041 68,596 481,064 (25,793) 97,797
1 2 3
 1 2 3 2. 3. 1 2 3 2. 2 3 4 5 1 2 3 4 2. 1 2 3 4 5 6 7 1. 2. 4. 1 2 5. 3 4 .5 52. 53 1.53 53 55 56 57 60 2.64 3.64 4.65 5.66 66 67 68 6.74. 75 1.75 75 75 76 77 78 2.80 80 80 80
, ,334451,177 4, ,149109,510 1, ,069 40,
 49 12 31 20 1998 3 31 1999 3 31 2000 3 31 1 232,753 277,037 260,529 2,454 1. 2. 50 1998 3 31 1999 3 31 2000 3 31 1 444,401 487,334451,177 4,250 3 1999 3 31 2000 3 31 122,149109,510 1,031 1999 3 31 2000
untitled
 01 TO OUR SHAREHOLDERS 01 02 07 08 11 11 13 14 247,110 398,252 193,791 4,499 199,962 645,362 79,322 42,135 121,458 495,892 17,562 10,448 523,904 645,362 341,720 225,588 116,132 76,043 40,089 7,885
Profi le and Contents Design for Sports
 Profi le and Contents Design for Sports Design for Sports DESCENTE LTD. 1 Interview with President 2 Design for Sports DESCENTE LTD. 3 4 Design for Sports DESCENTE LTD. 5 6 Topics Design for Sports DESCENTE
株式会社幸楽苑
 35th Business Report http://www.kourakuen.co.jp/ To Our Shareholders Management Report CONTENTS 1 2 3 6 7 8 9 11 14 15 16 17 1 2 Management Strategy 3 4 5 6 Management Strategy Commentary Information 7
ntv AR05 new/J
 Financial Section 24 25 34 34 34 36 37 38 39 43 44 56 23 1999 2000 2001 2002 2003 2004 328,013 352,409 358,682 336,299 328,374 357,614 203,862 207,743 218,888 215,180 217,844 245,109 54,350 67,302 63,573
日本農産工業株式会社
 http://www.nosan.co.jp F E E D F O O D To Our Shareholders L I F E T E C H Review of Operations F E E D 17/3 16/3 15/3 17/3 16/3 15/3 17/3 16/3 15/3 Review of Operations F O O D Review of Operations Review
アニュアルレポート 2017
 2017 Financial Section 16 5 17 20 22 22 23 24 25 36 16 ISUZU MOTORS LIMITED 5 2017 2016 2015 2014 2013 2017 : 1,953,186 1,623,948 329,238 182,793 146,444 152,022 148,921 93,858 1,926,967 1,574,885 352,081
東洋水産 株式会社
 1 1978 1980 1989 1995 1996 2 1998 2000 2003 Products Information 3 4 5 To Our Shareholders 6 7 96 085 94 218 97 163 23 407 19 234 24 275 43 023 43 626 41 669 53 46 23 133 25 192 23 643 1 726 2 096 2 013
untitled
 financial report - 1 - - 2 - - 3 - - 4 - - 5 - - 6 - - 7 - - 8 - - 9 - - 10 - - 11 - - 12 - - 13 - - 14 - - 15 - - 16 - - 17 - - 18 - - 19 - - 20 - - 21 - - 22 - - 23 - - 24 - - 25 - - 26 - - 27 - -
UNI_AR04_J_Cover
 Unicharm Corporation Annual Report 2004 1 2 8 10 12 13 14 16 17 39 40 41 Unicharm Annual Report 2004 1 2004 2003 2002 2004 240,110 223,169 206,707 $2,265,189 30,727 25,793 18,974 289,878 16,240 12,879

C O N T E N T S 1. 2. 3. 4. 5. 6. 7. 8. 9. 10. 11. 12. 13. 14. 15. 16. 17. 18. 2009 Annual Report
 C O N T E N T S 1. 2. 3. 4. 5. 6. 7. 8. 9. 10. 11. 12. 13. 14. 15. 16. 17. 18. 2009 Annual Report 1 1 2009 Annual Report 1. 2. 2 2 2009 Annual Report 3 3 2009 Annual Report 3. 1980 1991 1992 1993 1994
18年度石見美術館年報最終.indd
 A Annual Report Annual Report B 1 Annual Report Annual Report 2 3 Annual Report Annual Report 4 Annual Report 5 Annual Report 6 7 Annual Report Annual Report 8 9 Annual Report Annual Report 10 11 Annual
 26 1. 2. 3. 4. 5. Annual Report 26 1 C o n t e n t s... 2... 3 Growth Action 21... 4... 6... 11 At a Glance... 12... 14... 31... 32... 34... 35... 36 CSR... 38... 4... 41... 72... 74... 75 2 3 311 * 26
アニュアル レポート 2017|財務情報
 At a Glance 1. 2. 3. 1 AI Toyota New Global Architecture TNGA Chief Financial Offi cer M&A 3 Toyota AI Venture 1 M&A 4 At a Glance AA 3% 4,499 6,9 217 215 7 31 AA 21 215 9 217 3 1 1 AA 25 2 25, 15 15,
Contents LINK TO GOOD LIVING 1
 5938 216 3 215 4 1216 3 31 Contents... 2... 3... 7... 9... 11... 13... 14... 18... 19... 21... 22... LINK TO GOOD LIVING 1 LIXILCEO 5 3 IoT 6 3 INAX LIXIL CEO 2 196 6 1983 2 MonotaRO MonotaRO11 21 MonotaRO

80期期末_表1_web.ai
 80 01 TO OUR SHAREHOLDERS 01 01 02 05 11 12 13 14 Go! Next 60 02 Go! Next 60 03 04 Go! Next 60 TOPICS 05 TOPICS 06 TOPICS 07 TOPICS 08 TOPICS 09 10 TOPICS FINANCIAL REVIEW 2,978 3,054 3,264 387 379 421
1 Annual Report 212
 ANNUAL REPORT 212 1 Annual Report 212 C O N T E N T S 3 4 5 7 9 11 13 15 17 19 38 39 4 41 About the Cover Page ART IN THE OFFICE Annual Report 212 2 Consolidated Financial Highlights 3,497 24,812 22,499
To Our Shareholders 1
 IR WINTER 2005 To Our Shareholders 1 NIPPON OIL CORPORATION 2 Feature 3 NIPPON OIL CORPORATION 4 Topics Topics 1 Topics 2 5 NIPPON OIL CORPORATION Topics 3 6 Financial Review 7 NIPPON OIL CORPORATION 8
4% P % 11.1%1, % %1, %1, % 3.5%1, % %1, % Santen Ph
 Financial Section 11 5 54 56 58 59 6 63 http://www.santen.co.jp/ja/ir/document/securities.jsp Santen Pharmaceutical Co., Ltd. Annual Report 215 49 4% 215 3 214 3 P.8 2 98.4% 11.1%1,592 62 12.6% 25 69 1.6%1,618
To Our Shareholders Question 1 Question 2 1 2
 HEIWA INTERIM BUSINESS REPORT 2010 To Our Shareholders Question 1 Question 2 1 2 To Our Shareholders Business Review Question 3 3 4 Special Feature To Our Shareholders 5 6 Special Feature Consolidated
9104
 01 To Our Shareholders 02 03 Consolidated Financial Statements 12,000 8,878 9,039 9,102 9,972 11,300 8,000 5,636 4,000 0 2001/3 2002/3 2003/3 2004/3 2004/9 2,000 1,500 1,600 1,000 500 530 373 334 905 742
株式会社グローバルダイニング
 15,453 7,390 4,292 1,662 3,786 3,176 1,319 717 2,044 796 791 598 1,704 1,808 2,309 2,415 1,934 2,010 823 550 8,333 1,777 1,539 610 59 58 58 278 343 172 444 188 410 496 16,355 17,233 933 1,261 3,515 3,882
 Contents FY2011 Highlight Financial Data Business Outline Of ZOZOTOWN To Overseas Customers Business Outline Of Affiliated Companies About Us Appendix : Notice of the 14th Annual General Meeting of
1. 2. 3. 4. 5. Contents The Asahi Kasei History... 1... 4... 5 Growth Action 21... 6... 12 At a Glance... 14... 16... 32 CSR... 36... 38... 39... 7...
 27 27 1. 2. 3. 4. 5. Contents The Asahi Kasei History... 1... 4... 5 Growth Action 21... 6... 12 At a Glance... 14... 16... 32 CSR... 36... 38... 39... 7... 72... 73 The Asahi Kasei History 1922 1931 199199
Ver. 1.0 (discretion) (revenue management) (fictitious revenue recognition) (window dressing) (fraudulent accounting practice) SEC (General
 (revenue management) (fictitious revenue recognition) (window dressing) (fraudulent accounting practice) SEC (General") 2004.11.25 Ver. 1.0 (discretion) (revenue management) (fictitious revenue recognition) (window dressing) (fraudulent accounting practice) SEC (Generally Accepted Accounting Principles: GAAP) GAAP (realization
2004.11.25 Ver. 1.0 (discretion) (revenue management) (fictitious revenue recognition) (window dressing) (fraudulent accounting practice) SEC (Generally Accepted Accounting Principles: GAAP) GAAP (realization
Channel to Discovery Plan &
 2007 Channel to Discovery Plan & 3 2007 3 2008 1 1 2 6 8 2006 10 14 1 2 16 19 20 22 24 26 28 30 32 34 36 42 43 44 45 70 71 72 2000 10 1 2007 2 2007 2000 10 3 2010 M 2007 M 2010 1,000 2006 2006 M&A 102006

コマツAR (本文)
") 01 04 p14 p16 Face to Face Innovation through Teamwork 07 13 p24 p28 22 p18 p30 p32 30 34 p20 37 89 90 92 ON THE RECORD 2 2,430 18.5% 3,328 36.0% 01 14.8 % 1.9 3,222 36.2% 2,087 26.8% ON THE MOVE 14.8%
01 04 p14 p16 Face to Face Innovation through Teamwork 07 13 p24 p28 22 p18 p30 p32 30 34 p20 37 89 90 92 ON THE RECORD 2 2,430 18.5% 3,328 36.0% 01 14.8 % 1.9 3,222 36.2% 2,087 26.8% ON THE MOVE 14.8%

株式会社テレビ朝日
 To Our Shareholders 68 2006FIFA TM 607.9 71112.3 71011.5211 18.4 22 2006FIFA TM AFC 200750 1.5 5 204 NEW AIR, ON AIR. NEW AIR ON AIR 1 Ropping X SUMMER SONIC 0750 DVD 237 23 233,000200 50 206 195 tv asahi
東京建物不動産販売株式会社
 Business Report To Our Shareholders 1 Tokyo Tatemono Real Estate Sales Co.,Ltd. Tokyo Tatemono Real Estate Sales Co.,Ltd. 2 Business Overview 3 Tokyo Tatemono Real Estate Sales Co.,Ltd. Tokyo Tatemono
* ,195,393 1,269,415 $8,987,917 45,664 96, ,338 10,679 50,318 80,293 5,180 25,177 38,947 ** 1,193,011 1,240,008 8,970,008
 2002 2002 3 Breakthrough * 3 31 1 2002 2001 2002 1,195,393 1,269,415 $8,987,917 45,664 96,024 343,338 10,679 50,318 80,293 5,180 25,177 38,947 ** 1,193,011 1,240,008 8,970,008 ** 496,826 516,013 3,735,534
 At TOKYO GAS CO., LTD. Annual Report 2001 For the year ended March 31, 2001 The Frontier Of Change 2001 2000 1999 2001.......................................... 1,086,771 992,255 997,767 $ 8,835,537........................................
NEC NEC 3 NEC NEC EMBRACES THE FUTURE 6 REVIEW OF OPERATIONS NEC 12 NEC 16 NEC
 NEC CORPORATION 2001 NEC SOLUTIONS NEC NETWORKS NEC ELECTRON DEVICES NEC NEC 3 NEC 3 1 2 NEC EMBRACES THE FUTURE 6 REVIEW OF OPERATIONS 2001 3 10 NEC 12 NEC 16 NEC 20 24 55 56 57 1999 2000 2001 3 31 1999
ozu_no98_H.qxd (Page h1)
") To Our Shareholders CONTENTS 1 2 3 4 56 78 911 112 13 14 TM 1 2 Group Corporate Information Segment Information 3 4 Topics Topics1 Topics2 Topics3 5 6 8 Special Contents 7 Financial Statements [Consolidated]
To Our Shareholders CONTENTS 1 2 3 4 56 78 911 112 13 14 TM 1 2 Group Corporate Information Segment Information 3 4 Topics Topics1 Topics2 Topics3 5 6 8 Special Contents 7 Financial Statements [Consolidated]
01(全頁)FinancialReport2012.pdf
FinancialReport2012.pdf") Financial Report 2012 KYOTO UNIVERSITY 02 03 04 05 06 08 10 12 14 16 18 19 20 22 24 25 26 27 28 30 02 Kyoto University Financial Report 2012 MD&A Kyoto University Financial Report 2012 03 04 Kyoto University
Financial Report 2012 KYOTO UNIVERSITY 02 03 04 05 06 08 10 12 14 16 18 19 20 22 24 25 26 27 28 30 02 Kyoto University Financial Report 2012 MD&A Kyoto University Financial Report 2012 03 04 Kyoto University
 13,825,228 3,707,995 26.8 4.9 25 3 8 9 1 50,000 0.29 1.59 70,000 0.29 1.74 12,500 0.39 1.69 12,500 0.55 10,000 20,000 0.13 1.58 30,000 0.00 1.26 5,000 0.13 1.58 25,000 40,000 0.13 1.58 50,000 0.00 1.26
1) IT IR CSR 120 DAIWA SECURITIES GROUP ANNUAL REPORT 2010
 IT IR CSR 120 DAIWA SECURITIES GROUP ANNUAL REPORT 2010") p120 p126 p130 p131 p133 DAIWA SECURITIES GROUP ANNUAL REPORT 2010 119 1) 2010 7 1 IT IR CSR 120 DAIWA SECURITIES GROUP ANNUAL REPORT 2010 121 DAIWA SECURITIES GROUP ANNUAL REPORT 2010 CEO COO SMBC PI
p120 p126 p130 p131 p133 DAIWA SECURITIES GROUP ANNUAL REPORT 2010 119 1) 2010 7 1 IT IR CSR 120 DAIWA SECURITIES GROUP ANNUAL REPORT 2010 121 DAIWA SECURITIES GROUP ANNUAL REPORT 2010 CEO COO SMBC PI
アニュアルレポート 2002
 2002 2002 3 Sony Corporation Annual Report 2002 3 31 1 : : 1 1 2001 2002 2002/2001 2002 7,314,824 7,578,258 +3.6% $56,979 225,346 134,631 40.3 1,012 265,868 92,775 65.1 698 121,227 9,332 92.3 70 16,754
 Title 人 的 資 源 の 会 計 的 認 識 : 日 英 プロサッカークラブの 実 務 を 例 として Author(s) 角 田, 幸 太 郎 Citation 經 濟 學 研 究, 55(4): 79-94 Issue Date 2006-03-09 DOI Doc URLhttp://hdl.handle.net/2115/5835 Right Type bulletin Additional
2 1 To Our Shareholders Financial Highlights
 2 1 To Our Shareholders Financial Highlights Review of Operations % % % % 3 4 5 6 Special Feature Topics 4/22 2005 6/23 7/8 7/15 9/2 10/26 11/18 12/27 1/30 2006 4 5 6 7 8 9 10 11 12 1 2 3 2/10 4/8 9/8
19718 19973 19925 20001 20004 19984 19994 199112 ST 10,000 20,000 89 19988 200011 TPS PARK 24 ACHIEVEMENTS
 PARK 24 REPORT 2006 20051112006430 04 07 11 12 21 19718 19973 19925 20001 20004 19984 19994 199112 ST 10,000 20,000 89 19988 200011 TPS PARK 24 ACHIEVEMENTS SPC 20063 20064 200012 20019 40,000 60,000 20033
2
 1 2 3 4 5 6 7 8 9 10 , 11 12 13 14 15 16 17 18 19 20 21 22 23 24 25 26 27 28 29 30 31 32 33 34 35 36 37 38 39 40 41 42 43 44 45 46 47 48 49 50 51 52 53 54 55 56 57 58 59 60 61 62 1 63 64 65 66 67 68 2002
F&A 個人向け pdf用
 株主 通信 第58期 28年2月期 中間期 Advance to the Future CONTENTS IR 1 2 4 8 1 12 14 15 16 17 18 19 2 21 At a Glance F&A269SPA 3 245417227 F&AFDCPFASTYA AQUA FFutureAAdvance FutureAdvance 1,742 1,696 26,191 25, 24,575
maiji2007_cover_j_0907
 27 CORPORATE PHILOSOPHY THE MEIJI DAIRIES GROUP CONTRIBUTES TO A HEALTHY AND HAPPY DAILY LIFE FOR OUR CUSTOMERS BY OFFERING NEW LEVELS OF VALUE IN FOOD. CONTENTS 2 4 6 1 1 11 12 13 14 16 18 19 2 22 23
cover.ai
 Contents 2 3 4 5 6 To Our Shareholders Review Our Value & Core Competency Strategy What s Next To Our Shareholders 9 10 Business Frontier Data Section 12 14 15 16 17 17 Contents amanaamanagroup Our value
untitled
 18 9 1 5606 1 TEL 0537-36-3112 C 1. 1 172,032,512 2 1 206 3 35,438,697,472 4 1 103 17,719,348,736 5 1 103 17,719,348,736 6 18 11 17 19 1 16 7 18 11 17 19 1 16 8 9 C 1 RHJ 42,671,723 2 56,895,631 3 7,281,553
 Sony Financial Holdings 1 2 Sony Financial Holdings 3 Sony Financial Holdings N 4 Sony Financial Holdings N N 5 Sony Financial Holdings N N Life Insurance Bank Non-life Insurance 6 Sony Financial Holdings
 100 3 100 Contents 2 4 6 8 12 UA 16 3 17 18 EC 20 22 24 26 30 32 38 5 44 11 46 2017 2017 IIRC 4 13 31 2017 3 IR www.united-arrows.co.jp/ir/lib/index.html P38 5 2 3 1 2 3 VISION VOICE VISUAL 1989 1995 2001
PowerPoint プレゼンテーション
 1 2 20083 3 4 5 6 7 8 2008 10-12 2008 10-12 2007 10-12 669 749 700 7.0 % 70 116 99 16.5 % 599 633 600 5.4 % 331 331 312 6.0 % 328 328 308 6.5 % 191 191 171 11.4 % EPS 322 322 283 13.6 % 5,928 5,928 6,048-2.0
A Message From President 2
 A Message From President 2 Top Information 3 Top Information 4 A View Point 5 Annual Report 2 Financial Highlight 7, 5, 12, 6, 5, 4, 3, 2, 1, 4, 3, 2, 1, 1, 8, 6, 4, 2, 6 5, 2, 8 4, 1,5 6 3, 2, 1, 1, 5
2015年年次報告書
 Aflac Incorporated Year in Review 2015 1 To provide customers with the best value in voluntary insurance products in Japan and the United States................................ 4.................... 6....................
01
 01 02 Message from President 03 Key Indicators 04 Topics 05 06 Topics 07 WFP 08 Consolidated Financial Statements 09 ( ) ( ) ( ) 10 Non-Consolidated Financial Statements 11 12 Stock Information 13 14 Corporate
商学 59‐5・6/1.岡部
 283 revenue management 1990 IT premature revenue recognition opportunism 1 earnings-process Generally Accepted Accounting Principles : GAAP unearned income unrealized income GAAP fictitious revenue recognition
PowerPoint プレゼンテーション
 200831012 200810-12 200810-12 200710-12 669 749 700 7.0 % 70 116 99 16.5 % 599 633 600 5.4 % 331 331 312 6.0 % 328 328 308 6.5 % 191 191 171 11.4 % EPS 322 322 283 13.6 % 5,928 5,928 6,048-2.0 % EPS
 http://www.softbank.co.jp/ The No.1 Name in Broadband ANNUAL REPORT 2003 Contents 2 4 The Reason why SOFTBANK is No.1 in the Broadband Market 12 13 54 55 21 1876 1941 1970 IT20 ADSL Yahoo! BB No.1 2003


95 SMBC
 94 CEO CIO S ( CEO ) 2002 6 26 95 SMBC 2002 6 26 2002 6 26 96 2002 7 1 97 2002 7 1 98 2002 7 1 100-8155 6 4 03 3243-2626 100-0011 2 2 03 3508-8111 102-0073 2 3 03 3221-9811 104-0028 8 1 03 3243-3811 104-0061
2010年愛知教育大学年次報告書
 Annual Report Aichi University of Education 875 (3)1764 (5)2357 (8)4121 4.71 (2)1332 (4)1602 (6)2934 3.35 462 (2)578 (2)1040 439 (2)548 (2)987 643 1239 (1)1443 (1)2682 4.17 950 (1)1024 (1)1974

To Our Shareholders C O N T E N T S
 To Our Shareholders C O N T E N T S 01 02 03 03 04 04 04 04 04 05 06 07 08 09 10 10 10 11 12 14 01 Financial Highlight 02 Review of Operations 03 Review of Operations 04 05 Review of Operations 06 07 Review


, ,377 5,378 4,916 21,000 21, , ,447 1,596,376 1,744,103 9,346 8,471 52,372 51,685 1,709 1,
 2018 2019 3 31 287,752 344,377 5,378 4,916 21,000 21,937 672,244 694,447 1,596,376 1,744,103 9,346 8,471 52,372 51,685 1,709 1,633 658 628 0 1,051 1,004 5,652 6,903 5,637 6,888 14 14 138 1,305 806 903
環境報告書2015.indd
 ENVIRONMENTAL and SOCIAL REPORT 2015 1 C O N T E N T S 1. 2. 3. 4. 5. 6. 7. 8. 9. 10. 11. 12. 13. 1 2 4 5 6 7 8 14 18 20 22 24 25 28 29 2 1 37.1 62.9 2 3 1 4 2 5 6 3 1 4 1 2 7 8 8 5 1 9 2 10 10 2 11 2
...j.N.. AR2005(.O..)
") 1984 expansion 1998 world 2001 2005 transformation FAST RETAILING CO., LTD. our group UNIQLO COMPTOIR DES COTONNIERS FOOT PARK ASPESI national standard Theory business model products Do you know?
1984 expansion 1998 world 2001 2005 transformation FAST RETAILING CO., LTD. our group UNIQLO COMPTOIR DES COTONNIERS FOOT PARK ASPESI national standard Theory business model products Do you know?
 138 2 4 121 3 31 1 2 8 1 12 1. 2. 3. 4. 5. 6. 14 16 18 22 24 26 1. 2. 3. 4. 5. 28 Sumitomo Trust and Banking 138 1 Q 21 2 2,5 2, 1,5 1, 1,611 1,962 2,154 2,168 2,411 1,2 1, 8 6 4 968 1, 1,38 823 5 2 79
To Our Shareholders 25, 2,, 1, 5, 2,91 1,57,124 7,2 17,395 18,52 8,14 9,323 1,183 3, 2, 1, ,1 1, ,77 1, ,2
 Sensor open the way to the future To Our Shareholders 25, 2,, 1, 5, 2,91 1,57,124 7,2 17,395 18,52 8,14 9,323 1,183 3, 2, 1, 12.7 2,1 1,384 4.1 2 94 9.8 9.1 1,77 1,75 75 931 5. 5. 1,2 4.8 1,4 981 1,33
QX/..../IG/P1.`19/F
 President s Message (https://www.aozoraclub.com/ http://www.aozorabank.co.jp/ http://www.aozora-invest.co.jp/ (http://www.svb.com/) http://www.net-daibiki.com/ ... 34... 35...
P.7 56
 Financial Section http://www.santen.co.jp/ja/ir/document/securities.jsp 55 P.7 56 57 57 58 59 60 60 61 2006 2007 2008 2009 98,398 100,486 103,394 101,619 34,535 35,484 36,513 35,947 28,897 30,926 33,569

2014度事業報告書p000_018.indd
 2014 Junior Chamber International Japan Annual Report 2014 Junior Chamber International Japan 2014 Junior Chamber International Japan Annual Report 2014 Junior Chamber International Japan Annual Report
M&A / & 18 &
 2005 1 23 2 24 6 26 8 9 10 M&A / 14 16 & 18 & 20 22 32 33 34 51 52 53 2000 10 3 2005 1 2010 1,000 2000 10 2001 8 M 2005 34 2010 1,000 45,000 37,005 40,091 30,000 22,654 15,000 14,346 0 1,351 2000 2001
 18725 136 2008 3 4 6 8 10 16 18 24 40 41 6 42 43 54 59 75 76 77 CSR 30 34 38 200620072008 3 4.27,235 26.9635 1.68.8 ROE2.69.2 1234.0 1 2006 2007 2008 2008/2007 2008 670,957 694,594 723,485 +4.2% $7,220,409
プリント
 B U S I N E S S R E P O R T 2 1 1. 1 / 1-2 1 1. 1 2 / 3 1 3659 211 12 14 1 No.1 Globalization+ Creativity Top Message 21 1 12 Globalization + Creativity No.1 Top Message 211 121 5 2 Business Strategy3
1
 1 2 INDEX 3 4 5 6 7 8 60100150200 2 300 60 16 113 134 155 123 100 28 174 215 600 183 150 214 40 200 183 183 60 100 40 150 3 4 5 60 100 150 200 25 1150120 1150120 1150120 2640 1250120 1250120 1250120 200
 Contents 2 8 18 22 24 26 28 30 32 34 36 38 39 40 41 42 48 54 55 75 2 3 4 5 6 7 8 ACT2003 11 12 10 9 8 0 50 70 60 9 10 0 6,000 3,000 9,000 12,000 15,000 11 12 10 9 0 20,000 10,000 30,000 40,000 50,000 11
野村証券グループレポート2001 (PDF)
") 2 5 6 8 9 10 20 22 24 26 28 30 33 1 2 3 4 6 8 Nomura Group 5 6 7 8 10 10 14 20 22 Our Business 24 9 10 0 5 10 15 20 25 30 '00.3 '01.3 95.3 90.3 85.3 0 7,000 14,000 21,000 28,000 35,000 42,000 0 100 200
2 5 6 8 9 10 20 22 24 26 28 30 33 1 2 3 4 6 8 Nomura Group 5 6 7 8 10 10 14 20 22 Our Business 24 9 10 0 5 10 15 20 25 30 '00.3 '01.3 95.3 90.3 85.3 0 7,000 14,000 21,000 28,000 35,000 42,000 0 100 200
,411,54 1,357,653 1,228,353 1,392,581 1,487,827 1,489,658 1,368,792 15,896,228 1,314,482 1,289,845 1,282,6 1,384,992 1,4
 11 ANA1 3 311 216 215 214 213 3 1,791,187 1,713,457 1,61,13 1,483,581 1,654,724 1,621,916 1,535,27 1,379,754 136,463 91,541 65,986 13,827 131,64 77,983 36,391 7,876 78,169 39,239 18,886 43,14 263,878 26,879
Vision and Strategy IP 1 Fields: An Evolving History 5 9 11 Performance 17 18 At a Glance 20123 18 19 19 22 25 Sustainability CSR 27 32 Financial Sect
 We Make It Happen 2012 2011412012 331 Vision and Strategy IP 1 Fields: An Evolving History 5 9 11 Performance 17 18 At a Glance 20123 18 19 19 22 25 Sustainability CSR 27 32 Financial Section 39 49 51
あいおい損保の現状2001
 2 0 0 1 2001 13 8 150-8488 1-28-1 C 03 5424-0101 150-8488 1-28-1 TEL 03 5424-0101 http://www.ioi-sonpo.co.jp (0108) (29-492) 1 2 3 4 5 6 7 9 8 11 10 7 9 19 24 34 43 5 0 / 58 24 8 1231 98 1220 13130 37