IT
|
|
|
- こうだい ありの
- 7 years ago
- Views:
Transcription
1
2 IT
3 Sony Bank Disclosure MONEYKit PostPet PostPet So-net

4 President s Mes 2013 Sony Bank Disclosure , ,603 1, % CNH 312 FX
5 s age 2013 Sony Bank Disclosure HDI Japan
6 Corporate Out l 2013 Sony Bank Disclosure 4 IT IT
7 ine 2013 Sony Bank Disclosure 5
8 Main Products Sony Bank Disclosure MMF 7 12 NZ % CNH FX 12 NZ NZ 1211


9 Sony Bank Disclosure & Services 2013 JR :00 20:00 9:00 17:30 3 No No No


10 2013 Sony Bank Disclosure 8 MONEYKit MONEYKit MONEYKit MONEYKit-PostPet ATM ATM MONEYKitMONEYKit-PostPet
11 PostPet 5 Android iphone 2013 Sony Bank Disclosure 9


12 2013 Sony Bank Disclosure MMF REIT


13 MONEYKit MONEYKit-PostPet ATM ATM ATM ATM BNKBNK UFJATM ATM ATM ATMATMATM ATMATM HDI Japan Sony Bank Disclosure

14 Environmental 2013 Sony Bank Disclosure 12
 2012127kWhCO2")
15 1 KWh CO2 3 JVER JVER CO2 WWF Indonesia ISOISO14001 ISOISO CO2() kWhCO JVER 3 CO CO Sony Bank Disclosure 13 Initiatives 4
16 Sony Bank Disclosure Business Over CNH FX FX CNH FX REIT LIXIL FX20133
17 2013 Sony Bank Disclosure , ,079 19, view %
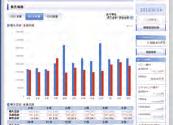
18 Sony Bank Disclosure 40 9, , , ,024 1,346 9, ,491 1,1068, , ,000 10,000 9,000 9,000 8,000 8,000 7,000 7,000 6,000 6,000 5,000 5,000 4,000 4,000 3,000 3,000 2,000 2,000 1,000 1, ,683 5,551 6,560 7,496 8,603 AAA 5,726 5,582 5,308 3,783 3, ,098 AA 902 1,525 2,120 2,937 3,254 4,770 5,866 7,224 8,355 9,702 A 1,343 1,397 1,664 1,973 2,356 BBB ,231 8,801 9,401 9,129 9, ,079 4,492 1,945 1, ,842 2,019 3,849 4,491 3,764 4, ,929 8,984 > <26> <97>
19 1,09519, , , , ,000 18,000 16,000 14,000 12,000 10,000 8,000 6,000 4,000 2, % Sony Bank Disclosure 17 2,821 3,250 3,592 3,717 3, ,442 11,849 12,898 13,905 14,672 Tier ,263 15,100 16,491 17,622 18,574
20 Ensuring Fair B 2013 Sony Bank Disclosure ALM
21 usiness Practices 2013 Sony Bank Disclosure 19
22 Sony Bank Disclosure ADR
23 :00 20: :00 17: :00 17: Sony Bank Disclosure 21
24 2013 Sony Bank Disclosure 22 9
25 2013 Sony Bank Disclosure 23 Value at Risk a b c a b
26 2013 Sony Bank Disclosure 24
27 1 2 SA Reinsurance Ltd BS7799-Part2 8ISMS BS Part2 ISO 20065ISMSJIS 20064ISO/IEC JIS Q Sony Bank Disclosure 25
28 Sony Bank Disclosure
29 Sony Bank Incorporated , % A S&P A1 JCR AA SmartLink Network, Incorporated , Sony Bank Disclosure 27 Corporate Data 20 URLhttp://sonybank.net/disclosure/e_publicnotice/index.html
30 2013 Sony Bank Disclosure Life Planning SQUARE % 57% 50% 50% 100% 100% SA Reinsurance
31 IT Web Sony Bank Disclosure 29
32 2013 Sony Bank Disclosure Web IT
33 2013 Sony Bank Disclosure


34 Sony Bank Disclosure MONEYKit ATM 9 S&P 12 MONEYKit-PostPet UFJATM UFJ UFJ ATM ISO/IEC ATM ATM 3 5 BS7799 -Part2 6 8 ISMS 5 6


35 ISOISO JCR ATM 2 11 ATM JVER 2013 Sony Bank Disclosure 33
36 2013 Sony Bank Disclosure
37 Financial Section 2013 Sony Bank Disclosure
38 36Consolidated Fi 2013 Sony Bank Disclosure ,567 62,322 1,761,136 1,857,447 10,000 10,000 10,000 10,000 14,760 18,182 12,000 22, , , , ,226 50,134 52,338 8,936 7, ,427 32, ,071 1, ,034 4,587 1,000 4,601 4,325 1,835,550 1,943, ,000 31,000 2, ,000 21,000 1,000 9,212 12,489 1,634 1,641 61,212 64,489 1,767 6,536 2,597 3, ,304 1,260 1,339 61,642 69,134 1,897,192 2,012,627 1,897,192 2,012,627
39 Data ,553 34,328 24,871 25,954 13,270 13,877 11,540 12, ,885 5,444 2,740 2, ,589 29,874 8,825 7,886 6,879 6, ,789 1,356 2,437 2, ,534 16,054 16, ,964 4, ,606 4,086 2, , ,761 3, ,747 3, ,761 3, ,135 1,340 4, ,246 7,492 2,232 7, Sony Bank Disclosure 37 nancial
40 Sony Bank Disclosure ,000 31,000 31,000 31,000 21,000 21,000 21,000 21,000 7,464 9,212 1,747 3,277 1,747 3,277 9,212 12,489 59,464 61,212 1,747 3,277 1,747 3,277 61,212 64, ,767 1,340 4,768 1,340 4,768 1,767 6,536 1,742 2, ,597 3,231 1, , , ,304 1,260 1, , ,260 1,339 58,148 61,642 1,747 3,277 1,745 4,214 3,493 7,492 61,642 69,134
41 ,606 4,086 1,681 1, ,871 25,954 8,825 7,886 3,952 2, ,981 36, , , ,212 96, ,302 29,560 9,137 8,349 6,346 2,620 12,331 64,783 2,183 2,073 10,147 66, , ,518 74,079 82, , , , ,473 1,310 2, ,618 35,876 10,000 10, , ,535 3, ,301 27,244 47,265 89,567 89,567 62,322 Sony Bank Disclosure
42 Sony Bank Disclosure
43 , , , , ,000 67, , ,892 8 Sony Bank Disclosure
44 Sony Bank Disclosure 2, , , : : 7, ,110 2,341 4,768 2,778 1, , : 62,322 62, : 3,914 1, ,
45 2013 Sony Bank Disclosure ALM 2 ALM 3 (3 i ALM ALM VaR ALM ii iii i
46 Sony Bank Disclosure (1) 8,371 8, , ,425 (2) 970,226 *1 1, ,803 1,059,289 90,485 1,875,600 1,966,681 91,081 (1) 1,857,447 1,859,093 1,646 1,857,447 1,859,093 1,646 (*2) 1 1 (12,675) (12,675) (12,674) (12,674) *1 *2
47 1 2 LIBOR 1 LIBOR 2. () , , ,892 39, ,776 20,419 8, , , ,892 39, ,776 20,000 16,678 44,416 34,311 17,566 36, ,807 6,300 1,595 4,230 7,922 25, ,807 10,377 42,820 30,080 9,643 10, , , ,204 57, , , () ,779,271 34,883 6,197 10,982 26,113 1,779,271 34,883 6,197 10,982 26,113 (*) ,952 8, ,371 8, ,371 8, Sony Bank Disclosure
48 Sony Bank Disclosure , ,108 8, , ,193 4,057 61,251 59,359 1, , ,555 2, , ,098 7, , ,812 6,900 3,075 2, , ,206 16,193 55,670 56, ,796 50, ,873 5, ,354 94,011 1,657 88,352 88, ,001 5,045 1, , ,191 2, , ,398 14, , , , , , ,740 17, , ,28637
49 ,378 30,520 29,559 32,553 34, ,429 2,908 3,964 4, ,196 1,127 1,582 1,747 3, ,246 7, ,432 57,638 58,148 61,642 69, ,411,029 1,611,506 1,760,070 1,897,192 2,012, ,369 1, ,068 2,220 3,613 3, Sony Bank Disclosure
50 48Non-Consolidat 2013 Sony Bank Disclosure ,053 61,936 1,762,282 1,857, , ,611 87,024 61,905 1,056,957 1,082,392 10,000 10, , ,444 13,240 18,182 10,000 10, , ,847 12,000 22, , ,000 12,000 22,000 29,149 61, , , ,050 2, , ,142 41,300 46, , , , ,371 1, ,716 6,854 4,565 4,224 8,936 7, ,936 7,954 14,090 16,975 18,132 26,062 20,467 24, ,209 4, ,458 11, ,610 5, ,709 4, , ,827,706 1,937,270 2,624 2,674 2,621 2,671 31,000 31, ,000 21,000 1,840 21,000 21,000 1,000 11,627 12,506 1,634 1,641 11,627 12,506 11,627 12,506 63,627 64,506 1,767 6,536 2,597 3, ,304 62,796 67,811 1,890,503 2,005,081 1,890,503 2,005,081
51 ,075 31,351 24,859 25,948 13,260 13,871 11,540 12, ,384 2, ,207 2,316 2,740 2,815 1,764 1, ,042 27,068 8,777 7,850 6,880 6, ,784 1,355 2,188 2, ,109 2, , , ,808 13, ,033 4, ,791 2, ,132 1,491 1, Sony Bank Disclosure 49 1, , ed Financial Data
52 Sony Bank Disclosure ,000 31,000 31,000 31,000 21,000 21,000 21,000 21,000 21,000 21,000 21,000 21,000 9,287 11,627 2, , ,627 12,506 9,287 11,627 2, , ,627 12,506 61,287 63,627 2, , ,627 64,506
53 ,767 1,340 4,768 1,340 4,768 1,767 6,536 1,742 2, ,597 3,231 1, , , ,304 59,971 62,796 2, ,135 2,825 5,014 62,796 67,811 Sony Bank Disclosure
54 Sony Bank Disclosure
55 , , , , , ,000 67, , , , , , Sony Bank Disclosure
56 Sony Bank Disclosure ,952 8, ,371 8, ,371 8, , , ,108 8, , ,193 4,057 61,251 59,359 1, , ,555 2, , ,098 7, , ,812 6,900 3,075 2, , ,206 16,193 55,670 56, ,796 50, ,873 5, ,354 94,011 1,657 88,352 88, ,001 5,045 1, , ,191 2, , ,398 14, , , , , ,
57 ,740 17, , , ,998 3, , , , Sony Bank Disclosure
58 Sony Bank Disclosure ,361 30,500 29,521 30,075 31, ,930 3,377 4,033 4, ,646 2,054 2, ,000 31,000 31,000 31,000 31, , , , , , ,264 58,989 59,971 62,796 67, ,411,956 1,612,186 1,761,830 1,890,503 2,005, ,326,360 1,510,051 1,649,106 1,762,282 1,857, , , , , , , , , , , ,298 4,834 16,132 11,894 6,254 18,149 (174) (63) 16,809 8,223 24,859 17,049 8,962 25,948 (174) (63) 5,511 3,389 8,726 5,155 2,707 7, , ,384 2, ,465 2, ,188 2, , ,081 2,041 1,511 1, ,110 2, ,670 2, , ,534 10,853 7,516 18,369 10,397 8,154 18, % 1.78% 1.04% 0.69% 1.86% 0.97%
59 () () () () 1,406,057 16, % 1,491,347 17, % 773,212 13, % 893,524 13, % 571,418 3, % 529,695 3, % 10, % 10, % 51, % 58, % % % (65,919) (174) (25,696) (63) 1,381,701 5, % 1,475,200 5, % 1,312,226 3, % 1,440,120 3, % 10, % 10, % 6, % 13, % , , , , (65,919) (174) (25,696) (63) 421,056 8, % 436,698 8, % 1, % 2, % 346,775 8, % 400,021 8, % % % % % % % () () () () 364,656 3, % 373,405 2, % 364,625 3, % 373,576 2, % % % % % Sony Bank Disclosure
60 Sony Bank Disclosure ,761,194 24, % 1,902,349 25, % 774,667 13, % 895,694 13, % 918,194 11, % 929,716 12, % 10, % 10, % 51, % 58, % % % 1,680,439 8, % 1,822,910 7, % 1,676,852 6, % 1,813,697 6, % 10, % 10, % 6, % 13, % 20113, , , , % 1.95% 1.41% 1.14% 2.05% 1.36% 0.39% 0.92% 0.51% 0.34% 0.72% 0.42% 0.79% 1.02% 0.89% 0.79% 1.32% 0.93% , ,612 1, ,058 1, ,293 1, ,953 1, , , ,358 1,
61 , ,206 1, ,089 2,623 1, ,071 1, ,346 1, , ,076 1, , ,690 2, ,342 1,274 1,198 1,149 1,861 2, ,079 1, , ,808 13, % 0.22% 6.57% 6.55% 0.13% 0.04% 3.81% 1.34% Sony Bank Disclosure
62 Sony Bank Disclosure , , , , , , , ,240 1,188,709 1,091, ,151 1,297, ,312, ,625 1,676,852 1,440, ,576 1,813, , , , , , ,477 1,056, ,063 1,272,020 1,082, ,565 1,283, ,388, ,691 1,762,282 1,465, ,431 1,857, , , , , , , , , , , , , , ,531 32,531 36,578 36, ,421 11,421 14,532 14, ,834 48,834 52,520 52,520 1,221,944 1,221,944 1,227,785 1,227,785
63 ,409 1, , ,591 2, ,761 7, ,803 6, , ,212 1, , ,524 2, , ,293 1, , ,488 2, ,371 6, ,716 6, , ,008 1, , ,342 2, , ,140 15, ,618 16, ,108 26,173 27,281 1,151 43,265 44, ,237 36,261 38,498 3,947 30,363 34, ,858 8,952 12,810 5,032 12,533 17, ,846 11,149 23,995 17,860 18,586 36, , , , , , , , , , , , , , , , ,258 27,224 41, , , , ,226 Sony Bank Disclosure
64 Sony Bank Disclosure ,000 1, ,000 1,000 1, , ,896 81, , , , , % 866, % 78, % 103, % 24, % 37, % % 1, % 1, % 1, % 1, % 1, % 6, % 10, % 13, % 13, % 6, % 8, % 18, % 22, % 2, % 2, % 2, % 3, % 835, % 970, %
65 A) 835, ,226 B) 759, ,865 B)/(A) 90.83% 89.55% % 0.42% 47.41% 66.02% 0.73% 52.23% 58.92% 0.39% 46.19% 62.04% 0.58% 49.38% ,369 1, ,068 2,220 3,613 3, ,634 1, Sony Bank Disclosure
66 Sony Bank Disclosure ,034 21,739 35,857 12,926 76,310 23, ,000 1,511 3,826 2,554 53,359 61,251 40,153 87,989 10,991 10,306 52, ,401 2,050 2,050 96, , ,996 17,684 13,457 7, ,142 96, , ,996 17,684 13, ,065 7,076 7, , , ,672 43, ,669 23,550 9, , ,466 32,336 18,197 29,341 68,246 31, ,964 1, ,854 23,383 29, ,259 99,438 32,429 8,351 20, ,790 7,050 7,050 75, ,015 99,709 22,766 4,568 8, ,977 75, ,015 99,709 22,766 4, ,452 8,525 8, , , ,190 60, ,013 31,871 15, ,933
67 , , , ,606 22,086 22,086 51,769 51, , , , ,032 6,540 6,540 3,722 3,722 9, , ,074 8, , , , , , ,021 9,299 9,299 8,564 8, , , , , , , , , , ,000 29,149 29,149 61,251 61, , , , ,401 7,050 7,050 2,050 2,050 8, , ,977 7, , , , , , ,065 8,525 8,525 7,076 7, , , , , , , % % 51.80% 31.86% % 48.92% 43.54% 95.10% 54.75% 36.78% % 51.26% 100 Sony Bank Disclosure
68 Sony Bank Disclosure ,952 8, ,371 8, ,371 8, ,443 13, ,939 13, ,939 13, , ,108 8, , ,193 4,057 61,251 59,359 1, , ,555 2, , ,098 7, , ,812 6,900 3,075 2, , ,206 16,193 55,670 56, ,796 50, ,873 5, ,354 94,011 1,657 88,352 88, ,001 5,045 1, , ,191 2, , ,398 14,026
69 421, ,478 4, , ,659 2,463 23,739 23, , ,395 1, , ,609 5, , ,323 5,200 2,541 2, , ,088 9,626 86,316 87,388 1,072 58,397 59, ,410 5, ,507 22, , ,575 2, , ,530 1,602 5,983 7,045 1, , ,964 3, , ,053 5, ,050 7, ,740 17, Sony Bank Disclosure ,240 13,240
70 Sony Bank Disclosure , ,195 74,491 2, , ,030 19,225 22, ,000 20, , ,989 4, , ,921 13,472 17,
71 , , , , , , ,300 3,500 9,361 9, , , ,638 1,268 1,268 9, , ,441 1, ,740 34,800 1,798 1, Sony Bank Disclosure
72 Sony Bank Disclosure , ,094 2,073 2, , , , ,036
73 2013 Sony Bank Disclosure
74 72 Capital Adequa 2013 Sony Bank Disclosure Tier1Tier Tier1 620 Tier2 2,000 10,000 10,
75 cy 2013 Sony Bank Disclosure Tier
76 2013 Sony Bank Disclosure R&IJCR MoodysS&P Fitch ISDA 6. Value at Risk
77 Sony Bank Disclosure 75
78 Sony Bank Disclosure BPVValue at Risk ALM. GPS 55 50% %1%
79 ,000 31,000 21,000 21,000 9,212 12,489 1,260 1, A 62,134 65, ,000 22,000 12,000 22,000 B 12,835 22,834 C ABCD 74,970 88, /O247 E DEF 74,970 88, , ,568 6,254 5, ,703 35,913 G 664, ,880 F/G Tier1A/G Sony Bank Disclosure 77
80 Sony Bank Disclosure ,538 25, ,568 27,902 23, , ,258 2,170 49,080 1, ,889 6, ,840 7, ,566 7, ,924 9, ,909 6, ,399 7, , , ix 6, , ,793 25, ,967 28, ,271 28,118 1,308 1,436 26,579 29, , ,326 2,531 3, , , , ,751 3,850 3, , , , ,718 72,338 97, , , , , , , , , , ,747 19,751 19,265 1,918,658 2,020, , , , , P.61P.64P.65
81 , ,634 1, , % 470, , % 163, , % 254, , % 496, , % 143,446 15, ,188 27, % 246, , % 90,841 36,726 64,996 39, % 1, % 1,122, ,672 1,112, , ,000 10,000 10,000 10,000 17,395 28,647 16,579 28, ,395 38, Sony Bank Disclosure 79
82 Sony Bank Disclosure ,304 9,759 6,287 5,000 9,591 14,760 5,597 10,297 3,965 4, ,970 11,645 2,621 3,114 2,621 3,
83 ,717 1,435 1,864 1, % 0.0% P Sony Bank Disclosure 81
84 Sony Bank Disclosure ,000 31,000 21,000 21,000 11,627 12,506 A 63,627 64, ,000 22,000 12,000 22,000 B 12,835 22,834 C A+B+CD 76,463 87, /O247 E DEF 76,463 87, , ,590 6,254 5,398 8% ,287 32,853 G 660, ,843 F/G Tier1A/G
85 ,548 24, ,590 27,623 23, , ,449 2,137 49,003 1, ,889 6, ,840 7, ,292 7, ,924 9, ,909 6, ,399 7, , , ix 6, , ,803 25, ,989 27, ,152 27,839 1,251 1,314 26,403 29, , ,326 2,531 3, , , , ,365 3,850 3, , , , ,718 72,338 97, , , , , , , , , , ,747 17,843 12,364 7,050 2,050 1,912,307 2,013, , , , , P.61P.64P Sony Bank Disclosure 83
86 Sony Bank Disclosure , ,634 1, , % 470, , % 163, , % 250, , % 496, , % 143,446 15, ,188 27, % 246, , % 90,841 34,819 64,996 32, % 1, % 1,118, ,400 1,112, ,
87 ,000 10,000 10,000 10,000 17,395 28,647 16,579 28, ,395 38, ,304 9,759 6,287 5,000 9,591 14,760 5,597 10,297 3,965 4, ,970 11,645 2,621 3,114 2,621 3, Sony Bank Disclosure 85
88 Sony Bank Disclosure ,050 2, ,717 1,435 1,864 1, % 0.0% P.76
89 a b c Sony Bank Disclosure 87
90 2013 Sony Bank Disclosure (3) a. b.
91 i 2013 Sony Bank Disclosure 89
92 Sony Bank Disclosure 0%200% ii iii.. 5..
93 Sony Bank Disclosure 91
94 Sony Bank Disclosure

95 91 http: //sonybank.net/ TEL
96
SFH P P P P SFH SFHSFH CSR At a Glance 042 SFH 100% 056 SFH 100% 058 SFH 100% SFH 061
 SFH P.001 039 P.040 059 P.060 211 P.212 215 SFH SFHSFH 001 3 008 010 016 1 018 CSR 021 041 At a Glance 042 SFH 100% 056 SFH 100% 058 SFH 100% SFH 061 SFH 2010 3 076 SFH 102 212 216 030 031 032 034SFH 035
ゼリア新薬工業株式会社
 C O N T E N T S TOP INTERVIEW Q A Q A Q A 10.9 22.9 66.2 ZERIA Pharmaceutical Co.,Ltd. 1 TOP INTERVIEW Q A 2 ZERIA Pharmaceutical Co.,Ltd. ZERIA Pharmaceutical Co.,Ltd. 3 Q A Q A Q A Q A R&D III II I II
untitled
 CONTENTS 002 004 006 26 008 26 011 PART 1 012 26 013 015 017 019 020 MCEV 023 027 PART 2 028 030 034 036 LiPSS 038 040 042 043 046 050 053 059 PART 3 060 ERMEnterprise Risk Management 062 063 066 069 073
AEGON Sony Life Insurance Co., Ltd.
 2017 AEGON Sony Life Insurance Co., Ltd. 2 4 5 5 2016 7 9 9 11 13 14 15 16 16 18 21 22 26 27 111 2017 7 AEGON Sony Life Insurance Co., Ltd. 1 2009 12 20 2016 EU 10 2016 5 10 20175 2 AEGON Sony Life Insurance
P. 2 P. 4 P. 5 P. 6 P. 7 P. 9 P.10 P.12 P.13 P.14 P.14 P.15 P.17 P.18 P.20 P P P P P.25 P.27 P.28 Copyright 2016 JAPAN POST BA
 201729 3 1 2016 8 12 P. 2 P. 4 P. 5 P. 6 P. 7 P. 9 P.10 P.12 P.13 P.14 P.14 P.15 P.17 P.18 P.20 P.21 10 P.22 11 P.23 12 P.24 13 P.25 P.27 P.28 Copyright 2016 JAPAN POST BANK CO., LTD. All Rights Reserved.
CONTENTS CSR
 浜松信用 金庫 1 ディスクロージャー 表紙オモテ 21 7.8 132 L5 59925 9ABFPD 矢部 はましんは おかげさまで 平成22年4月に 創立6周年を迎えました 33 431 再校刷 創立 6 周年記念ロゴデザインについて はましんのコーポレートカラーを使ったハー トの形で お客様へ感謝の気持ちを表現 中 心にはましんイメージキャラクター はまた っち を配置しています 当金庫が
UFJ
 UFJ UFJ () UFJ UFJ 2002 7 2 82 UFJ 2002 9 UFJ 2002 7 22 83 84 UFJ 1 2 3 4 1 2 16 15 14 90 6 5 2002 7 22 85 UFJ 1 2 DC 1 2 3 4 3 2 1 3 2 1 2 1 2002 7 22 UFJ 2002 7 22 CEO 188 2 7 2 UFJ UFJ p 86 p 18 1 2002
23回会社説明会資料(HP用)
") FFG Part FFG 09 09 1 20074 Core Core Bank Bank 170 50 32 12 68 IT 4050 4050 Core Core Value Value Part Part 2006 3 06/3 06/12 06/3 30.0% 4.5% 25.5% 26.2% 0.7% 47,500 6,300 41,200 42,200
FFG Part FFG 09 09 1 20074 Core Core Bank Bank 170 50 32 12 68 IT 4050 4050 Core Core Value Value Part Part 2006 3 06/3 06/12 06/3 30.0% 4.5% 25.5% 26.2% 0.7% 47,500 6,300 41,200 42,200
2 4 8 UFJ24 1 14 24 UFJ 3 CS 32 IT 34 37 ALM 57 58 243 59 66 69 9 92 94 117 UFJ 117 UFJ 153 UFJ 29 259 264 215229
 UFJ 24 2 4 8 UFJ24 1 14 24 UFJ 3 CS 32 IT 34 37 ALM 57 58 243 59 66 69 9 92 94 117 UFJ 117 UFJ 153 UFJ 29 259 264 215229 24UFJ 247 UFJ UFJ UFJ UFJ UFJ 22 3 23 3 24 3 UFJ UFJ 13,629 13,715 11,982 1,641
P. 2 P. 4 P. 5 P. 6 P. 7 P. 8 P. 9 P P.11 P.13 P.15 P.16 P.17 P.17 P.18 P.20 P.21 P.23 P P P P P P P.30 16
 2018303 2018 5 15 P. 2 P. 4 P. 5 P. 6 P. 7 P. 8 P. 9 P.10 2018 P.11 P.13 P.15 P.16 P.17 P.17 P.18 P.20 P.21 P.23 P.24 10 P.25 11 P.27 12 P.28 13 P.29 14 P.29 15 P.30 16 P.32 1 2 20172016 Copyright 2018
Copyright 2017 JAPAN POST BANK CO., LTD. All Rights Reserved. 1
 Copyright 2017 JAPAN POST BANK CO., LTD. All Rights Reserved. 1 Copyright 2017 JAPAN POST BANK CO., LTD. All Rights Reserved. 2 60 50 40 30 20 10 0 20173 20183 Copyright 2017 JAPAN POST BANK CO., LTD.
21322* IR * 2 * 1 *1 *2 *3 IRIR *4 *5 *6 *7 *8 * 4 * 3 * 7 * 3 FATCA VBI VBI M&A M&A * 4 * 7 * 5 ALM * 9 * 8 * 8 * 6
 213 25121 6 J. J.C. M. 3 22 VBI 211 1 J.C. 21322*9 25126 IR * 2 * 1 *1 *2 *3 IRIR *4 *5 *6 *7 *8 * 4 * 3 * 7 * 3 FATCA VBI VBI M&A M&A * 4 * 7 * 5 ALM * 9 * 8 * 8 * 6 2312 3 213 6 13 5 15 4 16 2 4 5 9
エネルギー業界における競争優位の
 16 2004 7 1 1 0.1 2000330 0.3 20044 500kW 7.0 2000 2004 2005 20054 50kW 17 2PPS 70,000 60,000 60,377 50,000 40,000 30,000 20,000 10,000 35,434 32,733 19,347 16,048 12,204 6,893 6,759 6,604 0 PPS 1,640
text.dvi
 Abstract JP Morgan CreditMetrics (1) () (3) (4) 1 3 3 4 4 5 10 6 16 1 1 BIS 1 3 1 BIS 1 BIS 1 3 ALM (1) Value at Risk () (3) RAROC (Risk Ajusted Return On Capital) (4) 3 5 6 31 99% (= p ) ~x X Prf~x Xg
1 2
 ( ) ( ) ( ) 1 2 59 2 21 24 275 43 3 26 486 103 27 28 98 105 104 99 1 48 25 29 72 14 33 11-10 3 11 8 14,663 4 8 1 6.0 8 1 0.7 11-6 27 19 22 71 5 12 22 12 1,356 6 4,397 3 4 11 8 9 5 10 27 17 6 12 22 9
QX/..../IG/P1.`19/F
 President s Message (https://www.aozoraclub.com/ http://www.aozorabank.co.jp/ http://www.aozora-invest.co.jp/ (http://www.svb.com/) http://www.net-daibiki.com/ ... 34... 35...
maiji2007_cover_j_0907
 27 CORPORATE PHILOSOPHY THE MEIJI DAIRIES GROUP CONTRIBUTES TO A HEALTHY AND HAPPY DAILY LIFE FOR OUR CUSTOMERS BY OFFERING NEW LEVELS OF VALUE IN FOOD. CONTENTS 2 4 6 1 1 11 12 13 14 16 18 19 2 22 23
 23.9 26.0 20083 3 20074 200712 20093 3 20084 200812 20083 3 20074 200712 20093 3 20084 200812 5 5 SBI 2004 2005 2006 2007 2008 5 1 10 30,000 25,000 20,000 15,000 10,000 5,000 0 1Q 2Q 3Q 4Q 1Q 2Q 3Q 4Q
 SMBC Group Report 2018 CEO CEO SMBC Group Report 2018 1 SMBC 4 SMBC 6 7 ESG 10 SMBC 12 CEO 20 22 CFO 27 28 30 32 34 36 38 40 42 SMBC SMBC Group Report 2018 IIRC 2013 12 SMBC Group Report 2018 CSR 2017


- 2 -
 - 2 - - 3 - (1) (2) (3) (1) - 4 - ~ - 5 - (2) - 6 - (1) (1) - 7 - - 8 - (i) (ii) (iii) (ii) (iii) (ii) 10 - 9 - (3) - 10 - (3) - 11 - - 12 - (1) - 13 - - 14 - (2) - 15 - - 16 - (3) - 17 - - 18 - (4) -
2 1980 8 4 4 4 4 4 3 4 2 4 4 2 4 6 0 0 6 4 2 4 1 2 2 1 4 4 4 2 3 3 3 4 3 4 4 4 4 2 5 5 2 4 4 4 0 3 3 0 9 10 10 9 1 1
 1 1979 6 24 3 4 4 4 4 3 4 4 2 3 4 4 6 0 0 6 2 4 4 4 3 0 0 3 3 3 4 3 2 4 3? 4 3 4 3 4 4 4 4 3 3 4 4 4 4 2 1 1 2 15 4 4 15 0 1 2 1980 8 4 4 4 4 4 3 4 2 4 4 2 4 6 0 0 6 4 2 4 1 2 2 1 4 4 4 2 3 3 3 4 3 4 4
1 (1) (2)
 (2)") 1 2 (1) (2) (3) 3-78 - 1 (1) (2) - 79 - i) ii) iii) (3) (4) (5) (6) - 80 - (7) (8) (9) (10) 2 (1) (2) (3) (4) i) - 81 - ii) (a) (b) 3 (1) (2) - 82 - - 83 - - 84 - - 85 - - 86 - (1) (2) (3) (4) (5) (6)
1 2 (1) (2) (3) 3-78 - 1 (1) (2) - 79 - i) ii) iii) (3) (4) (5) (6) - 80 - (7) (8) (9) (10) 2 (1) (2) (3) (4) i) - 81 - ii) (a) (b) 3 (1) (2) - 82 - - 83 - - 84 - - 85 - - 86 - (1) (2) (3) (4) (5) (6)
212 1 2 ROE ROE 3 Tier I Tier I 24 2,58 1,4 49 51 6 8% 1% 5,43 1% 7% 5% III 22 2,921 1,566 1,354 1,428 683 11 426 23 24 2423 23 23 538 8.5% 12.4% 6,18
 212 22243 1 A~A- 1% 2 Tier I7% 2 Tier I5% 2 1. 22928 2. III 22 23 24 24 22 VBI* 23 24 * Venture Banking Initiative 16 212 1 2 ROE ROE 3 Tier I Tier I 24 2,58 1,4 49 51 6 8% 1% 5,43 1% 7% 5% III 22 2,921
,552,510 3,580,796 1,591,338 1,521,728 1,167,622 1,145, , ,396 4,040 7,095 2,542 3, ,687
 193 2 15 16 16 3 31 17 3 31 5,328,950 4,989,814 360,509 1,004,512 152,070 124,856 1,009,328 568,340 480,847 606,032 3,306,780 3,769,073 3,749 3,832 27,049,901 24,233,701 55,382,800 54,799,805 743,957 895,586

>>
 2006 http://www.kajima.co.jp/ http://www.kajima.co.jp/csr/index-j.html http://www.kajima.co.jp/csr/environment/index-j.html >> http://www.kajima.co.jp/tech/index-j.html http://www.kajima.co.jp/news/press/index-j.html
P P P PE JP Appendix P.55 1
 20183 2018521 1. 20183 P.2 20193 2. 20183 P.10 3. 20182020 P.37 1 2 3 4 5 6-1 6-2 6-3 PE 7 8 9 10 11 2020 12 JP Appendix P.55 1 120183 12.9%100.7% p.9 2 3 2018/3 A 2018/3 B BA BP 8 4,692 3,543 1,148 SP
A ,000 7,539 7,593
 A+ 64 1 300 16 6,000 7,539 7,593 13 3,329 178 1,168 12% 11% 35 3 26 3 761.2 6 8,947 6,044 432 7,774 CONTENTS 01 02 04 07 11 20 38 6,677 6,706 6,044 5,519 5,489 2011 2012 2013 2014 2015 866 796 522
,156,224 72,690,624 2,589,217 3,078,149 2,286,698 2,638, ,654 1,832,467 1,516,342 5,732,042 1,942,973 2,671,316 3,214,137 4,
 19 193 2118 193 2 18 19 19331 20331 4,036,856 5,017,325 1,107,078 595,802 76,551 357,075 2,276,894 1,940,170 963,916 1,153,070 3,277,885 4,123,611 2,924 7,329 20,537,500 23,517,501 58,689,322 62,144,874
,420,877 1,229, ,064 38, ,927 41,475 4,393 4,454, ,010,575 1,420,877 57,773 1,386, ,454 2,741,632 1,262,135
 1932 17 18 18331 19331 7,107,469 4,036,856 651,905 1,107,078 117,474 76,551 1,956,650 2,276,894 633,760 963,916 4,078,025 3,277,885 2,912 2,924 25,505,861 20,537,500 57,267,203 58,689,322 947,744 881,436
5 ISMS 5 4 PC PC USB PDA 2
 3 3 1 2 1 1 2 4 1 2 1 1 1 5 ISMS 5 4 PC PC USB PDA 2 16 1 16 1 4 3 PC USB 4 5 1 6 6 506 507 507 6 5000 JIS 7 3 3 8 1 4 Web 2 15 16 9 1 OK 2 10 20 3 10 4 19 100 1 0 100 1000 1 11 3 10 50 A B C 3 4 10 50
【PDF】ディスクロージャー誌2008(一括ダウンロード)
") 4 6 8 10 1 14 16 18 4 6 8 30 31 3 41 48 49 51 5 54 Seven Bank 008 1 Seven Bank 008 Seven Bank 008 3 4 Seven Bank 008 Seven Bank 008 5 6 Seven Bank 008 Seven Bank 008 7 8 Seven Bank 008 Seven Bank 008 9
4 6 8 10 1 14 16 18 4 6 8 30 31 3 41 48 49 51 5 54 Seven Bank 008 1 Seven Bank 008 Seven Bank 008 3 4 Seven Bank 008 Seven Bank 008 5 6 Seven Bank 008 Seven Bank 008 7 8 Seven Bank 008 Seven Bank 008 9

SBI損保 ディスクロジャー 2010
 20 1 21 422 3 212.5%27 4 SBI IT SBI 1 1 3 1 38 2 4 3 4 4 5 5 6 6 6 7 7 2 5 3 1. 2. 3. 4. 5. 39 40 43 45 49 51 1 9 2 10 3 11 4 23 5 23 2 1 1. 2. 3. 4. 5. 52 55 57 58 59 6 24 7 24 8 25 2 60 3 60 4 60 5 61
 13,825,228 3,707,995 26.8 4.9 25 3 8 9 1 50,000 0.29 1.59 70,000 0.29 1.74 12,500 0.39 1.69 12,500 0.55 10,000 20,000 0.13 1.58 30,000 0.00 1.26 5,000 0.13 1.58 25,000 40,000 0.13 1.58 50,000 0.00 1.26
活用ガイド (ソフトウェア編)
") (Windows 98 ) ii iii iv v NEC Corporation 1999 vi P A R T 1 P A R T 2 vii P A R T 3 viii P A R T 4 ix P A R T 5 x P A R T 1 2 3 1 1 2 4 1 2 3 4 5 1 1 2 3 4 5 6 6 7 7 1 1 2 8 1 9 1 1 2 3 4 5 6 1 2 3 10
(Windows 98 ) ii iii iv v NEC Corporation 1999 vi P A R T 1 P A R T 2 vii P A R T 3 viii P A R T 4 ix P A R T 5 x P A R T 1 2 3 1 1 2 4 1 2 3 4 5 1 1 2 3 4 5 6 6 7 7 1 1 2 8 1 9 1 1 2 3 4 5 6 1 2 3 10
表紙030313.PDF
 H2 CO (1) (3) (4) () () ( ) ( : 11 ) [ ] [ ] [ ] [ ] [ ] [ ] [ ] [ ] [ ]......... [ ] [ ] [ ] [ ] [] [ ] [ ] [ ] [ ] (g) [ ] ) [ ] [ [ ] [ ] [ ] ) ) ) )... [ ] [] [ ] [] [ []........