untitled
|
|
|
- みいか かたづ
- 9 years ago
- Views:
Transcription
1 1
2 2
3 (1) (1962)
4 (2) NGO 4
5 5
6 6
7 7
8
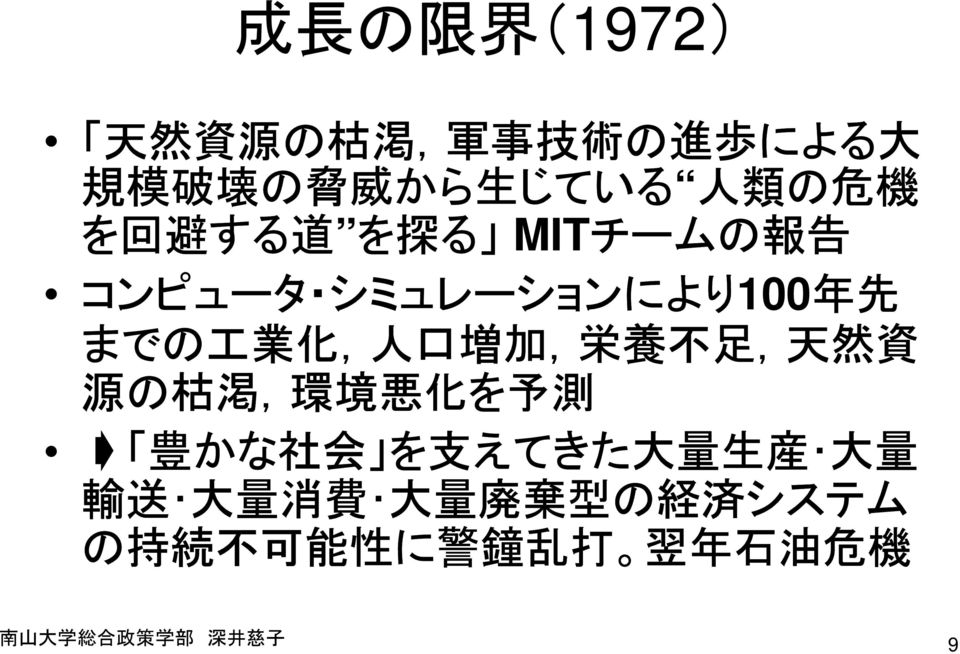
9 1972 MIT 100 9
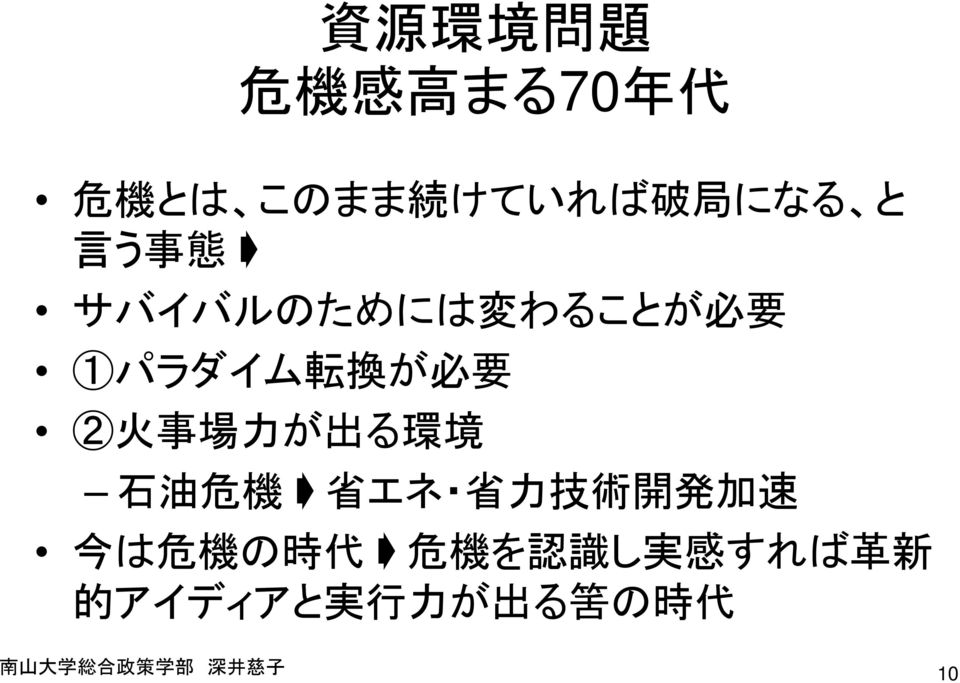
10 70 10
11 ? 11
12 1/4 3/4 3/4 1/ FAO ODA 1/10 US 1/25 1/2 88 1/7( /WHO ) 12
")
13 GDP US
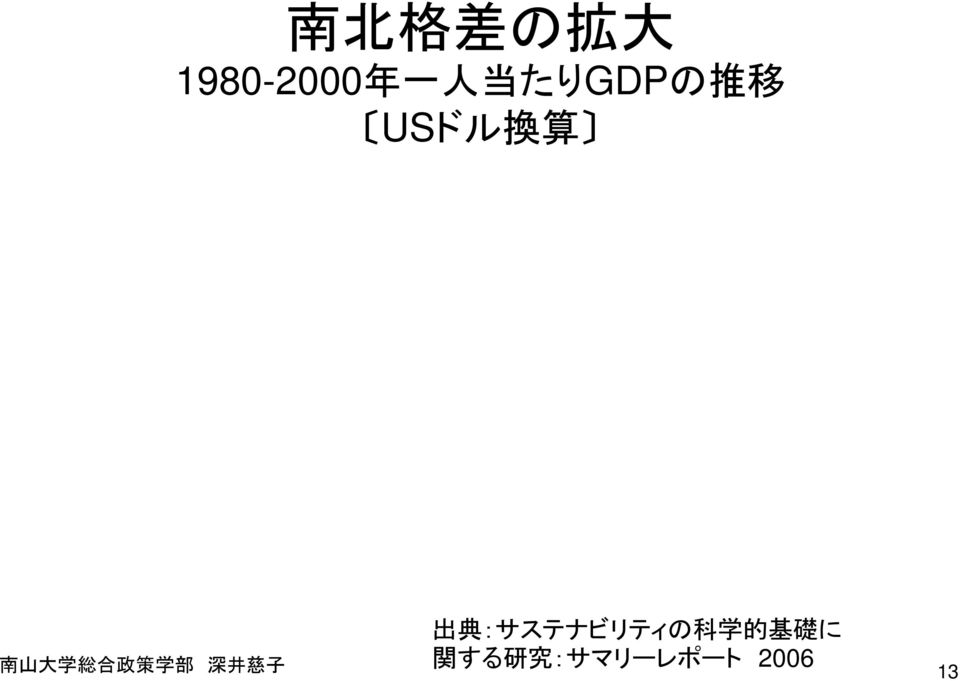
14 Note: North includes North America, Australia, New Zealand, Japan, and Western Europe Bob Sutcliffe, 'World Inequality and Globalization', Oxford Review of Economic Policy, Vol 20, No. 1, 2004, based on Angus Maddison, The World Economy: Historical Statistics, OECD, Paris, 2003 Global Policy Forum 14

15 15
16
17 17
18 IMF/ (1989 ) 18
19 ODA 19
20 20
21 ? 21
22 WMD = 22
23 23
24 24
25 25
26 NGO 26
27 WBCSD( IISD / 27
28 Brown 1) 2) 3) 28
29 WBCSD SD 1992 =, 29
30 10 WBCSD 50 1/
31 10 1/10 31
32 IISD SD enabling policies
33 33
34 10 34
35
36 36
37 1949) = 37
38 1985) 3 (ecoregion) (georegin) (vitaregion) 38
39 39
40 Enoughness= Stewardship= humility = Holism= 40
41 1/3 41
42 42
43 43
44 44
45 45
46 ( 46
47 NGO = = NGO= 47
48 = =
49 49
50 GDP
51 EF 51
52 52
53 53
54 , 54
55 55
56 WBCSD 56
ミレニアム開発目標の現状と課題
 hunger G ODA GDP GDP GDP Basic Human Needs GDP...... United Nations Educational, Scientific and Cultural Organization The World Conference on Education for All a b c d OECD Development Assistance Committee
untitled
 1 11 1. 2. 3. 4. 12 1 1 13 14 1 ...16...20...21...21...21...21...21...22...22...23...23...23...24...24...24...24...24...24...25...25...25...26...27...27...27...29...30...31...34...34...35...35...36...37...37...38...38
文明no18.indb
 No.18, 20131-16 27 1997 2000 1 60 1993 53 53 20 2000 12 4 4 4 1960 GDP 2627% 1960 50% GDP 50% 70% GDP 70% 30% 20 50% 55% 60% 4 3 2003 50% 11 111 15 1946 1969 23 46 60 15 15 1960 15 11 2 1960 4.2% 3% 5%
-February GDP GDP
 -February GDP GDP - GDP. GDP GDP / GDP DI.. DI..,,. -February (2010=100) 115 110 105 100 95 2000 2001 2002 2003 2004 2005 2006 2007 2008 2009 2010 2011 2012 2013 2014 800 350 750 700 300 650 600 250 550
 27 27 2 9 28 8 2 2 GDP GDP 5.8. GDP 86.2 22 29 5 29 2 5 2 8 2 9 9 9 8 28 8.5 28 8.9 22.6 27 PB PB5.8 GDP 86.2 5 7 6 GDP 7 2 5 7 6 GDP IMF GDP IMF World Economic Outlook Database 28 29 GDP 25.. 8. 97.8
untitled
 Trade and Trade Finance in the 200809 Financial Crisis, IMF Working Paper WP/11/16., Understanding the Great Trade Collapse of 200809 and the Subsequent Trade Recovery, Economic Perspectives, 2Q/2011.


<30335F8FAC88E490EC8E812E696E6464>
 ODA ODA ODA ODA Lodge and WilsonStiglitz MDGs DAC HIV HIV United Nations OECD DAC OECD OECD DAC DAC DAC ODA ODA ODA ODA GNP GDP ODA Chun ODA ODA OECD ODA ODA ODA ODA ODA ODA ODA a ODA OECD EDCF Economic
野村資本市場研究所|アジアの金融競争力(PDF)
") 2013 Spring 1. GDP 3 26% 2. 3. 4. GDP 1 GDP 2000 25.4% 2012 10 IMF 1 GDP 28.7%GDP 10.7% 20.3% 2000 2012 10 2 3 2000 2012 4.2 5.4 2 2000 14% 2012 26% GDP 2012 30 10 32003 11 2013 Spring 100% 2 90% 80% 70%
2013 Spring 1. GDP 3 26% 2. 3. 4. GDP 1 GDP 2000 25.4% 2012 10 IMF 1 GDP 28.7%GDP 10.7% 20.3% 2000 2012 10 2 3 2000 2012 4.2 5.4 2 2000 14% 2012 26% GDP 2012 30 10 32003 11 2013 Spring 100% 2 90% 80% 70%
和RIM28三浦氏_アジア.indd
 200711 100 1442 20 2006 WTO 20068,416 2025 1980 108 RIM 2008 Vol.8 No.28 doi moi 1990 19921993 IMF 1995ASEAN NIEs 1990 1997 NIEs 20071 10 ( RIM 2008 Vol.8 No.28 109 JBIC 1996 2005 NIEs World Bank2006 199610

 IMES DISCUSSION PAPER SERIES Discussion Paper No. 99-J-17 INSTITUTE FOR MONETARY AND ECONOMIC STUDIES BANK OF JAPAN 100-8630 203 IMES Discussion Paper Series 99-J-17 1999 6 * JEL classification E52 E58
1.3期・井上健0.doc
 Forum 21 Forum 21 Forum 21 Forum 21 Forum 21 Forum 21 Forum 21 Forum 21 Forum 21 Forum 21 Forum 21 Forum 21 Forum 21 10 14 8 6.5 2 37 3 10 30 100 21,002 12 9,401 56 2 11 5 ( ) 231011 22.8 21.016.815.715.214.314.713.310.610.8
01.12期・井須英次1.doc
 Forum 21 Forum 21 Forum 21 Forum 21 Forum 21 Forum 21 Forum 21 Forum 21 Forum 21 Forum 21 Forum 21 21 Forum 21 Forum 21 Forum 21 Forum 21 21 Forum 21 21 Forum 21 Forum 21 Forum 21 Forum 21 Forum 21 Forum


<93638CB48FBA8E6C2E696E6464>
 265 29 1 1. 1 19 5 6 4 2 ) 48 21 63 16 51 17 64 10 49 12 67 10 42 15 49 13 49 13 48 13 54.7 59.3 56.7 57.5 65.3 85.1 59.9 63.4 64.0 64.6 45.3 40.7 43.3 42.5 34.7 14.9 40.1 36.6 36.0 35.4 1854 1938 1854
5 I The Current Situation and Future Prospects of the North Korean Economy presented at the 2014 Korea Dialogue Conference on Strengthenin
 5 I. 3 1 1990 2 The Current Situation and Future Prospects of the North Korean Economy presented at the 2014 Korea Dialogue Conference on Strengthening North Pacific Cooperation organized by the East-West
ブック 1.indb
 2012 12 8 24 1 5,155 2 4 web 1 1 1. (1995~2010) 2 web 3 3 1 1 1986 2 30 3 1 4 30 342 7 3 2 GDP 4 1 43 39 9 15.3 4 3 5,000 86 2000 4 2 1989 2011 2000 web web 5 25 3 1 1 5 6 1 5 18.5 2 8 1 33.1 90 web 3
 18 (1) US (2) US US US 90 (3) 2 8 1 18 108 2 2,000 3 6,000 4 33 2 17 5 2 3 1 2 8 6 7 7 2 2,000 8 1 8 19 9 10 2 2 7 11 2 12 28 1 2 11 7 1 1 1 1 1 1 3 2 3 33 2 1 3 2 3 2 16 2 8 3 28 8 3 5 13 1 14 15 1 2
 13 2002 8 ERINA 1 2 1 1. 1956 1960 19561960 1960 1970 197174 197579 1980 1980 1990 1980 1984 1980 1986 1990 2 1 199192 1 8 2 2000 9 11 2000 3 3 1 2 3 1 21 2001 2000 10 3 1995 2000 6 2001 2000 6 11 2000
.T.C.Y._.E..
 25 No.33 C O N T E N T S REVIEW 1 2 5 4 3 6 7 8 9 1 11 1, 1, 7,5 75 916,95 (121) 756,67 (15) 718,89 (13) 91,496 (169) 54,2 (179) 3,243 (75) 727,333 (129) 564,47 (112) 55,458 (11) 6,68,953 (18) 5,624,957

冷戦後の戦略環境変化とクリントン政権
 1998 11 3558 1 21 2 1 Paul D. Wolfowitz, Clinton s First Year, Foreign Affairs, Vol. 73, No. 15 (January/February, 1994). 2 91 36 3 91 G-7 G-7 4 G-7 5 (primacy) 6 1949 1950 1962 10 71 89 11 91 12 3 James
,.,,.,. NIRA,.,.,,, GDP.,., 1%, 2.0% 3).,,.,,., 1, 4).,,.,, GDP,.,,.,,,.,,., 2002.,,., 3), Q&A Q16 (http://www.stat.go.jp/data/kakei/qa-1.ht
.,,.,,., 1, 4).,,.,, GDP,.,,.,,,.,,., 2002.,,., 3), Q&A Q16 (http://www.stat.go.jp/data/kakei/qa-1.ht") 1, 1, 2011 4 3-28,,.,,.,.,,.,,.,,.,.,. 1., 1), 1946.,, GDP,.,,,.,,., (2008) ( NIRA ), 23,.,,, 2).,,,.,,.,,., 657-8501 2-1, E-mail: [email protected] 1) 1. 2), 1990 2 21, 1993 6 12. 3 1 1 2011
1, 1, 2011 4 3-28,,.,,.,.,,.,,.,,.,.,. 1., 1), 1946.,, GDP,.,,,.,,., (2008) ( NIRA ), 23,.,,, 2).,,,.,,.,,., 657-8501 2-1, E-mail: [email protected] 1) 1. 2), 1990 2 21, 1993 6 12. 3 1 1 2011
untitled
 12 3 10 27 1 100 1/10 1/3 2012 24 27 22 23 153 8407 26 28 563 275 26 260 275 120 67 21 15 98 70 8407 7791 616 70.2 19 50 100 300 vol.195 12 10 12 22 11 23 30 0.022 22 11 23 1 9230+0.022 22 11 23 vol.194


みさき_1
 2 3 4 5 6 7 1F 2F 8 9 10 11 17 18 19 20 21 22 23 24 31 25 26 27 28 29 30 8 1 2 3 4 5 6 7 6 8 7 16 7 8 9 10 11 12 14 15 13 17 23 Vol.41 8 6 20 11 7 15 7 23 7 7 7 16 23 23 8 13 18:00 22:00 722


H21_report
 vol.4 1 2 6 10 14 18 20 22 24 25 1 2 2172 73 3 21925 926 21125 126 4 5 6 21629 630 7 21107 108 21127 128 8 9 10 21616 617 11 211026 1027 211213 1214 12 13 14 21713 714 15 2194 95 211031 111 16 17 18 19


09030549_001.図書館31-1
 vol.31 NO.1 2 3 5 6 10 12 8 1947-1954- 1950-1838-1904 1952-1996 1 913-1954 1981-1958- 1 902-1992 1972-1946- 1 940- 1 2 3 3 5 6 6 8 8 12 8 8 1 2 2 http://library.hokkai-s-u.ac.jp/cgi-bin/tosyokan/index.cgi


")


