|
|
|
- かおり がうん
- 4 years ago
- Views:
Transcription
1
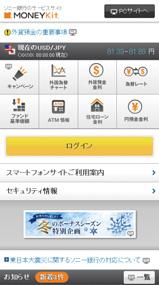
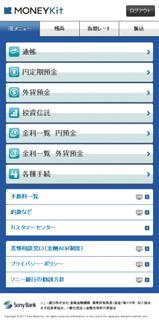
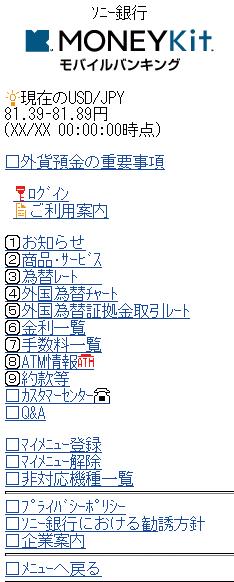
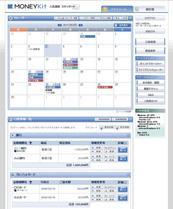
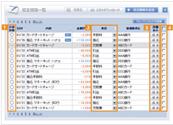
2 IT
3 Sony Bank Interim Disclosure MONEYKit PostPetPostPet So-net Entertainment Corporation
4 President s Message Sony Bank Interim Disclosure Edy REIT 7 103CNH
5 Corporat P 2012 Sony Bank Interim Disclosure 3 IT Philosophy

6 Main Products Sony Bank Interim Disclosure 2 MMF 12 NZ CNH % FX 12 NZ NZ


7 2012 Sony Bank Interim Disclosure & Services 5 JR :00 20:00 9:00 17:30 2 No DD No


8 Sony Bank Interim Disclosure MONEYKit MONEYKit MONEYKitMONEYKit-PostPet MONEYKit MONEYKit-PostPet

9 Sony Bank Interim Disclosure ATM ATM

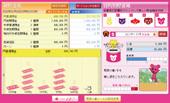
10 Sony Bank Interim Disclosure 6 PostPet AndroidiPhone


11 2012 Sony Bank Interim Disclosure 9 MONEYKit MONEYKit-PostPet ATM ATM ATM ATM BNKBNK UFJATM ATM ATM ATMATMATM ATMATM
12 Business Over Sony Bank Interim Disclosure FX 10CNH LIXIL FX REIT CNH LIXIL
13 2012 Sony Bank Interim Disclosure , , view
14 Sony Bank Interim Disclosure , , , ,000 8,000 6, , , , , ,000 8,000 6,000 4,000 2,000 4,000 2, ,813 6,560 6,978 7,496 8,029 AAA 5,707 5,308 4,417 3,783 3, AA 2,148 2,120 2,424 2,937 3,268 6,364 7,224 7,761 8,355 8,986 A 1,457 1,664 1,741 1,973 1,998 BBB ,583 9,401 8,948 9,129 9, ,079 5,149 1,945 2, ,842 2,417 3,849 3,911 3,764 3, ,929 9,060 > <26> <40>
15 2012 Sony Bank Interim Disclosure , , , , % 20, ,000 12, ,000 4, ,430 3,592 3,608 3,717 3, ,417 12,898 12,843 13,905 14,560 Tier ,848 16,491 16,452 17,622 18,193
16 Sony Bank Interim Disclosure Corporat Data Sony Bank Incorporated , % A S&P A1 JCR AA 20 URLhttp://sonybank.net/disclosure/e_publicnotice/ index.html
17 Financial Section 2012 Sony Bank Interim Disclosure
18 16Consolidated Fi 2012 Sony Bank Interim Disclosure ,579 81,820 1,644,316 1,819,396 10,000 10,000 10,000 10,000 14,261 13,605 2,000 12, , , , ,647 59,041 50,646 7,109 7, ,382 23, ,384 1, ,083 4, ,451 1, ,000 1, ,680 1,638 1,000 1,000 1,717,289 1,894,069 31,000 31,000 21,000 21,000 8,367 11,070 60,367 63, ,568 2,615 3,212 3, ,285 1,336 58,616 63,763 1,775,905 1,957,833 1,775,905 1,957,833
19 ,994 16,815 12,257 12,607 (6,537) (6,832) (5,696) (5,735) 1,973 2,789 1,725 1,359 (908) (841) ,838 14,677 4,424 4,263 (3,463) (3,370) 1,151 1, ,580 8, ,155 2, ,906 1,739 1, , , ,934 1, , , Sony Bank Interim Disclosure 2012 nancial Data 17
20 Sony Bank Interim Disclosure ,000 31,000 31,000 31,000 21,000 21,000 21,000 21,000 7,464 9, , ,858 8,367 11,070 59,464 61, , ,858 60,367 63, , ,568 1,742 2, ,615 3,212 1, , , , ,260 1, , ,285 1,336 58,148 61, , ,121 58,616 63,763
21 ,906 1, ,257 12,607 4,424 4,263 4,777 3, ,258 15, ,533 63,085 5,602 58,247 1,323 1, ,556 14,352 4,783 4,230 16,207 4,827 23,065 18,011 1,291 1,130 24,357 16, , ,364 46,776 31, , , , ,825 23, , , ,746 47,265 89,567 47,579 81,820 Sony Bank Interim Disclosure 2012
22 Sony Bank Interim Disclosure
23 , , , , , , , , , ,000 Sony Bank Interim Disclosure 2012
24 Sony Bank Interim Disclosure : 81,820 81, (1) 9,902 10, , ,070 (2) 898,647 *1 1, , ,772 84,542 1,813,204 1,898,370 85,166 (1) 1,819,396 1,820,390 1,493 1,819,396 1,820,890 1,493 (*2) 2,711 2,711 (23,166) (23,166) (20,454) (20,454) *1 * LIBOR 1 LIBOR
25 ,448 10, ,902 10, ,902 10, , ,885 5, , ,830 3,146 61,794 60, , ,220 1, , ,684 6, , ,684 6, , ,570 12,515 78,145 78, ,375 64, ,770 14, , ,140 2,300 96,594 97,808 1,213 8,244 9,331 1, , ,079 3, , ,650 9,420 Sony Bank Interim Disclosure 2012
26 Sony Bank Interim Disclosure ,240 13, , ,99770
27 ,478 15,994 16,815 29,559 32, ,466 2,155 2,138 2,908 3, , ,582 1, , , ,741 58,616 63,763 58,148 61, ,699,452 1,775,905 1,957,833 1,760,070 1,897, ,405 1, ,161 2,260 3,822 3, Sony Bank Interim Disclosure 2012
28 Sony Bank Interim DisclosureNon-Consolidat ,139 81,111 1,645,223 1,819,396 10,000 10,000 10,000 10,000 12,740 13,605 2,000 12, , , , ,647 50,651 45,827 7,109 7,695 1, ,028 17, ,717 2,608 49,480 45,655 3,296 1, ,000 1, ,680 1, ,000 1,000 1,709,735 1,889,127 31,000 31,000 21,000 21,000 21,000 21,000 10,585 11,051 10,585 11,051 10,585 11,051 62,585 63, ,568 2,615 3,212 3, ,548 62,407 1,769,284 1,951,535 1,769,284 1,951,535
29 Interim ,165 15,201 12,251 12,600 (6,531) (6,826) (5,696) (5,735) 1,138 1,175 1,725 1,359 (908) (841) ,965 13,257 4,409 4,235 (3,463) (3,370) 1,058 1, ,816 6, ,200 1,944 2,826 2, , Sony Bank Disclosure 1, ed Financial Data 27
30 Sony Bank Interim Disclosure ,000 31,000 31,000 31,000 21,000 21,000 21,000 21,000 21,000 21,000 21,000 21,000 9,287 11,627 1, , ,585 11,051 9,287 11,627 1, , ,585 11,051 61,287 63,627 1, , ,585 63,051
31 2012 Sony Bank Interim Disclosure , ,568 1,742 2, ,615 3,212 1, , , , ,971 62,796 1, , ,548 62,407
32 Sony Bank Interim Disclosure
33 2012 Sony Bank Interim Disclosure , , , , , , , ,658117, , , ,448 10, ,902 10, ,902 10, ,050
34 Sony Bank Interim Disclosure , ,885 5, , ,830 3,146 61,794 60, , ,220 1, , ,684 6, , ,684 6, , ,570 12,515 78,145 78, ,375 64, ,770 14, , ,140 2,300 96,594 97,808 1,213 8,244 9,331 1, , ,079 3, , ,650 9, ,240 13, ,775 1,013 4, ,340 1, ,561 1, ,
35 2012 Sony Bank Interim Disclosure ,465 15,165 15,201 29,521 30, ,692 2,200 1,944 3,377 4, , ,054 2, ,000 31,000 31,000 31,000 31, , , , , , ,319 59,548 62,407 59,971 62, ,700,723 1,769,284 1,951,535 1,761,830 1,890, ,584,836 1,645,223 1,819,396 1,649,106 1,762, , , , , , , , , , , ,635 2,232 7,868 5,707 2,681 8,389 (99) (56) 8,450 3,900 12,251 8,428 4,228 12,600 (99) (56) 2,814 1,667 4,382 2,721 1,546 4, ,138 1, ,175 1, ,058 1, , ,159 1, , ,173 1, ,315 1, ,629 3,741 9,371 5,131 3,844 8, % 1.77% 1.07% 0.69% 1.78% 0.95%
36 Sony Bank Interim Disclosure () () () () 1,389,217 8, % 1,480,985 8, % 745,994 6, % 862,002 6, % 596,138 1, % 543,174 1, % 10, % 10, % 37, % 65, % % % (72,257) (99) (43,799) (56) 1,363,728 2, % 1,460,075 2, % 1,292,208 1, % 1,407,416 1, % 10, % 10, % 2, % 12, % , , , , (72,257) (99) (43,799) (56) 419,679 3, % 429,486 4, % 1, % 1, % 339,116 3, % 374,440 4, % % % % % % % () () () () 366,643 1, % 366,919 1, % 366,614 1, % 366,889 1, % % % % % ,736,639 12, % 1,866,672 12, % 747,375 6, % 863,861 6, % 935,254 5, % 917,615 5, % 10, % 10, % 37, % 65, % % % 1,658,114 4, % 1,783,195 4, % 1,658,823 3, % 1,774,306 3, % 10, % 10, % 2, % 12, % 20113, , , ,
37 2012 Sony Bank Interim Disclosure % 1.85% 1.40% 1.13% 1.96% 1.34% 0.41% 0.90% 0.52% 0.37% 0.84% 0.47% 0.80% 0.94% 0.87% 0.76% 1.12% 0.87% , , ,486 1, ,263 1, , , ,489 1, ,
38 Sony Bank Interim Disclosure ,319 1, , ,816 6, % 0.20% 7.34% 6.19% 0.14% 4.33%
39 2012 Sony Bank Interim Disclosure , , , , , , , ,372 1,170,882 1,076, ,344 1,281, ,292, ,614 1,658,823 1,407, ,889 1,774, , , , , , , , ,006 1,161,773 1,124, ,274 1,326, ,282, ,587 1,645,223 1,453, ,595 1,819, , , , , , , , , , , , , , ,278 33,278 29,401 29, ,453 12,453 9,620 9, ,477 45,477 52,098 52,098 1,114,744 1,114,744 1,273,433 1,273, ,820 1, , ,231 1, ,090 8, ,175 6, , ,994 1, , ,002 1, ,861
40 Sony Bank Interim Disclosure ,449 1, , ,803 2, ,885 7, ,232 6, , ,681 1, , ,564 2, , ,028 10, ,531 20, ,293 22,981 1,099 29,975 31, ,397 41,050 43,448 2,250 29,636 31, ,555 7,800 11,356 4,315 12,160 16, ,159 8,088 19,248 14,327 16,168 30, , , , , , , , , , , , , , , , ,790 16,823 32, , , , , ,000 1,000 1,000 1,000
41 2012 Sony Bank Interim Disclosure ,000 1,000 1,000 1,000 1,000 1, , ,187 74,980 89, , , , % 809, % 70, % 88, % 19, % 29, % 1, % % 1, % 1, % 1, % 1, % 5, % 9, % 13, % 13, % 6, % 7, % 17, % 20, % 2, % 2, % 1, % 2, % 776, % 898, %
42 Sony Bank Interim Disclosure2011 A) 776, ,647 B) 707, , B)/(A) 91.22% 90.24% % 0.41% 47.17% 61.67% 0.56% 49.39% 57.73% 0.37% 45.05% 61.24% 0.50% 48.68% ,405 1, ,161 2,260 3,822 3, ,680 1,
43 2012 Sony Bank Interim Disclosure ,583 29,716 23,280 27,492 89,196 20, ,800 1,402 1,512 3,848 2,541 52,488 61,794 88, ,632 14,067 8,699 28, ,222 2,050 2,050 68, , ,880 7,809 6,347 8, ,156 68, , ,880 7,809 6, ,911 8,244 8, , , ,076 46, ,974 20,985 10, , ,957 37,417 7,568 20,678 84,882 31, ,782 3, ,149 1,713 14,053 21,723 94, ,678 67,438 7,609 8, ,336 7,050 7,050 70, ,165 98,675 21,382 6,684 8, ,960 70, ,165 98,675 21,382 6, ,741 8,219 8, , , ,831 51, ,633 31,821 15, , , , , ,798 19,631 19,631 43,141 43, , , , ,518 6,030 6,030 5,384 5,384 9, , ,417 9, , , , , , ,440 9,300 9,300 9,331 9, , , , , , ,615
44 Sony Bank Interim Disclosure 9,448 10, , , , ,800 21,723 21,723 61,794 61, , , , ,222 7,050 7,050 2,050 2,050 8, , ,960 8, , , , , , ,911 8,219 8,219 8,244 8, , , , , , , % 93.14% 54.39% 36.80% % 50.45% 46.13% 92.49% 56.38% 38.59% % 51.71% ,902 10, ,902 10, ,939 14, ,543 1, ,482 16, ,482 16,
45 2012 Sony Bank Interim Disclosure , ,885 5, , ,830 3,146 61,794 60, , ,220 1, , ,684 6, , ,684 6, , ,570 12,515 78,145 78, ,375 64, ,770 14, , ,140 2,300 96,594 97,808 1,213 8,244 9,331 1, , ,079 3, , ,650 9, , ,491 4, , ,493 2,350 21,723 21, , ,477 1, , ,334 4, , ,048 4,084 2,296 2, , ,825 8,185 93,777 95,145 1,367 68,999 70,226 1,226 24,778 24, , ,246 3, , ,200 2,592 5,923 7,045 1, , ,391 5, , ,217 3, ,050 7,050
46 Sony Bank Interim Disclosure ,240 13,240 12,740 12, , , ,914 4, , ,702 17,612 21, ,000 20, , ,022 4, , ,708 13,553 18,
47 2012 Sony Bank Interim Disclosure , , ,051 2,861 2,861 6, , ,959 2, ,120 20,700 1,266 1, , , ,419 4,625 4,625 2, , ,221 4, ,440 58,820 9,823 9,
48 Sony Bank Interim Disclosure , ,028 2,163 2, , , , ,
49 2012 Sony Bank Interim Disclosure
50 Capital Adequa Sony Bank Interim Disclosure ,000 31,000 21,000 21,000 8,367 11,070 1,285 1, A 61,274 64, /O 247 E DEF 64,121 76, , ,433 8,982 7, ,804 33,666 G 624, ,556 FG Tier1AG ,000 12,000 2,000 12,000 B 2,846 12,763 C ABCD 64,121 76,
51 Sony Bank Interim Disclosure 49 cy ,303 23, ,433 25,777 22, ,124 1,004 55,374 2,214 43,064 1, ,441 5, ,778 6, ,426 6, ,290 7, ,235 6, ,862 7, , , ix 8, , ,285 23, ,890 26, ,731 26,075 1,232 1,346 24,963 27, , ,597 1,500 2, , , , ,874 3,850 3, , , , ,015 65,117 82, , , , , , , , , , , ,470 19,078 1,813,326 1,985, , , , , P. 38P. 41P. 42
52 50 75 % 217, , Sony Bank Interim Disclosure , ,680 1, , % 445, , % 168, , % 231, , % 477, , % 130,289 12, ,526 21, % 92,602 37,195 85,491 35, % % 1,068, ,062 1,139, , ,000 10,000 10,000 10,000 13,860 22,479 13,109 22, ,860 32,479
53 ,042 7,122 5,671 7,232 6,713 3,547 2,704 3,650 4, ,353 4,397 2,878 2,315 2,878 2, Sony Bank Interim Disclosure 51
54 Sony Bank Interim Disclosure ,082 1, , % 0.0% 1. GPS
55 ,000 31,000 21,000 21,000 10,585 11,051 A 62,585 63, ,000 12,000 2,000 12,000 B 2,846 12,763 C A+B+CD 65,431 75, /O247 E DEF 65,431 75, , ,030 8,982 7, ,324 31,363 G 621, ,851 FG Tier1AG Sony Bank Interim Disclosure 53
56 Sony Bank Interim Disclosure ,129 23, ,030 25,561 22, ,124 1,004 54,380 2,175 42,923 1, ,441 5, ,778 6, ,158 6, ,290 7, ,235 6, ,862 7, , , ix 8, , ,112 23, ,487 25, ,644 25,859 1,212 1,254 24,857 27, , ,567 1,500 2, , , , ,165 3,850 3, , , , ,015 65,117 82, , , , , , , , , , , ,559 13,817 7,050 2,050 1,807,083 1,979, , , , , P. 38P. 41P. 42
57 , ,680 1, , % 445, , % 168, , % 226, , % 477, , % 130,289 12, ,526 21, % 217, , % 92,602 36,284 85,491 30, % % 1,063, ,794 1,138, , ,000 10,000 10,000 10,000 13,860 22,479 13,109 22, ,860 32, Sony Bank Interim Disclosure 55
58 Sony Bank Interim Disclosure ,042 7,122 5,671 7,232 6,713 3,547 2,704 3,650 4, ,353 4,397 2,878 2,315 2,878 2,
59 ,050 2, ,082 1, , % 0.0% GPS Sony Bank Interim Disclosure 57
60 Sony Bank Interim Disclosure

61 http: //sonybank.net/ TEL
62
IT
 IT 2013 2013 Sony Bank Disclosure 1 2 4 5 6 8 9 10 11 12 14 15 18 19 19 20 20 21 22 25 26 27 28 29 30 31 32 34 36 47 47 47 48 56 56 60 61 64 66 70 71 72 77 82 87 192 92 193 92 4 92 MONEYKit PostPet PostPet
Sony Bank 11j_Master_IKM.indd
 2011 201161110 10 2011 2011 Sony Bank Disclosure 1 2 4 5 6 7 7 8 8 10 13 14 15 16 18 20 23 24 2010420117 25 26 27 30 41 41 41 42 50 50 54 54 58 60 64 65 66 71 76 82 83 84 86 19 2 87 19 3 87 MONEYKitMONEYKit
IT
 IT 2017 2017 Sony Bank Interim Disclosure 1 2 3 4 5 6 8 15 15 15 16 22 22 25 26 29 30 34 35 36 38 45 19 2 53 19 3 53 4 53 MONEYKit PostPet PostPet Sony Network Communications Inc. President s Message 2
IT
 IT 2017 2017 Sony Bank Disclosure 1 2 4 5 6 8 8 8 9 10 10 11 12 14 14 14 15 15 16 16 19 19 20 22 22 23 24 26 26 28 37 37 37 38 44 44 47 48 50 52 56 57 58 60 65 74 82 19 2 84 19 3 84 4 84 MONEYKit PostPet
IT
 ディスクロージャー誌 IT 2016 2016 Sony Bank Disclosure 1 2 4 5 6 8 8 8 9 10 10 11 12 14 14 14 15 15 16 16 19 19 20 20 21 22 24 24 26 35 35 35 36 42 42 45 46 48 50 54 55 56 58 62 65 68 19 2 70 19 3 70 4 70 MONEYKit
イントロ
 2013 DISCLOSURE CONTENTS A W A B A N K 2 0 1 3 AWA BANK REPORT 2013 AWA BANK REPORT 2013 200 192 195 194 188 150 140 147 100 120 50 80 73 61 89 0 40 0 100 90 80 60 40 47 41 36 20 0 8,000 6,000 4,000

7,447 1,384 1,62 6,886 1,474 1,79 23, 4,3 3,2 62% 66% 67% 14,334 2,859 2,142 1
 23 234124331 7,447 1,384 1,62 6,886 1,474 1,79 23, 4,3 3,2 62% 66% 67% 14,334 2,859 2,142 1 A Message from the President 23, 4,3 3,2 19,394 3,338 21,68 1,673 23, 1,931 3,494 846 2,738 1,39 4,349 854 3,392
ntv AR05 new/J
 Financial Section 24 25 34 34 34 36 37 38 39 43 44 56 23 1999 2000 2001 2002 2003 2004 328,013 352,409 358,682 336,299 328,374 357,614 203,862 207,743 218,888 215,180 217,844 245,109 54,350 67,302 63,573
SFH P P P P SFH SFHSFH CSR At a Glance 042 SFH 100% 056 SFH 100% 058 SFH 100% SFH 061
 SFH P.001 039 P.040 059 P.060 211 P.212 215 SFH SFHSFH 001 3 008 010 016 1 018 CSR 021 041 At a Glance 042 SFH 100% 056 SFH 100% 058 SFH 100% SFH 061 SFH 2010 3 076 SFH 102 212 216 030 031 032 034SFH 035
seiryo47_0623
 1 Top Message Q 1 259.2 4.1% 11.5 73.9% 11.3 73.6% 6.5 46.9% Top Message 2 Q 2 Q 3 5 4 3 25 45 35 25 2 1 15 2 12/3 13/3 14/3 15/3 3 Top Message Q 4 88.5 19.7% 17.7 53.7% 7.1 74.7% 18.1 34.5% Top Message
ゼリア新薬工業株式会社
 C O N T E N T S TOP INTERVIEW Q A Q A Q A 10.9 22.9 66.2 ZERIA Pharmaceutical Co.,Ltd. 1 TOP INTERVIEW Q A 2 ZERIA Pharmaceutical Co.,Ltd. ZERIA Pharmaceutical Co.,Ltd. 3 Q A Q A Q A Q A R&D III II I II
A ,000 7,539 7,593
 A+ 64 1 300 16 6,000 7,539 7,593 13 3,329 178 1,168 12% 11% 35 3 26 3 761.2 6 8,947 6,044 432 7,774 CONTENTS 01 02 04 07 11 20 38 6,677 6,706 6,044 5,519 5,489 2011 2012 2013 2014 2015 866 796 522

表紙-表4
 1 2 3 4 5 6 7 8 9 10 11 12 13 14 15 16 17 18 200 150 4,420 4,203 620 1,466 5,240 5,819 138 101 3,416 3,194 464 828 4,019 4,123 61 49 730 735 12 42 805 826 100.00 100.00 93.83 93.49 76.86 59.36 92.05 85.06
1 2
 DISCLOSURE 214 1 2 3 4 2,74 65 426 476,51 323,885 52,518 18,798 7.94 9,266 9 6 2,34 74 857 49,26 319,254 516,578 19,34 7.45 11,123 11 624 1,753 84 477 48,826 321,328 57,72 2,21 8.17 1,455 1 68 21 22 23
01
 01 02 Message from President 03 Key Indicators 04 Topics 05 06 Topics 07 WFP 08 Consolidated Financial Statements 09 ( ) ( ) ( ) 10 Non-Consolidated Financial Statements 11 12 Stock Information 13 14 Corporate
,500 NCD 4 1, CSR
 196 22 4 1 22 9 30 22 9 2012 2010 42013 3 2012 2010 42013 3 1 2 3 4 5 2012 210 2 6,500 NCD 4 1,000 1 2 4 CSR 6 6 7 8 8 10 12 1 15 16 17 18 20 21 22 9 30 11 187811 19 11 12 4 21 27 200 2,498 103282 85 28
 2017 3 2017 5 18 Copyright 2017 JAPAN POST BANK CO., LTD. All All Rights Reserved. 1 1. 2017 3 2. 2018 3 2017 3 2018 3 3. Appendix BP SP TP LP GP GP GP Copyright 2017 JAPAN POST BANK CO., LTD. All All
P. 2 P. 4 P. 5 P. 6 P. 7 P. 9 P P.11 P.13 P.15 P.16 P.17 P.17 P.18 P.20 P.21 P.23 P P P P P P P P.31
 201729 3 2017 5 15 P. 2 P. 4 P. 5 P. 6 P. 7 P. 9 P.10 2017 P.11 P.13 P.15 P.16 P.17 P.17 P.18 P.20 P.21 P.23 P.24 10 P.25 11 P.27 12 P.28 13 P.29 14 P.29 15 P.30 16 P.31 17 P.32 P.34 P.35 Copyright 2017
 Sony Financial Holdings 1 2 Sony Financial Holdings 3 Sony Financial Holdings N 4 Sony Financial Holdings N N 5 Sony Financial Holdings N N Life Insurance Bank Non-life Insurance 6 Sony Financial Holdings
【PDF】中間ディスクロージャー誌2007(一括ダウンロード)
") 2007 2007412007930 1 2 4 5 8 10 22 1 Seven Bank 2007 ATM 2 Seven Bank 2007 1 42 47 46 41 43 40 45 44 ATM ATM 35 34 38 39 26 27 29 32 37 33 36 31 28 30 25 24 18 23 21 17 16 22 20 19 ATM 15 10 9 11 13 14
2007 2007412007930 1 2 4 5 8 10 22 1 Seven Bank 2007 ATM 2 Seven Bank 2007 1 42 47 46 41 43 40 45 44 ATM ATM 35 34 38 39 26 27 29 32 37 33 36 31 28 30 25 24 18 23 21 17 16 22 20 19 ATM 15 10 9 11 13 14

, ,377 5,378 4,916 21,000 21, , ,447 1,596,376 1,744,103 9,346 8,471 52,372 51,685 1,709 1,
 2018 2019 3 31 287,752 344,377 5,378 4,916 21,000 21,937 672,244 694,447 1,596,376 1,744,103 9,346 8,471 52,372 51,685 1,709 1,633 658 628 0 1,051 1,004 5,652 6,903 5,637 6,888 14 14 138 1,305 806 903
 28 27 8 4 10 17 2 27 8 7 14 00 1 27 8 14 15 00 2 27 8 21 15 00 1 4 5 2 6 1 27 ABCD 6 2 2 5 5 8% 108 100 49 2 13 140 22 12 7 153-8501 19 23 03-5478-1225 27 8 4 (1) (2) (3) (1) (2) (3) (4) (5) (6) (7) (8)
Ⅳ ,428 3, ,431 3, , ,189 1,550 1,550 1,550 3,050 5,550 60,000 60,000 60, ,1
 Ⅳ 1 3,03224 112.3%3,039 3,2123,509998113 3,509121.7%4,213 1,1741,189 113.6%10,069 112.3%3,0311,633 1,20493.6% 3,5081,013 82.3% 3,688 72.6%14,918148.3%3,516 3,401743 22 3,039 4,213 3,032 3,212 2 2 4 3,509
THE FUJI SHINKIN BANK DISCLOSURE 214 5,58,567 5,4,941 75,318 536 3 95,555 151,431 4 1,615 2,83 889 1,562 177 172 43 2 22 864 1,394 2,776 543 2,233 327
 5,881 6,131 5,595 5,58 5,4 712 531 891 866 1,267 722 443 53 625 878 15,921 16,163 17,2 18,824 19,582 298,21 329,485 314,947 327,88 331,486 13.58 13.5 14.58 15.69 15.24% 43 THE FUJI SHINKIN BANK DISCLOSURE
 3 5 7 9 5 5 7 7 2 2 23 23 2 2 3 3 32 32 33 33 34 34 35 35 36 36 44 44 45 45 49 49 53 53 55 55 57 57 5 5 59 59 62 62 2 THE FUJI SHINKIN BANK Disclosure 2 3 5,43,746 5,24,26 5,224,43 4,9,327 4,6,29,264,93
naka**.pdf‡Ì…R…s†[
 tansei.shareholders 50 2007.4.12007.9.30 Topics 1 2 Top Message 3 4 Speciality 5 6 Speciality 7 8 Works 9 10 Consolidated Financial Statements 11 12 Corporate Data 13 Stock Data 1,250 5.0 1,203 4.8 1,202


100 7 ( ) ( ) ( )
 ( ) ( )") (1) 100 1 102 2 ( 1) 111 100 7 ( ) ( ) ( ) (1) 101 1 ( ) 2 ( 1) 3 ( ) 102 7 4 4 ( ) 5 ( 2) 1 2 ( 1) 1 1 ( ) 1 ( ) ( ) (1) 103 ( 318 ) 2 ( ) 104 7 2 ( ) ( 247 ) ( 248 ) ( ) (1) ( 189 2 ) ( 191 1 ) ( 193
(1) 100 1 102 2 ( 1) 111 100 7 ( ) ( ) ( ) (1) 101 1 ( ) 2 ( 1) 3 ( ) 102 7 4 4 ( ) 5 ( 2) 1 2 ( 1) 1 1 ( ) 1 ( ) ( ) (1) 103 ( 318 ) 2 ( ) 104 7 2 ( ) ( 247 ) ( 248 ) ( ) (1) ( 189 2 ) ( 191 1 ) ( 193
P.7 56
 Financial Section http://www.santen.co.jp/ja/ir/document/securities.jsp 55 P.7 56 57 57 58 59 60 60 61 2006 2007 2008 2009 98,398 100,486 103,394 101,619 34,535 35,484 36,513 35,947 28,897 30,926 33,569

untitled
 2010824 1 2 1031 5251020 101 3 0.04 % 2010.8.18 0.05 % 1 0.06 % 5 0.12 % 3 0.14 % 2010.8.16 5 0.42 % 2010.7.15 25 5 0.42 % 0.426% 2010.6.29 5 0.496 % 2010.8.12 4 0.85 % 2010.8.6 10 0.900 % 2010.8.18 2.340
To Our Shareholders Question 1 Question 2 1 2
 HEIWA INTERIM BUSINESS REPORT 2010 To Our Shareholders Question 1 Question 2 1 2 To Our Shareholders Business Review Question 3 3 4 Special Feature To Our Shareholders 5 6 Special Feature Consolidated
Aflac Incorporated 2014年年次報告書
 40 YEARS IN JAPAN To provide customers with the best value in voluntary insurance products in Japan and the United States 1926-2014 1 LIVING THE LEGACY........................ 1...........................
 C O N T E N T S 4 FINANCIAL DATA 6 10 14 ECOLOGICAL SOLUTION 18 TAISEI NOW 20 22 23 UNDER CONSTRUCTION 24 CONTRACTS RECEIVED 26 CONSTRUCTION COMPLETED 28 30 32 34 4 5 F I N A N 20,000 15,000 14,255 11,851

FX ) 2
 2") (FX) 1 1 2009 12 12 13 2009 1 FX ) 2 1 (FX) 2 1 2 1 2 3 2010 8 FX 1998 1 FX FX 4 1 1 (FX) () () 1998 4 1 100 120 1 100 120 120 100 20 FX 100 100 100 1 100 100 100 1 100 1 100 100 1 100 101 101 100 100
(FX) 1 1 2009 12 12 13 2009 1 FX ) 2 1 (FX) 2 1 2 1 2 3 2010 8 FX 1998 1 FX FX 4 1 1 (FX) () () 1998 4 1 100 120 1 100 120 120 100 20 FX 100 100 100 1 100 100 100 1 100 1 100 100 1 100 101 101 100 100
21322* IR * 2 * 1 *1 *2 *3 IRIR *4 *5 *6 *7 *8 * 4 * 3 * 7 * 3 FATCA VBI VBI M&A M&A * 4 * 7 * 5 ALM * 9 * 8 * 8 * 6
 213 25121 6 J. J.C. M. 3 22 VBI 211 1 J.C. 21322*9 25126 IR * 2 * 1 *1 *2 *3 IRIR *4 *5 *6 *7 *8 * 4 * 3 * 7 * 3 FATCA VBI VBI M&A M&A * 4 * 7 * 5 ALM * 9 * 8 * 8 * 6 2312 3 213 6 13 5 15 4 16 2 4 5 9
J.C. Flowers & Co. LLC GE JR VIEW ALTTE ATM GAICA 216 ATM ATM Patsat ATM 3 1, 1,
 21622 23 25 24 32 21 27 2 21 22 24 25 27 3 24 2 19 1, 1,113 94 1, 8 6 612 53 664 674 76 8 8 6 4 4 2 2-2 TOPIX -4 69 2 21 22 23 24 25 26 27 2 21 22 23 24 1 5 25 26 27 216 28 21 211 213 214 216 28 J.C. Flowers
LIVELY TAISEI
 LIVELY TAISEI C O N T E N T S 4 FINANCIAL DATA 6 10 14 ECOLOGICAL SOLUTION 18 TAISEI NOW 20 22 UNDER CONSTRUCTION 24 CONTRACTS RECEIVED 26 CONSTRUCTION COMPLETED 28 30 32 34 4 5 F I N A N 6 C I A L D A
ESASHI SHINKIN BANK
 2016 ESASHI SHINKIN BANK DISCLOSURE ESASHI SHINKIN BANK ESASHI SHINKIN BANK DISCLOSURE 2016 ESASHI SHINKIN BANK DISCLOSURE 2016 ESASHI SHINKIN BANK DISCLOSURE 2016 ESASHI SHINKIN BANK DISCLOSURE 2016
BN41.indd
 NEWS LETTER No.41 2015 September Management 1 Management 2 3 Financial Data 4 Portrait 5 Holdings News Group News New Products 6 Group News New Products 7 Group News 8 Group News 9 New Products Business
e 7 d d - - a 7 a - 6 Inormation b a
 9/ 2008. No32 5 E 6 e 7 d d - - a 7 a - 6 Inormation b a e c c c a - dd d e b 6 e 6 6 Inormation e 7 7 a a b A e c c d 6 e a a a a a-aa a- a dddd d e b d d d 7 c c c d a d e e e e b 6 d c c c c c b 6
BN46.indd
 NEWS LETTER No.46 2016 December Management 1 Management 2 3 Financial Data 4 Portrait 5 Holdings News Group News New Products 6 Group News 7 Group News 8 Group News 9 10 Business Angle 11 Information 12
株式会社グローバルダイニング
 15,453 7,390 4,292 1,662 3,786 3,176 1,319 717 2,044 796 791 598 1,704 1,808 2,309 2,415 1,934 2,010 823 550 8,333 1,777 1,539 610 59 58 58 278 343 172 444 188 410 496 16,355 17,233 933 1,261 3,515 3,882
untitled
 16 1 1 2 2 2 5 7 7 11 IT 13 19 19 51 95 111 16 10 112 16 114 120 121 21 15 124 PIO NET 5,167 85.3% 13.8% 50.2% 11.3% 1 3.1% 11.8% 13.3%5,167 13 7 18 17 1 31 50 10 10 4 13 15 7 16 15 10 23 13 7 18 17


We must not be afraid of change. 1 HAMASHIN REPORT 216
 We must not be afraid of change. 1 HAMASHIN REPORT 216 1 3 1 5 9 11 12 13 14 15 16 17 19 2 21 22 23 27 29 3 34 35 37 38 6 7 71 HAMASHIN REPORT 216 2 3 HAMASHIN REPORT 216 HAMASHIN REPORT 216 4 5 HAMASHIN


P. 2 P. 4 P. 5 P. 6 P. 7 P. 9 P.10 P.12 P.13 P.14 P.14 P.15 P.17 P.18 P.20 P P P P P.25 P.27 P.28 Copyright 2016 JAPAN POST BA
 201729 3 1 2016 8 12 P. 2 P. 4 P. 5 P. 6 P. 7 P. 9 P.10 P.12 P.13 P.14 P.14 P.15 P.17 P.18 P.20 P.21 10 P.22 11 P.23 12 P.24 13 P.25 P.27 P.28 Copyright 2016 JAPAN POST BANK CO., LTD. All Rights Reserved.
P. 2 P. 4 P. 5 P. 6 P. 7 P. 9 P P.11 P.14 P.15 P.16 P.16 P.17 P.19 P.20 P.22 P P P P P P P P P
 201628 3 2016 5 13 P. 2 P. 4 P. 5 P. 6 P. 7 P. 9 P.10 2016 P.11 P.14 P.15 P.16 P.16 P.17 P.19 P.20 P.22 P.23 10 P.24 11 P.26 12 P.27 13 P.28 14 P.28 15 P.29 16 P.30 17 P.31 P.33 P.34 Copyright 2016 JAPAN

untitled
 2015 1 2 3 4 5 6 7 8 9 10 Non-life Insurance Business Life Insurance Business Oversea Business 11 12 13 14 15 16 17 18 19 20 21 22 23 24 23673.6% 61.3% 25 30.2% 599 2,64080.2% 1,853104.0% 26 751.7% 9780

 Section 1 Section 2 Section 3 Section 4 Section 1 Section 3 Section 2 4 5 Section 1 6 7 Section 1 8 9 10 Section 1 11 12 Section 2 13 Section 2 14 Section 2 15 Section 2 16 Section 2 Section 2 17 18 Section
1 48
 Section 2 1 48 Section 2 49 50 1 51 Section 2 1 52 Section 2 1 53 1 2 54 Section 2 3 55 1 4 56 Section 2 5 57 58 2 59 Section 2 60 2 61 Section 2 62 2 63 Section 2 3 64 Section 2 6.72 9.01 5.14 7.41 5.93

Sony Life Insurance Co., Ltd
 1... 082 1-01... 082 1-02... 083 2... 084 2-01... 084 2-02... 086... 086 3... 087 3-01... 087 3-02... 087 3-03... 088 1.... 088 2.... 088 3.... 088 3-04... 088 1.... 088 2.... 088 4... 088 5... 089 6...
![宅建練馬表478号1_4ol [更新済み].eps](/thumbs/39/20197934.jpg "宅建練馬表478号1_4ol [更新済み].eps")

Sony Life Insurance Co., Ltd. 2017
 1... 082 1-01... 082 1-02... 083 2... 084 2-01... 084 2-02... 086... 086 3... 087 3-01... 087 3-02... 087 3-03... 088 1.... 088 2.... 088 3.... 088 3-04... 088 1.... 088 2.... 088 4... 088 5... 089 6...
untitled
 351 351 351 351 13.0 0.0 25.8 1.0 0.0 6.3 92.9 0.0 80.5 0.0 1.5 15.9 0.0 3.5 13.1 0.0 30.0 54.8 18.0 0.0 27.5 1.0 0.0 2.5 94.7 0.0 91.7 0.0 1.3 14.7 0.0 3.8 14.4 0.0 25.0 50.5 16.0 0.0 27.5 2.0 0.0 2.5
DCR-PC300K/IPK
 3-084-945-02(1) 6 19 31 34 39 2003 Sony Corporation * b 2 3 6 19 31 4 34 39 5 \ 6 * * * 7 1 2 * 3 b 4 1 2 5 6 8 7 1 8 1 2 *, 9 2 7 3 8 * 4 9 5 6 z 10 10 1 2 3 1 1 11 2 * 2, 11 3 8 4 5 9 6 7 12 13 b,,,,,
42,955 27,585 6,696 53,020 44,577 2,198 43,625 25,917 16,007 12,213 12,062 11,788 0 20,000 40,000 60,000 80,000 100,000 120,000 140,000
 Disclosure 2005 TOMAKOMAI SHINKIN BANK 11 350,000 300,000 250,000 200,000 150,000 100,000 50,000 24,281 21,469 22,693 66,792 67,769 73,165 216,099 222,407 228,456 0 7 42,955 27,585 6,696 53,020 44,577
2015年年次報告書
 Aflac Incorporated Year in Review 2015 1 To provide customers with the best value in voluntary insurance products in Japan and the United States................................ 4.................... 6....................
 23.9 26.0 20083 3 20074 200712 20093 3 20084 200812 20083 3 20074 200712 20093 3 20084 200812 5 5 SBI 2004 2005 2006 2007 2008 5 1 10 30,000 25,000 20,000 15,000 10,000 5,000 0 1Q 2Q 3Q 4Q 1Q 2Q 3Q 4Q


*1和-1 共通(HD-ミライト) ホールディングス会社概要
 ホールディングス会社概要") Corporate Profile Corporate Slogan President s Message Corporate Philosophy Promise Solutions Engineering Support ICT Solutions Social Innovation Mobile Network Communications Infrastructure Environmental
Corporate Profile Corporate Slogan President s Message Corporate Philosophy Promise Solutions Engineering Support ICT Solutions Social Innovation Mobile Network Communications Infrastructure Environmental
取扱説明書
 ED-601 ED-501 ED-401 2 3 4 23 14 5 6 18 10 7 1 2 6 3 4 8 9 16 16 16 12 1 2 18 10 2 1 5 12 11 1 2 1 2 12 1 2 13 16 14 3 2 4 1 1 2 16 3 4 18 15 1 2 16 2 3 1 1 2 3 18 17 18 22 19 D A C 20 A B 22 B C D 22
19718 19973 19925 20001 20004 19984 19994 199112 ST 10,000 20,000 89 19988 200011 TPS PARK 24 ACHIEVEMENTS
 PARK 24 REPORT 2006 20051112006430 04 07 11 12 21 19718 19973 19925 20001 20004 19984 19994 199112 ST 10,000 20,000 89 19988 200011 TPS PARK 24 ACHIEVEMENTS SPC 20063 20064 200012 20019 40,000 60,000 20033
2005 No ,000 8,000 7,000 6,000 5, , , ,000 4, ,000 3,000 2,000 1, , , , , ,875.0
 2005No.1322 9,000 8,000 7,000 6,000 5,471.8 6,657.6 8,353.9 5,000 4,555.3 4,000 3,000 2,000 1,000 483.5 896.9 1,438.2 2,063.6 2,810.7 3,281.8 3,875.0 0 1995 1996 1997 1998 1999 2000 2001 2002 2003 2004
エネルギー業界における競争優位の
 16 2004 7 1 1 0.1 2000330 0.3 20044 500kW 7.0 2000 2004 2005 20054 50kW 17 2PPS 70,000 60,000 60,377 50,000 40,000 30,000 20,000 10,000 35,434 32,733 19,347 16,048 12,204 6,893 6,759 6,604 0 PPS 1,640


 20 8 27 18 10 28 16 9 29 20 3 14 16 9 30 20 8 27 16 9 29 8 36 21 33 m3 4 3 m3 9m JR 14 1 25 16 3 16 9 30 16 9 29 10 24 1/40 204mm/24h 750m3/s 10m 41 m3 16 9 29 15 16 8 26 16 9 30 16 8 26 16 9 30 41
80期期末_表1_web.ai
 80 01 TO OUR SHAREHOLDERS 01 01 02 05 11 12 13 14 Go! Next 60 02 Go! Next 60 03 04 Go! Next 60 TOPICS 05 TOPICS 06 TOPICS 07 TOPICS 08 TOPICS 09 10 TOPICS FINANCIAL REVIEW 2,978 3,054 3,264 387 379 421
untitled
 Tsuru shinyo kumiai Disclosure Tsurushin Report 2007 1 2 2 2 3 4 5 6 7 8 9 10 11 11 14 15 16 17 18 19 23 24 25 26 28 37 38 41 41 42 49 Business and Business and outline DATA DATA
2013 LIXIL LIXIL NPO LIXIL LIXIL
 2013 LIXIL LIXIL 01 10 2013 7 19 LIXIL 2002 5 13 02 2013 9 10 LIXIL 1967 1 10 03 12 2 2013 10 22 LIXIL 1977 5 14 1 2013 LIXIL 04 2013 10 29 LIXIL 1985 8 NPO 12 05 3 2013 11 21 LIXIL 1997 7 13 06 2013 11
1
 浜松 信用 金庫 12 ディスクロージャー 表紙 オモテ 212 7.4 ANZ4E2 中村 33 43 デジコン 2 校 1 CONTENTS 1 3 4 CSR 5 7 CSR 9 1 1 11 12 13 15 16 17 19 21 22 24 25 27 29 32 6 74 2 3 24 514 24 423 54 1 2 23 829 533 1 4 5 C S R 21 FHA212
年次報告書2008年3月期
 P60 P107 3 1 3 2 3 12008 3 2 5 1 2008 3 78,592 290,743 227,020 23,521 128,616 88,445 16,756 300,361 1,154,054 78,592 105,465 227,020 23,521 15,747 7,389 16,756 129,885 1 604,375 106,140 185,278 112,869
, , % GDP GDP 9.7% GDP (%) 10 ( )
 10 ( )") P64 P72 P74 P75 P76 P77 P79 P102 63 2010 2009 1 3 2010 10 12 2011 1 3 2009 2 2 8,000 2010 4 6 116,000 12 2010 10 12 2011 2 2010 1 3 11.9% GDP 2011 1 3GDP 9.7% 2010 2010 5 GDP (%) 10 ( ) 15,000 5 ( ) 5
P64 P72 P74 P75 P76 P77 P79 P102 63 2010 2009 1 3 2010 10 12 2011 1 3 2009 2 2 8,000 2010 4 6 116,000 12 2010 10 12 2011 2 2010 1 3 11.9% GDP 2011 1 3GDP 9.7% 2010 2010 5 GDP (%) 10 ( ) 15,000 5 ( ) 5
日東紡_147期中間_0830
 147 19 4 119 9 30 BP PRESIDENT S MESSAGE 14719 4 1 19 9 30 IT Relay1012 682 88 1.056 42 10.3%55 328.6 35 7695.1 Relay101 19 12 1 STRUCTURAL REFORM Relay1012 6 4 6 Textiles Division 1 C S Y Building Materials
株式会社フジテレビジョン
 66 184118930 Fuji TV Report Cover Contents 2 Top Message 3 Top Interview 6 Corporate Business Plan 7 Fuji TV Outline 10 Special Report 11 Consolidated Financial Statements 13 Non-Consolidated Financial
BN43.indd
 NEWS LETTER No.43 2016 March Management 1 Management 2 3 Financial Data 4 Portrait 5 Holdings News Group News 6 Disney Disney/Pixar Disney. Based on the Winnie the Pooh works by A.A. Milne and E.H. Shepard
七転び八起き 我が社の富裕層攻略法 レディは昼飯時に走る
 9 12 9 36 NiKKei Business 2007 2 12 25 30% 2200m 2 11 10 1 4 2002 2002 9 1 1 3 9 1 2 12 9 2600 2005 9 1 1000m 2 25 30 10 1 20 30 2 NiKKei Business 2007 2 12 37 9 5 5 1 30 50 1 300 2 3 1 1 1 56 5 140 2

広報えちぜん12月号_4校.indd
 24 7,140,000 24 3,129,000 24 20,685,000 24 9,292,500 24 8,925,000 24 13,492,500 24 NO. 5,670,000 24 4,470,900 24 8,494,500 24 2,341,500 24 4,021,500 Jr. [ ] 128 1214 845 855 1345 1355 2015 2025 121 127


 13 21 13 3 10 2010 5 6 20 32 10 10 3 JR 14 3 1 8 2 15 6 ( ) 135 1 8 2 15 135 5 135 1 8 2 15 5 JR 135 1 8 2 15 JR 1 135 1 8 2 15 JR 135 135 135 JR 135 1 8 2 15 135 1 8