IT
|
|
|
- こうだい うとだ
- 5 years ago
- Views:
Transcription
1
2 IT
3 Sony Bank Disclosure MONEYKit PostPet PostPet Sony Network Communications Inc.

4 President s Message 2017 Sony Bank Disclosure
5 ,95415,396 11Visa Sony Bank WALLET 1,894 21, Sony Bank WALLET Sony Bank WALLET Sony Bank WALLET Club S ATM Sony Bank WALLET / "PlayStation" PlayStation Sony Bank WALLET 2 4 Beta Sony Bank WALLET Sony Bank Disclosure 3
6 4 Corporate Outline 2017 Sony Bank Disclosure IT IT
7 % 出資 生命保険事業 2017 Sony Bank Disclosure 5 100% 出資 50% 出資 50% 出資 ソニーライフ エイゴン生命 SA Reinsurance 損害保険事業 100% 出資 銀行事業 57% 出資 ソニーペイメントサービス 100% 出資 SmartLink Network Hong Kong 介護事業 100% 出資 100% 出資 ライフケアデザイン 連結子会社持分法適用関連会社 Sony Bank WALLET 3
 外国為替証拠金取引 (FX)")

8 Products Sony Bank Disclosure & Services 使う 外貨決済行き出し (Visa デビット ) 外国為替証拠金取引 (FX) 外貨送金 外貨普通預金 Sony Bank WALLET 外貨建て投資信託外貨 MMF 殖やす 為替リンク預金 外貨定期預金 積立購入 貯める 2 MMF NISA FX 14 NZ NZ


9 Sony Bank WALLET Visa 11 NZ 1200 ATM 1 TTS JR CONSULTING PLAZA 2017 Sony Bank Disclosure CONSULTING PLAZA


10 Sony Bank Disclosure plus Sony Bank WALLET Sony Bank WALLET 1 ATM PostPet 5 Beta Club S ATM ATM 9 ATM ATM ATM UFJ ATM ATM ATM

11 ,080 ATM ,000 1 ATM ,999 ATM 2017 Sony Bank Disclosure 9


12 10 Environmental Initiatives 2017 Sony Bank Disclosure ISOISO14001 ISOISO14001 CO2100 CO2 CO2 110
13 Visa Sony Bank WALLET Sony Bank WALLET Sony Bank WALLET / "PlayStation" Sony Bank WALLET ATM Club S 2016 Sony Bank WALLET Sony Bank WALLET Web Sony Bank WALLET Sony Bank WALLET / "PlayStation" PlayStation Store 2% Club S Business Overview 2017 Sony Bank Disclosure 11
14 Sony Bank Disclosure ,985 24,388 2,94323, , , , 業務粗利益 営業経費 経常利益 ( 億円 ) ,976 24,242 1,954 15,396 2,153 14,524 0 ( 年度 ) 業務粗利益営業経費経常利益 貸出金残高 ( 億円 ) 16,000 12,000 8,000 4,000 0 ( 年度末 ) 住宅ローン 8,603 9,493 10,743 12,371 14,524 その他 1,098 1,081 1,128 1, 合計 9,702 10,574 11,871 13,441 15,396
15 2,9372 3,429 1,894 21,129 1,770 17, ,480 有価証券残高 ( 格付け別 ) AAA AA ( 億円 ) 10,000 5,000 0 ( 年度末 ) ,012 1,826 1,272 1,263 1,602 3,254 3,047 2,559 1,652 1, 預金残高 口座数 ( 億円 ) ( 万件 ) 25,000 20,000 15,000 10,000 5,000 0 ( 年度末 ) 外貨預金 3,902 3,635 3,272 3,355 3,480 円預金 14,672 15,264 15,510 15,879 17, Sony Bank Disclosure 13 A 2,356 2,386 2,838 3,070 3,030 合計 18,574 18,900 18,782 19,235 21,129 BBB その他 口座数 ( 右目盛 ) 合計 9,088 7,738 7,300 6,209 6, ,756 1, ,359 4,282 4,310 4, ,115 6,235 > <41> <59> 自己資本比率 (%) 自己資本比率 0 ( 年度末 )
16 14 Ensuring Fair Business Practices 2017 Sony Bank Disclosure ALM 5 1 4
17 ADR Sony Bank Disclosure 15
18 Sony Bank Disclosure :00 20: :00 17: :00 17:
19 Value at Risk a b Value at Risk a b 2017 Sony Bank Disclosure 17
20 Sony Bank Disclosure BS7799-Part28 ISMS BS7799-Part2ISO20065 ISMSJIS 20064ISO/IEC JIS Q ISO/IEC 27001:2013 JIS Q27001:2014
21 SA Reinsurance Ltd Sony Bank Disclosure 19
22 Sony Bank Disclosure 1. 2.
23 Sony Bank Disclosure 21
24 DataCorporate Sony Bank Incorporated PwC S&P AA JCR , % A A1 SmartLink Network Hong Kong 20 URLhttp://sonybank.net/disclosure/e_publicnotice/ index.html Sony Payment Services Incorporated , SmartLink Network Hong Kong Limited Hong Kong, China HK$1,000,000 0% 100% Sony Bank Disclosure
25 Sony Bank Disclosure 23


26 Sony Bank Disclosure MONEYKit ATM 9 S&P 12 MONEYKit-PostPet 3 8 UFJ UFJATM ATM ATM UFJATM ISOISO JCR ATM 11 ATM


27 ATM Visa Sony Bank WALLET 4 Sony Bank WALLET Club S 3 Sony Bank WALLET / PlayStation 2017 Sony Bank Disclosure J Beta
28 Sony Bank Disclosure S.C.
29 2017 Sony Bank Disclosure 27 Financial Section
30 28Consolidated Financial Data 2017 Sony Bank Disclosure PwC , ,581 1,921,805 2,109, ,000 23,000 23,000 60, , , , ,344,184 1,539,630 78,084 71,520 1,139 7, ,507 53,223 1,103 1,117 1, ,061,895 2,356, ,711 4,803 31,000 31,000 4,677 4,789 21,000 21, ,419 25, ,419 77,815 1, ,331 4,776 1, ,531 1, ,328 1,329 1,460 78,391 82,604 2,140,286 2,438,836 2,140,286 2,438,836
31 ,937 38,510 25,482 26,533 14,739 16,065 10,671 10, ,886 6,870 5,189 4, ,949 33,460 9,022 8,672 4,829 5, ,921 3,372 4,054 5, ,541 19, ,987 5, ,976 4,834 1,954 1, ,017 1,414 3,959 3, ,905 3, ,959 3,420 3,632 2,703 3,286 1, , , , Sony Bank Disclosure
32 Sony Bank Disclosure ,000 21,000 20,514 72,514 6,618 2, ,258 1,292 78,064 3,905 3,905 3,905 3, , ,577 3,905 3,905 3, , ,000 21,000 24,419 76,419 3,331 2, ,329 78, ,000 21,000 24,419 76,419 3,331 2, ,329 78, ,000 21,000 24,468 76,468 3,331 2, ,329 78,440 1,959 1,959 1,959 3,306 3,306 3,306 1,444 1, , ,816 1,347 1,347 1,444 1, , ,164 31,000 21,000 25,815 77,815 4,776 1, ,328 1,460 82,604
33 ,976 4,834 1,951 1, ,482 26,533 9,022 8,672 7,222 5, ,126 3, , ,446 43, ,285 20,000 50,000 5, ,000 70,000 1,085 6, ,395 29,088 9,279 8,782 6,131 23,016 75,671 99,628 2,322 1,836 77,993 97, , ,315 87,584 51, , , ,071 1,793 90,992 22,434 7,000 1, , ,965 66, , , , ,581 Sony Bank Disclosure
34 Sony Bank Disclosure SmartLink Network Hong Kong Limited
35 , , , , , , , ,000 14, , , , , , () ,959 3, () , , Sony Bank Disclosure
36 Sony Bank Disclosure 1. (:) 180, , ALM 2 ALM i ALM 11ALM VaR ALM ii iii
37 2017 Sony Bank Disclosure 35 i , (1) 180, ,581 (2) 6,218 6, , ,026 (3) 1,539,630 * ,538,661 1,701, ,538 2,348,488 2,511, ,626 (1) 2,109,583 2,111,525 1,941 2,109,583 2,111,525 1,941 (*2) 2,529 2,529 (17,959) (17,959) (15,429) (15,429) *1 * LIBOR 1 LIBOR *1
38 Sony Bank Disclosure ,990 6, ,218 6, ,000 23, ,218 6, , , , ,516 8,425 69,596 63,897 5,699 34,866 33,697 1,168 58,479 56,921 1, , ,903 5, , ,617 2,955 4,474 2,286 2, , ,419 13,569 32,399 33, ,496 28, ,903 4, , , , , , ,067 1, , ,487 12, , , ,
39 ,328 36,486 38,424 37,937 38, ,454 5,636 7,327 5,987 5, ,277 3,449 4,585 3,905 3, ,492 4,706 4, , ,134 73,840 78,064 78,391 82, ,012,627 2,068,713 2,074,623 2,140,286 2,438, ,332 1, ,443 1,227 3,061 2, Sony Bank Disclosure
40 38Non-Consolidated Financial Data 2017 Sony Bank Disclosure PwC , ,468 1,923,506 2,112, , , , ,468 1,080,159 1,129, , ,017 23,000 23,000 70, , ,296 60, ,000 81, ,083 60, ,000 37,811 34, ,626 63, ,050 2, , ,684 64,088 55,199 1,344,184 1,539, ,332,050 1,521,546 4,845 4,646 12,133 18,084 22,041 20,661 1,139 7,268 30,913 20,582 1,139 7, ,272 41, ,886 7,825 3,889 3, ,235 5, ,701 21, ,740 7, ,367 2,821 2,049,136 2,342, ,000 31, ,000 21, ,000 21,000 3,253 3,170 24,627 25,893 3,248 3, ,627 25,501 1, ,627 25,501 1, ,627 77,893 3,331 4,776 2,531 1, ,438 77,428 81,332 2,126,564 2,424,236 2,126,564 2,424,236
41 ,892 35,105 25,482 26,534 14,739 16,066 10,671 10, ,842 3, ,664 3,257 5,189 4,871 4,263 4, ,035 30,470 9,021 8,671 4,829 5, ,921 3, ,692 5, ,558 4, ,991 16, ,857 4, ,857 4,484 1,920 1, ,944 1,308 3,912 3,176 Sony Bank Disclosure
42 Sony Bank Disclosure ,000 21,000 21,000 20,715 20,715 72,715 6,618 2,269 4,348 77,064 3,912 3,912 3,912 3,912 3, ,548 3,548 3,912 3,912 3,912 3, , ,000 21,000 21,000 24,627 24,627 76,627 3,331 2, , ,000 21,000 21,000 24,627 24,627 76,627 3,331 2, , ,000 21,000 21,000 24,676 24,676 76,676 3,331 2, , ,351 1,959 1,959 1,959 3,176 3,176 3,176 3,176 1,444 1,192 2,637 2, ,217 1,217 1,444 1,192 2,637 3,854 31,000 21,000 21, ,501 25,893 77,893 4,776 1,338 3,438 81,332
43 Sony Bank Disclosure
44 Sony Bank Disclosure , , , , , , , , ,000 14, , , , , , ,990 6, ,218 6, ,218 6, ,050
45 162, ,516 8,425 69,596 63,897 5,699 34,866 33,697 1,168 58,479 56,921 1, , ,903 5, , ,617 2,955 4,474 2,286 2, , ,419 13, ,467 32,399 33, ,496 28, ,803 4,903 4, , , , , , , , ,067 1, , ,487 12, , , , , , ,000 23, Sony Bank Disclosure
46 Sony Bank Disclosure ,351 33,994 35,714 34,892 35, ,282 5,845 7,298 5,857 4, ,585 4,634 3,912 3, ,000 31,000 31,000 31,000 31, , , , , , ,811 72,774 77,064 77,428 81, ,005,081 2,056,704 2,062,525 2,126,564 2,424, ,857,447 1,890,022 1,878,256 1,923,506 2,112, ,226 1,057,419 1,187,187 1,344,184 1,539, , , , , , ,649 3,876 16,525 13,813 4,104 17,917 (56) (5) 16,885 8,652 25,482 17,951 8,588 26,534 (56) (5) 4,236 4,776 8,956 4,138 4,483 8, , ,580 3, ,842 3, ,465 3, ,692 4, , ,631 5, ,780 4, ,791 5, ,821 4, ,098 8,585 21,684 12,152 8,968 21, % 1.86% 1.08% 0.69% 2.09% 0.96%
47 (40,019) (56) (4,067) (5) 1,577,374 16, % 1,757,036 17, % 1,249,373 14, % 1,439,927 15, % 209,673 2, % 187,305 1, % 5, % % 67, % 116, % % % () () () () 1,565,074 4, % 1,737,072 4, % 1,531,568 2, % 1,665,317 2, % 5, % 22, % 50, % 71, % , , , , () () () () 459,444 8, % 429,121 8, % 9, % 8, % 445,850 8, % 414,862 8, % % % % % % % (40,019) (56) (4,067) (5) 364,696 4, % 347,060 4, % 324,800 2, % 342,872 2, % % % % % ,996,800 25, % 2,182,089 26, % 1,258,425 14, % 1,448,319 16, % 655,523 10, % 602,167 10, % 5, % % 67, % 116, % % % 1,889,751 8, % 2,080,065 8, % 1,856,369 4, % 2,008,190 5, % 5, % 22, % 50, % 71, % , , , , Sony Bank Disclosure
48 Sony Bank Disclosure % 1.88% 1.27% 1.02% 2.00% 1.21% 0.27% 1.30% 0.47% 0.23% 1.29% 0.41% 0.79% 0.57% 0.80% 0.78% 0.70% 0.80% , ,065 2,037 1, , , , , , ,364 1,312 1,051 2,078 1, , ,326 1, , ,
49 ,592 3, ,249 1,280 1,173 1,299 2,055 1, ,927 1, ,629 1, , ,139 1,341 15,991 16, % 0.20% 7.58% 5.83% 0.19% 0.14% 5.06% 4.00% , , , , , ,235 1,009, ,214 1,166,475 1,101, ,521 1,266, ,531, ,800 1,856,369 1,665, ,872 2,008, , , , , , ,562 1,080, ,749 1,240,909 1,129, ,023 1,303, ,584, ,238 1,923,506 1,760, ,668 2,112, , ,894 Sony Bank Disclosure
50 Sony Bank Disclosure , , , , , , , , , , , , ,882 13,882 60,494 60, ,101 9,101 15,381 15, ,184 84,184 52,275 52,275 1,172,749 1,172,749 1,227,766 1,227, ,241,588 9,051 1,250,640 1,423,903 8,390 1,432,294 7, ,785 16, ,025 1,249,373 9,051 1,258,425 1,439,927 8,391 1,448, ,322,682 9,368 1,332,050 1,514,358 7,187 1,521,546 12, ,133 18, ,084 1,334,815 9,368 1,344,184 1,532,440 7,190 1,539, ,049 30, ,871 33, ,297 30,649 33,946 2,675 20,897 23, ,790 22,932 27,722 5,658 22,143 27, ,523 22,914 32,438 10,631 13,768 24, ,881 18,304 42,185 28,493 16,324 44, , ,977 1,177, , ,262 1,385, , ,827 1,344, , ,267 1,539,630
51 ,520 1,081, ,520 1,081, , , , ,050 1,344,184 1,539, ,251,919 1,465,731 92,264 73,899 1,344,184 1,539, ,247, % 1,470, % 96, % 69, % 34, % 25, % 1, % 1, % 1, % 1, % 2, % 6, % 6, % 7, % 4, % 9, % 5, % 26, % 21, % 3, % % 3, % 1, % 1,344, % 1,539, % Sony Bank Disclosure
52 Sony Bank Disclosure A) 1,344,184 1,539,630 B) 1,262,492 1,482,587 B)/(A) 93.92% 96.29% % 2.76% 69.88% 87.05% 2.03% 72.86% 81.57% 2.78% 67.78% 86.46% 2.44% 72.12% ,332 1, ,443 1,227 3,061 2, ,
53 ,154 15,117 2,113 66, , , ,866 5,055 13,042 37,066 6,139 2, ,611 2,050 2,050 87, , ,574 43,461 10,574 19,589 4, ,684 87, , ,574 43,461 10,574 19, ,209 4,474 4, , , ,789 49,916 12,653 86,515 6, , ,009 29,798 1,056 2,147 44,475 81,487 2,629 14,922 20,259 37,811 4,729 8,060 22,054 27,427 2, ,626 2,050 2, , ,855 86,378 41,874 22,676 5,469 3, , , ,855 86,378 41,874 22,676 5, ,041 3,975 3, , , ,411 91,708 24,757 50,218 6, , ,519 79,519 85,241 85,241 44,202 44,202 35,520 35,520 81,542 81,542 62,143 62,143 2,050 2,050 2,050 2,050 2, , ,209 2, , , , , , ,862 2,358 2,358 2,348 2, , , , , , , ,487 81, , ,083 37,811 37,811 34,866 34,866 64,626 64,626 63,611 63,611 2,050 2,050 2,050 2,050 3, , ,017 4, , , , , , ,209 3,975 3,975 4,474 4, , , , , , ,296 Sony Bank Disclosure
54 Sony Bank Disclosure % % 32.28% 11.82% % 29.87% 13.69% % 35.31% 11.24% % 29.98% ,990 6, ,218 6, ,218 6, ,980 8, ,254 8, ,254 8,
55 , ,516 8,425 69,596 63,897 5,699 34,866 33,697 1,168 58,479 56,921 1, , ,903 5, , ,617 2,955 4,474 2,286 2, , ,419 13,569 32,399 33, ,496 28, ,903 4, , , , , , ,067 1, , ,487 12, , ,469 10,602 73,506 66,273 7,233 37,811 36,384 1,427 63,753 61,812 1, , ,186 6, , ,016 4,624 4,860 3,170 1, , ,655 16, , , , , , , , ,366 16, ,050 2,050 Sony Bank Disclosure
56 Sony Bank Disclosure ,000 23, ,000 23, ,528 3, ,528 3, , , , ,269 17,639 17,
57 1 25,921 25, ,921 25, ,111 49,942 2, , ,112 26,945 28, , , ,494 1,309 1,309 18,449 1,018 1, , ,529 2, ,645 4, Sony Bank Disclosure
58 Sony Bank Disclosure , , ,688 1,920 1,920 20, , ,611 3, , ,021 1,443 1,227 1,342,916 1,544,587 1,345,983 1,547,579
59 Sony Bank Disclosure
60 58 Capital Adequacy 2017 Sony Bank Disclosure ,459 76,225 52,000 52,000 24,419 25,815 1,959 1, ,000 12,745 1,063 1,022 91,972 89,927 1,317 1,946 1,992 1, ,297 1,946 1,992 1,328 1,253 1,317 3,246 90,655 86,680
61 875, ,032 23,063 15,640 1,946 1,328 25,009 16,969 44,644 43, , , , % 9.69% ,668 76,303 52,000 52,000 24,627 25,893 1,959 1, ,000 12,745 91,180 89, ,349 1, ,349 1, , ,569 90,280 86, Sony Bank Disclosure 59
62 Sony Bank Disclosure 872, ,475 23,660 16,092 1, ,009 16,969 40,094 38, , , , % 9.75% SmartLink Network Hong Kong Limited ,000 10,
63 Sony Bank Disclosure 61
64 Sony Bank Disclosure 1 S1 S2 A1 A2 A3 B1 B2 B3 C1 C2 C3 C4 C5 D E F G H PD PDLGD EAD PDLGDEAD 1. SmartLink Network Hong Kong Limited 5 R&I JCR Moodys S&P Fitch 5. ISDA
65 6. Value at Risk R&I JCR Moodys S&PFitch Sony Bank Disclosure 63
66 Sony Bank Disclosure BPVGPS Value at Risk ALM. GPS % %1%
67 ,477 7,899 4, ,187 19,404 14,888 4,516 3 PD/LGD 3 3, CVA % % 8, % 1,357 A) 39,668 B) 3,507 A) B) 43, % 8% 2. 8%8% Sony Bank Disclosure 65
68 Sony Bank Disclosure % 35, ,613 2,427,796 1,540, ,524 4,221 3,022 2,448,409 1,540, ,524 4,221 3,022 2,280,741 1,537, ,618 3,753 3, ,668 2, , ,448,409 1,540, ,524 4,221 3, ,996 67, ,027 4, ,243 1, ,497 1,481,170 1,471, ,022 2,448,409 1,540, ,524 4,221 3, ,856 15, , ,292 23, , ,718 27, , ,239 25,254 35,386 2, ,528 44,848 12, ,453,308 1,385,819 67,489 2,761 36,468 18, ,448,409 1,540, ,524 4,221 3, CVA
69 , ,035 1, % % 20 % 9,803 3, % 50 % % % 5, % 250 % % 10,561 10, % 400% Sony Bank Disclosure 67
70 Sony Bank Disclosure 7 1) PD/LGD 2016 PD LGD EAD 0.14% 32.88% 18.88% 161,673 84, % 46.28% 24.79% 123, % 19.12% 11.63% 37,418 84, % 45.00% % % 45.00% 1.31% 411, , % 45.00% 1.15% 409, , % 45.00% 58.51% 1, % 40.02% 21.40% 152,122 21, % 39.82% 20.83% 140,604 20, % 42.59% 28.65% 11, PD/LGD 1. S A B C D E EADCCF
71 2) PD LGD ELdefault 2016 EAD 0.58% 20.91% 11.72% 1,321, % 20.89% 11.67% 1,318, % 21.09% 38.48% % 27.47% 25.13% 29.31% 2, % % 97.88% 131, % % 97.88% 131, % % % 18,171 9,886 20, % 9.96% % % 17,980 9,882 20, % 51.67% % % % % % 0.00% % EADCCF PD/LGD 2016 / Sony Bank Disclosure 69
72 Sony Bank Disclosure 9 PD/LGD / 1, , , , , ,029 70,000 1,118 16,853 19,096 10, ,065 89, ,
73 ,505 1,890 4,699 4,396 6,204 6,287 2,151 1,343 4,053 4,944 3,787 2,608 2,418 3, ,418 3, ) ,193 14, Sony Bank Disclosure 71
74 Sony Bank Disclosure 2) % 15, %50% 50%100% 100% 250% 250% 650% 650%1250% 1250% 15, %
75 5 PD/LGD , % 1250% 111, , , % 1.8% P Sony Bank Disclosure 73
76 Sony Bank Disclosure ,170 7,899 4, ,187 19,404 14,888 4, PD/LGD 695 3, CVA % % 8, % 1,357 A) 39,863 B) 3,104 A) B) 42, % 8% 2. 8%8% % 35,471
77 ,032 2,427,736 1,540, ,524 4,221 3,022 2,431,768 1,540, ,524 4,221 3,022 2,264,100 1,537, ,618 3,753 3, ,668 2, , ,431,768 1,540, ,524 4,221 3, ,355 67, ,027 4, ,243 1, ,497 1,481,170 1,471, ,022 2,431,768 1,540, ,524 4,221 3, ,276 15, , ,292 23, , ,718 27, , ,239 25,254 35,386 2, ,528 44,848 12, ,453,308 1,385,819 67,489 2,761 36,407 18, ,431,768 1,540, ,524 4,221 3, CVA , ,035 1, Sony Bank Disclosure 75
78 Sony Bank Disclosure % % 20 % % 50 % 75 % % 3, % 250 % 1250 % 4, % 400% 2,050 2,
79 7 1) PD/LGD PD LGD 2016 EAD 0.14% 32.88% 18.88% 161,673 84, % 46.28% 24.79% 123, % 19.12% 11.63% 37,418 84, % 45.00% % % 45.00% 1.31% 411, , % 45.00% 1.15% 409, , % 45.00% 58.51% 1, % 40.02% 21.40% 152,122 21, % 39.82% 20.83% 140,604 20, % 42.59% 28.65% 11, PD/LGD 1. S A B C D E EADCCF Sony Bank Disclosure 77
80 Sony Bank Disclosure 2) 2016 PD LGD ELdefault EAD 0.58% 20.91% 11.72% 1,321, % 20.89% 11.67% 1,318, % 21.09% 38.48% % 27.47% 25.13% 29.31% 2, % % 97.88% 131, % % 97.88% 131, % % % 18,171 9,886 20, % 9.96% % % 17,980 9,882 20, % 51.67% % % % % % 0.00% % EADCCF PD/LGD 2016 /
81 9 PD/LGD / 1, , , , , ,029 70,000 1,118 16,853 19,096 10, ,065 89, , Sony Bank Disclosure 79
82 Sony Bank Disclosure ,505 1,890 4,699 4,396 6,204 6,287 2,151 1,343 4,053 4,944 3,787 2,608 2,418 3, ,418 3, ) ,193 14, ) % 15, %50% 50%100% 100% 250% 250% 650% 650%1250% 1250% 15, %
83 PD/LGD 2, ,050 2, Sony Bank Disclosure 81
84 Sony Bank Disclosure , % 1250% 111, , , % 1.8% 11. P a. SmartLink Network Hong Kong Limited b.
85 c %200% Sony Bank Disclosure 83
86 Sony Bank Disclosure
87 <> < TEL
88
IT
 ディスクロージャー誌 IT 2016 2016 Sony Bank Disclosure 1 2 4 5 6 8 8 8 9 10 10 11 12 14 14 14 15 15 16 16 19 19 20 20 21 22 24 24 26 35 35 35 36 42 42 45 46 48 50 54 55 56 58 62 65 68 19 2 70 19 3 70 4 70 MONEYKit
IT
 IT 2017 2017 Sony Bank Interim Disclosure 1 2 3 4 5 6 8 15 15 15 16 22 22 25 26 29 30 34 35 36 38 45 19 2 53 19 3 53 4 53 MONEYKit PostPet PostPet Sony Network Communications Inc. President s Message 2
IT
 IT 2013 2013 Sony Bank Disclosure 1 2 4 5 6 8 9 10 11 12 14 15 18 19 19 20 20 21 22 25 26 27 28 29 30 31 32 34 36 47 47 47 48 56 56 60 61 64 66 70 71 72 77 82 87 192 92 193 92 4 92 MONEYKit PostPet PostPet
Sony Bank 11j_Master_IKM.indd
 2011 201161110 10 2011 2011 Sony Bank Disclosure 1 2 4 5 6 7 7 8 8 10 13 14 15 16 18 20 23 24 2010420117 25 26 27 30 41 41 41 42 50 50 54 54 58 60 64 65 66 71 76 82 83 84 86 19 2 87 19 3 87 MONEYKitMONEYKit
 2011610 IT 2012 2012 Sony Bank Interim Disclosure 1 2 3 3 4 6 8 9 9 10 11 14 16 25 25 25 26 33 33 37 37 41 42 46 47 48 53 19 2 58 19 3 58 4 58 MONEYKit PostPetPostPet So-net Entertainment Corporation President
AEGON Sony Life Insurance Co., Ltd.
 2017 AEGON Sony Life Insurance Co., Ltd. 2 4 5 5 2016 7 9 9 11 13 14 15 16 16 18 21 22 26 27 111 2017 7 AEGON Sony Life Insurance Co., Ltd. 1 2009 12 20 2016 EU 10 2016 5 10 20175 2 AEGON Sony Life Insurance
Sony Life Insurance Co., Ltd. 2017
 1... 082 1-01... 082 1-02... 083 2... 084 2-01... 084 2-02... 086... 086 3... 087 3-01... 087 3-02... 087 3-03... 088 1.... 088 2.... 088 3.... 088 3-04... 088 1.... 088 2.... 088 4... 088 5... 089 6...
参考資料 2015 年度業績の概要 2016 年 5 月 16 日ソニー銀行株式会社
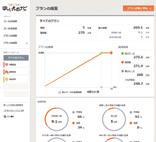
 参考資料 2015 年度業績の概要 2016 年 5 月 16 日ソニー銀行株式会社 損益の状況 (1): 財務会計ベース < 連結 > 業務粗利益前年度比 5 億円減少の 243 億円 住宅ローンは好調に推移したものの 債券売却益が減少 経常利益同 13 億円減少の 59 億円 新カードローンへの先行投資に係る営業経費の増加もあり 減益 連結 < 連結 単体 > 金額は億円未満切捨て % は四捨五入で表示

Sony Life Insurance Co., Ltd
 1... 082 1-01... 082 1-02... 083 2... 084 2-01... 084 2-02... 086... 086 3... 087 3-01... 087 3-02... 087 3-03... 088 1.... 088 2.... 088 3.... 088 3-04... 088 1.... 088 2.... 088 4... 088 5... 089 6...
untitled
 146,650 168,577 116,665 122,915 22,420 23,100 7,564 22,562 140,317 166,252 133,581 158,677 186 376 204 257 5,594 6,167 750 775 6,333 2,325 298 88 5,358 756 1,273 1,657 - - 23,905 23,923 1,749 489 1,309
,511,519 8,635,897 7,796,285 7,796,285 2,108,969 2,233,759 1,299,999 1,300,411 93,736 93, ,511,796 8,636,164 12,450 18,675
 2017 Index 110 112 112 115 119 120 121 123 123 124 109 27 28 8,511,519 8,635,897 7,796,285 7,796,285 2,108,969 2,233,759 1,299,999 1,300,411 93,736 93,736 277 267 277 267 8,511,796 8,636,164 12,450 18,675
We must not be afraid of change. 1 HAMASHIN REPORT 216
 We must not be afraid of change. 1 HAMASHIN REPORT 216 1 3 1 5 9 11 12 13 14 15 16 17 19 2 21 22 23 27 29 3 34 35 37 38 6 7 71 HAMASHIN REPORT 216 2 3 HAMASHIN REPORT 216 HAMASHIN REPORT 216 4 5 HAMASHIN
SFH P P P P SFH SFHSFH CSR At a Glance 042 SFH 100% 056 SFH 100% 058 SFH 100% SFH 061
 SFH P.001 039 P.040 059 P.060 211 P.212 215 SFH SFHSFH 001 3 008 010 016 1 018 CSR 021 041 At a Glance 042 SFH 100% 056 SFH 100% 058 SFH 100% SFH 061 SFH 2010 3 076 SFH 102 212 216 030 031 032 034SFH 035
Tier1 Tier2 Tier3 2,337, ,800 2,152, ,037 68, , ,030,638 1,588,892 11, ,311 98,897 38, ,052 6,272,260 1 A 6,27
 5225 1820 1. 323 78 2. 3. 30 236 Tier1 Tier2 Tier3 2,337,895 759,800 2,152,654 236,037 68,230 141,382 692 2,030,638 1,588,892 11,226 386,311 98,897 38,284 50 29,052 6,272,260 1 A 6,272,260 2 431,158 45
ゼリア新薬工業株式会社
 C O N T E N T S TOP INTERVIEW Q A Q A Q A 10.9 22.9 66.2 ZERIA Pharmaceutical Co.,Ltd. 1 TOP INTERVIEW Q A 2 ZERIA Pharmaceutical Co.,Ltd. ZERIA Pharmaceutical Co.,Ltd. 3 Q A Q A Q A Q A R&D III II I II
1
 浜松 信用 金庫 12 ディスクロージャー 表紙 オモテ 212 7.4 ANZ4E2 中村 33 43 デジコン 2 校 1 CONTENTS 1 3 4 CSR 5 7 CSR 9 1 1 11 12 13 15 16 17 19 21 22 24 25 27 29 32 6 74 2 3 24 514 24 423 54 1 2 23 829 533 1 4 5 C S R 21 FHA212
人生は長い だから すばらしい
 2 011 人生は長い だから すばらしい Contents 2 4 6 2010 6 2010 8 10 10 12 13 14 15 16 16 18 21 22 24 25 111 20117 2011 1 2010 年度の経済環境と業績動向 2010 2 2010 20104 7,696103.4%2010 13,833 192.1% ERM 今日から個人年金を人生年金に 変えていくのは私たちです
,500 NCD 4 1, CSR
 196 22 4 1 22 9 30 22 9 2012 2010 42013 3 2012 2010 42013 3 1 2 3 4 5 2012 210 2 6,500 NCD 4 1,000 1 2 4 CSR 6 6 7 8 8 10 12 1 15 16 17 18 20 21 22 9 30 11 187811 19 11 12 4 21 27 200 2,498 103282 85 28
イントロ
 2013 DISCLOSURE CONTENTS A W A B A N K 2 0 1 3 AWA BANK REPORT 2013 AWA BANK REPORT 2013 200 192 195 194 188 150 140 147 100 120 50 80 73 61 89 0 40 0 100 90 80 60 40 47 41 36 20 0 8,000 6,000 4,000
表紙.indd
 1 Contents 2 1 2 3 1. 2. 3. 1. 2. 3. 4. 3 255 113 368 248 111 359 247 111 358 243 109 352 240 110 350 1. 2. 3. 4. 5. 6. 7. 8. 9. 4 A. 業務純益 ( 単位 : 百万円 ) 1,500 1,355 1,335 1,151 1,000 570 500 0 17 18 19
 - 1 - - 2 - - 3 - - 4 - - 5 - - 6 - - 7 - - 8 - - 9 - 1 2-10 - - 11 - 3-12 - 4 13 2-13 - - 14 - - 15 - - 16 - 5-17 - - 18 - - 19 - - 20 - 6 7-21 - - 22 - - 23 - - 24 - 1 2 64-25 - - 26 - 4 5-27 - 6 7-28
STRENGTH Business Portfolio ALM 6 Sony Financial Holdings Inc. 2018
 STRENGTH Business Portfolio ALM 6 Sony Financial Holdings Inc. 2018 11Visa Sony Bank WALLET Sony Financial Holdings Inc. 2018 7 Consistently Strong GROWTH 1 5,036 668 SFH 3 31 1 2004 4 2007 10 1 ALM 2005
参考開示 米国会計原則に基づく主要業績数値について 2017 年 2 月 2 日ソニーフィナンシャルホールディングス株式会社 当社の親会社であるソニー株式会社 ( 以下 ソニー ) は 米国において一般に公正妥当と認められた会計基準による用語 様式および作成方法 ( 以下 米国会計原則 ) に基づい
 は 米国において一般に公正妥当と認められた会計基準による用語 様式および作成方法 ( 以下 米国会計原則 ) に基づい") 参考開示 米国会計原則に基づく主要業績数値について 2017 年 2 月 2 日ソニーフィナンシャルホールディングス株式会社 当社の親会社であるソニー株式会社 ( 以下 ソニー ) は 米国において一般に公正妥当と認められた会計基準による用語 様式および作成方法 ( 以下 米国会計原則 ) に基づいた連結決算開示を行っておりますが その中で当社グループを含むソニーグループの金融分野にかかる米国会計原則に基づく財務情報が開示されております
参考開示 米国会計原則に基づく主要業績数値について 2017 年 2 月 2 日ソニーフィナンシャルホールディングス株式会社 当社の親会社であるソニー株式会社 ( 以下 ソニー ) は 米国において一般に公正妥当と認められた会計基準による用語 様式および作成方法 ( 以下 米国会計原則 ) に基づいた連結決算開示を行っておりますが その中で当社グループを含むソニーグループの金融分野にかかる米国会計原則に基づく財務情報が開示されております
untitled
 CONTENTS 002 004 006 27 008 27 011 PART 1 012 27 013 015 017 019 020 MCEV 023 027 PART 2 028 030 034 036 LiPSS 038 040 042 043 046 049 052 057 PART 3 058 ERM Enterprise Risk Management 060 061 064 067
7,447 1,384 1,62 6,886 1,474 1,79 23, 4,3 3,2 62% 66% 67% 14,334 2,859 2,142 1
 23 234124331 7,447 1,384 1,62 6,886 1,474 1,79 23, 4,3 3,2 62% 66% 67% 14,334 2,859 2,142 1 A Message from the President 23, 4,3 3,2 19,394 3,338 21,68 1,673 23, 1,931 3,494 846 2,738 1,39 4,349 854 3,392
Ⅳ ,428 3, ,431 3, , ,189 1,550 1,550 1,550 3,050 5,550 60,000 60,000 60, ,1
 Ⅳ 1 3,03224 112.3%3,039 3,2123,509998113 3,509121.7%4,213 1,1741,189 113.6%10,069 112.3%3,0311,633 1,20493.6% 3,5081,013 82.3% 3,688 72.6%14,918148.3%3,516 3,401743 22 3,039 4,213 3,032 3,212 2 2 4 3,509
自 Tier1 Tier2 Tier ,770, ,717,397 1,564, , , , ,372,500 1,169,353 10, ,590 25,938 38, ,650 6,701,9
 三井住友銀行 142 1819 30 自己資本比率に関する事項(連結)中間期ディスクロージャー誌 2013 170 自 Tier1 Tier2 Tier3 249 1,770,996 1 2,717,397 1,564,604 210,003 127,816 122,828 101 1,372,500 1,169,353 10,830 157,590 25,938 38,956 50 29,650
P. 2 P. 4 P. 5 P. 6 P. 7 P. 9 P P.11 P.13 P.15 P.16 P.17 P.17 P.18 P.20 P.21 P.23 P P P P P P P P.31
 201729 3 2017 5 15 P. 2 P. 4 P. 5 P. 6 P. 7 P. 9 P.10 2017 P.11 P.13 P.15 P.16 P.17 P.17 P.18 P.20 P.21 P.23 P.24 10 P.25 11 P.27 12 P.28 13 P.29 14 P.29 15 P.30 16 P.31 17 P.32 P.34 P.35 Copyright 2017
 2017 3 2017 5 18 Copyright 2017 JAPAN POST BANK CO., LTD. All All Rights Reserved. 1 1. 2017 3 2. 2018 3 2017 3 2018 3 3. Appendix BP SP TP LP GP GP GP Copyright 2017 JAPAN POST BANK CO., LTD. All All
untitled
 CONTENTS 002 004 006 26 008 26 011 PART 1 012 26 013 015 017 019 020 MCEV 023 027 PART 2 028 030 034 036 LiPSS 038 040 042 043 046 050 053 059 PART 3 060 ERMEnterprise Risk Management 062 063 066 069 073
,552,510 3,580,796 1,591,338 1,521,728 1,167,622 1,145, , ,396 4,040 7,095 2,542 3, ,687
 193 2 15 16 16 3 31 17 3 31 5,328,950 4,989,814 360,509 1,004,512 152,070 124,856 1,009,328 568,340 480,847 606,032 3,306,780 3,769,073 3,749 3,832 27,049,901 24,233,701 55,382,800 54,799,805 743,957 895,586
Sony Life Insurance Co., Ltd
 1... 80 1-01... 80 1-02... 81 2... 82 2-01... 82 2-02... 84... 84 3... 85 3-01... 85 3-02... 85 3-03... 86 1.... 86 2.... 86 3.... 86 3-04... 86 1.... 86 2.... 86 4... 87 5... 88 6... 89 6-01... 89 6-02...
untitled
 IT IT 2014 B to B B to C 10 IT IT IT (CDS) Electronic Commerce, e-commerce B to B (Business to Business) B to C (Business to Consumer) C to C (Consumer to Consumer) O2O (Online to Offline) IT IT IT IT
seiryo47_0623
 1 Top Message Q 1 259.2 4.1% 11.5 73.9% 11.3 73.6% 6.5 46.9% Top Message 2 Q 2 Q 3 5 4 3 25 45 35 25 2 1 15 2 12/3 13/3 14/3 15/3 3 Top Message Q 4 88.5 19.7% 17.7 53.7% 7.1 74.7% 18.1 34.5% Top Message
J 8 I 3,528, ,770, ,717,397 1,299, ,003 24, , Tier1 1,539,385 1,200,892 11, ,994 89,455 38, ,072 6,598,7
 142 1819 1. 138 78 2. 3. 30 269 J 8 I 3,528,445 243 1,770,996 1 2,717,397 1,299,484 210,003 24,330 139,425 94 Tier1 1,539,385 1,200,892 11,194 200,994 89,455 38,103 50 15,072 6,598,778 2 A 6,598,778 3
平成16年度中間決算の概要
 平成 25 年度 (26 年 3 月期 ) 中間決算の概要 平成 25 年 11 月 8 日 大光銀行 次 Ⅰ. 平成 25 年度 (26 年 3 月期 ) 中間決算の概要 1. 損益状況 (1) コア業務純益 (2) 経常利益 (3) 中間純利益 2. 業務計数 (1) 貸出金 (2) 預金 預り資産 3. 不良債権 4. 自己資本比率 1 2 3 4 5 6 7 Ⅱ. 平成 25 年度 (26
Sony Life Insurance Co., Ltd
 1... 088 1-01... 088 1-02... 089 2... 090 2-01... 090 2-02... 092... 092 3... 093 3-01... 093 3-02... 093 3-03... 094 1.... 094 2.... 094 3.... 094 3-04... 094 1.... 094 2.... 094 4... 094 5... 095 6...
自 , ,296, 三井住友銀行203 己資本比率に関する事項(単体)三井住友フィナンシャルグループ
三井住友フィナンシャルグループ") 三井住友銀行自己資本比率に関する事項(単体 30 Tier1 Tier2 249 1,770,996 1 1,771,043 710,229 1,472,891 1,181,064 210,003 127,816 38,956 50 49,389 6,480,059 2 A 6,480,059 3 308,827 1,169,353 45 98,288 45 29,384 2,254,900 4 114,438
三井住友銀行自己資本比率に関する事項(単体 30 Tier1 Tier2 249 1,770,996 1 1,771,043 710,229 1,472,891 1,181,064 210,003 127,816 38,956 50 49,389 6,480,059 2 A 6,480,059 3 308,827 1,169,353 45 98,288 45 29,384 2,254,900 4 114,438
, ,377 5,378 4,916 21,000 21, , ,447 1,596,376 1,744,103 9,346 8,471 52,372 51,685 1,709 1,
 2018 2019 3 31 287,752 344,377 5,378 4,916 21,000 21,937 672,244 694,447 1,596,376 1,744,103 9,346 8,471 52,372 51,685 1,709 1,633 658 628 0 1,051 1,004 5,652 6,903 5,637 6,888 14 14 138 1,305 806 903
P. 2 P. 4 P. 5 P. 6 P. 7 P. 9 P.10 P.12 P.13 P.14 P.14 P.15 P.17 P.18 P.20 P P P P P.25 P.27 P.28 Copyright 2016 JAPAN POST BA
 201729 3 1 2016 8 12 P. 2 P. 4 P. 5 P. 6 P. 7 P. 9 P.10 P.12 P.13 P.14 P.14 P.15 P.17 P.18 P.20 P.21 10 P.22 11 P.23 12 P.24 13 P.25 P.27 P.28 Copyright 2016 JAPAN POST BANK CO., LTD. All Rights Reserved.
P. 2 P. 4 P. 5 P. 6 P. 7 P. 9 P P.11 P.14 P.15 P.16 P.16 P.17 P.19 P.20 P.22 P P P P P P P P P
 201628 3 2016 5 13 P. 2 P. 4 P. 5 P. 6 P. 7 P. 9 P.10 2016 P.11 P.14 P.15 P.16 P.16 P.17 P.19 P.20 P.22 P.23 10 P.24 11 P.26 12 P.27 13 P.28 14 P.28 15 P.29 16 P.30 17 P.31 P.33 P.34 Copyright 2016 JAPAN

2015 年 3 月期決算参考資料 2015 年 5 月 12 日株式会社ジャパンネット銀行
 2015 年 3 月期決算参考資料 2015 年 5 月 12 日株式会社ジャパンネット銀行 http://www.japannetbank.co.jp/ 1. 損益の状況 経常収益は 前期比 8 億円の増収となるも 経常費用が前期比 22 億円増加 結果 経常利益は 32 億円の前期比 14 億円減益となり 増収減益 経常収益 ( 単位 : 百万円 単位未満切捨て ) (B)-(A) 増減率 22,480
23回会社説明会資料(HP用)
") FFG Part FFG 09 09 1 20074 Core Core Bank Bank 170 50 32 12 68 IT 4050 4050 Core Core Value Value Part Part 2006 3 06/3 06/12 06/3 30.0% 4.5% 25.5% 26.2% 0.7% 47,500 6,300 41,200 42,200
FFG Part FFG 09 09 1 20074 Core Core Bank Bank 170 50 32 12 68 IT 4050 4050 Core Core Value Value Part Part 2006 3 06/3 06/12 06/3 30.0% 4.5% 25.5% 26.2% 0.7% 47,500 6,300 41,200 42,200
従業員の状況 株式の状況 45
 コーポレートデータ スルガ銀行グループの事業の内容 当社グループは 当社ならびに連結子会社 9 社および持分法適用関連会社 1 社で構成され 銀行業務を中心に 貸金業務 保証業務 リース業務などの金融サービスに係る事業を行なっております 当社グループの事業に係る位置づけは次のとおりであります 銀行業務 当社の本店ほか支店等においては 預金業務 貸出業務 内国為替業務 外国為替業務 証券 投資信託 保険の窓口販売業務を行ない
1 Copyright 2017 JAPAN POST INSURANCE Co.,Ltd. All Rights Reserved. 1
 2017 3 2017 5 23 1 Copyright 2017 JAPAN POST INSURANCE Co.,Ltd. All Rights Reserved. 1 2017 3 2016 10 100 (2016/4 2016/9) (2016/10 2017/3) 2016/4 (1,300 2,000) 2016/8 ( 1.5% 1.0%) 2017/2 (2017/4) ( 1.0%
UFJ
 UFJ UFJ () UFJ UFJ 2002 7 2 82 UFJ 2002 9 UFJ 2002 7 22 83 84 UFJ 1 2 3 4 1 2 16 15 14 90 6 5 2002 7 22 85 UFJ 1 2 DC 1 2 3 4 3 2 1 3 2 1 2 1 2002 7 22 UFJ 2002 7 22 CEO 188 2 7 2 UFJ UFJ p 86 p 18 1 2002
01
 01 02 Message from President 03 Key Indicators 04 Topics 05 06 Topics 07 WFP 08 Consolidated Financial Statements 09 ( ) ( ) ( ) 10 Non-Consolidated Financial Statements 11 12 Stock Information 13 14 Corporate
21322* IR * 2 * 1 *1 *2 *3 IRIR *4 *5 *6 *7 *8 * 4 * 3 * 7 * 3 FATCA VBI VBI M&A M&A * 4 * 7 * 5 ALM * 9 * 8 * 8 * 6
 213 25121 6 J. J.C. M. 3 22 VBI 211 1 J.C. 21322*9 25126 IR * 2 * 1 *1 *2 *3 IRIR *4 *5 *6 *7 *8 * 4 * 3 * 7 * 3 FATCA VBI VBI M&A M&A * 4 * 7 * 5 ALM * 9 * 8 * 8 * 6 2312 3 213 6 13 5 15 4 16 2 4 5 9
text.dvi
 Abstract JP Morgan CreditMetrics (1) () (3) (4) 1 3 3 4 4 5 10 6 16 1 1 BIS 1 3 1 BIS 1 BIS 1 3 ALM (1) Value at Risk () (3) RAROC (Risk Ajusted Return On Capital) (4) 3 5 6 31 99% (= p ) ~x X Prf~x Xg
CONTENTS CSR
 浜松信用 金庫 1 ディスクロージャー 表紙オモテ 21 7.8 132 L5 59925 9ABFPD 矢部 はましんは おかげさまで 平成22年4月に 創立6周年を迎えました 33 431 再校刷 創立 6 周年記念ロゴデザインについて はましんのコーポレートカラーを使ったハー トの形で お客様へ感謝の気持ちを表現 中 心にはましんイメージキャラクター はまた っち を配置しています 当金庫が
株式会社神奈川銀行
 主要な経営指標等の推移 単体 18 19 20 10,735 11,626 10,984 10,150 10,149 2,350 1,400 743 1,773 1,026 1,682 1,016 307 1,291 643 5,191 5,191 5,191 5,191 5,191 4,474 4,474 4,474 4,474 (4,474) 23,739 23,438 22,769 22,060
2015 年度第 3 四半期決算参考資料 2016 年 1 月 26 日株式会社ジャパンネット銀行
 2015 年度第 3 四半期決算参考資料 2016 年 1 月 26 日株式会社ジャパンネット銀行 http://www.japannetbank.co.jp/ 1. 損益の状況 経常収益は前年同期比 15 億円の増加 経常費用は前年同期比 10 億円の増加結果 経常利益は前年同期比 5 億円増加の 30 億円となり 増収増益 平成 26 年平成 27 年 ( 単位 : 百万円 単位未満切捨て )
 D I S C L O S U R E 23 Value Create Program 25 4 28 3 C O N T E N T S 2 7 8 2 5 8 22 23 25 27 28 3 3 32 35 36 37 38 39 4 42 44 53 56 57 8 22,498 25 4 24 5 5 29 6 3 8 7 9 56 9 7 9 26 2 79 8 8 3 8 8 8 23
untitled
 215 7 7 72 9 9 91 92 92 94 96 126 129 13 131 133 133 134 136 137 137 141 141 143 144 146 15 153 166 167 169 169 17 3 174 218 22 224 69 215 7 26 2733127 179912 191 ALM 1 1 1 1 26 397,394 73,82 67,873 81,368
ntv AR05 new/J
 Financial Section 24 25 34 34 34 36 37 38 39 43 44 56 23 1999 2000 2001 2002 2003 2004 328,013 352,409 358,682 336,299 328,374 357,614 203,862 207,743 218,888 215,180 217,844 245,109 54,350 67,302 63,573
年次報告書2008年3月期
 Reliability in a Challenging Environment Creating Value for Clients Creating Value for Business Partners Creating Value for Society ORIX is generating medium- and long-term growth by enabling value creation
2 4 8 UFJ24 1 14 24 UFJ 3 CS 32 IT 34 37 ALM 57 58 243 59 66 69 9 92 94 117 UFJ 117 UFJ 153 UFJ 29 259 264 215229
 UFJ 24 2 4 8 UFJ24 1 14 24 UFJ 3 CS 32 IT 34 37 ALM 57 58 243 59 66 69 9 92 94 117 UFJ 117 UFJ 153 UFJ 29 259 264 215229 24UFJ 247 UFJ UFJ UFJ UFJ UFJ 22 3 23 3 24 3 UFJ UFJ 13,629 13,715 11,982 1,641
7532_0512cj.pdf
 6 3 9 6 3 12 31 6 3 UFJ 1-8212 4 5 UFJ 171-858 7 7 UFJ 12-77-696 UFJ 26 25 7 125 12 31 http://www.donki.com/b/ir/ 12-86-449 24 2-6-1163-235 35. 3-5381-7532. 3-5381-766 http://www.donki.com P1 P2 P5 P7
 SMBC Group Report 2018 CEO CEO SMBC Group Report 2018 1 SMBC 4 SMBC 6 7 ESG 10 SMBC 12 CEO 20 22 CFO 27 28 30 32 34 36 38 40 42 SMBC SMBC Group Report 2018 IIRC 2013 12 SMBC Group Report 2018 CSR 2017
Cover Photo Greeting 2698 LED LED 16,4 1,6 Contents LED Love Christm
 Cover Photo Greeting 2698 LED LED 16,4 1,6 Contents... 2... 3... 5...... 8... 9... 11 LED324 18 19318319 3...13...14 1...15 2...1 26...19 Love Christmas26...21 138 3 2 2152 98 139 3 1 Matsuya Co., Ltd.
naka**.pdf‡Ì…R…s†[
 tansei.shareholders 50 2007.4.12007.9.30 Topics 1 2 Top Message 3 4 Speciality 5 6 Speciality 7 8 Works 9 10 Consolidated Financial Statements 11 12 Corporate Data 13 Stock Data 1,250 5.0 1,203 4.8 1,202
エネルギー業界における競争優位の
 16 2004 7 1 1 0.1 2000330 0.3 20044 500kW 7.0 2000 2004 2005 20054 50kW 17 2PPS 70,000 60,000 60,377 50,000 40,000 30,000 20,000 10,000 35,434 32,733 19,347 16,048 12,204 6,893 6,759 6,604 0 PPS 1,640
アニュアルレポート 2017
 2017 Financial Section 16 5 17 20 22 22 23 24 25 36 16 ISUZU MOTORS LIMITED 5 2017 2016 2015 2014 2013 2017 : 1,953,186 1,623,948 329,238 182,793 146,444 152,022 148,921 93,858 1,926,967 1,574,885 352,081
untitled
 83 01 01 02 07 09 10 170,356 114,020 56,335 40,058 16,276 4,036 221 20,091 33 461 19,663 7,472 12,190 331 12,521 202,821 135,705 67,115 43,675 23,440 3,460 450 26,451 537 487 26,501 9,801 16,700 68
1 2
 ( ) ( ) ( ) 1 2 59 2 21 24 275 43 3 26 486 103 27 28 98 105 104 99 1 48 25 29 72 14 33 11-10 3 11 8 14,663 4 8 1 6.0 8 1 0.7 11-6 27 19 22 71 5 12 22 12 1,356 6 4,397 3 4 11 8 9 5 10 27 17 6 12 22 9
,156,224 72,690,624 2,589,217 3,078,149 2,286,698 2,638, ,654 1,832,467 1,516,342 5,732,042 1,942,973 2,671,316 3,214,137 4,
 19 193 2118 193 2 18 19 19331 20331 4,036,856 5,017,325 1,107,078 595,802 76,551 357,075 2,276,894 1,940,170 963,916 1,153,070 3,277,885 4,123,611 2,924 7,329 20,537,500 23,517,501 58,689,322 62,144,874
Financial Highlights 7,92,326 9,287 7,38 3,994 93,438 2,27 3,28,84,97,8 26,336 8,8 8,27,243 77,99 23,72 49,676 4,7,992 9,429 7,48 3,939 9,67 3,82 37,2
 28 Financial Highlights 7,92,326 9,287 7,38 3,994 93,438 2,27 3,28,84,97,8 26,336 8,8 8,27,243 77,99 23,72 49,676 4,7,992 9,429 7,48 3,939 9,67 3,82 37,228,96 2,92 3,39,92 6,77 7,636 73,64 38,893,2 27,47
株式会社神奈川銀行
 19215 1933 2 自己資本の構成に関する事項 142 1819 25 連結自己資本比率 ( 国内基準 ) 平成 25 年度 25 1 17,842 9,292 8,712 50 111 61 1,579 1,579 31 32 41 51 683 712 20,106 2 44 44 47 25 20,106 3 226,000 223,909 1,414 82 44 82 82 1212
,420,877 1,229, ,064 38, ,927 41,475 4,393 4,454, ,010,575 1,420,877 57,773 1,386, ,454 2,741,632 1,262,135
 1932 17 18 18331 19331 7,107,469 4,036,856 651,905 1,107,078 117,474 76,551 1,956,650 2,276,894 633,760 963,916 4,078,025 3,277,885 2,912 2,924 25,505,861 20,537,500 57,267,203 58,689,322 947,744 881,436
SBI損保 ディスクロジャー 2010
 20 1 21 422 3 212.5%27 4 SBI IT SBI 1 1 3 1 38 2 4 3 4 4 5 5 6 6 6 7 7 2 5 3 1. 2. 3. 4. 5. 39 40 43 45 49 51 1 9 2 10 3 11 4 23 5 23 2 1 1. 2. 3. 4. 5. 52 55 57 58 59 6 24 7 24 8 25 2 60 3 60 4 60 5 61
 2007 2 3 4 6 15 15 16 18 20 21 22 23 57 59 2 2 42% 2007 2006 2005 2004 2003 200 160 120 80 40 0 118.1 116.1 129.6 137.7 111.7 2006 2005 2004 2003 200 160 120 80 40 0 154.1 156.9 178.3 188.9 2007 193.4
QX/..../IG/P1.`19/F
 President s Message (https://www.aozoraclub.com/ http://www.aozorabank.co.jp/ http://www.aozora-invest.co.jp/ (http://www.svb.com/) http://www.net-daibiki.com/ ... 34... 35...
*1和-1 共通(HD-ミライト) ホールディングス会社概要
 ホールディングス会社概要") Corporate Profile Corporate Slogan President s Message Corporate Philosophy Promise Solutions Engineering Support ICT Solutions Social Innovation Mobile Network Communications Infrastructure Environmental
Corporate Profile Corporate Slogan President s Message Corporate Philosophy Promise Solutions Engineering Support ICT Solutions Social Innovation Mobile Network Communications Infrastructure Environmental
Copyright 2017 JAPAN POST BANK CO., LTD. All Rights Reserved. 1
 Copyright 2017 JAPAN POST BANK CO., LTD. All Rights Reserved. 1 Copyright 2017 JAPAN POST BANK CO., LTD. All Rights Reserved. 2 60 50 40 30 20 10 0 20173 20183 Copyright 2017 JAPAN POST BANK CO., LTD.
0506jh.pdf
 6 3 9 6 3 12 31 6 3 1-8212 4 5 171-858 7 7 12-77-696 25 1 1 UFJ http://www.donki.com/ir/ 12-86-449 24 2-6-1163-235 35. 3-5381-7532. 3-5381-766 http://www.donki.com 25 24 7 125 6 3 P1 P3 P5 P6 P7 P9 P1
2010_真岡信組A-1-A.indd
 21 DISCLOSURE 2010 227 3 3 4 4 4.5 6 7 8 8 9 10 11 14 15 15.16 1720 21 22.23 2426 27 28 30 3032 3335 36 37 38.39 4,161 1,1001 100 200 400 1131 500 50 600 55 700 2 22331 131 27310 222 11,083 73,743 24,635

株式会社群馬銀行
 .定性的な開示事項1.連結の範囲に関する事項76ⅡⅡ. 定性的な開示事項 1. 連結の範囲に関する事項 (1) 自己資本比率告示第 3 条又は第 26 条に規定する連結自己資本比率を算出する対象となる会社の集団 ( 以下 連結グループ という ) に属する会社と連結財務諸表の用語 様式及び作成方法等に関する規則 ( 昭和 51 年大蔵省令第 28 号 以下 連結財務諸表規則 という ) に基づき連結の範囲に含まれる会社との相違点
2013BR_cover2_f
 41331 3 331 3 Business Report 212.4.1 213.3.31 33193 6727 168-63 84 41 41 12-782-31 http://www.smtb.jp/personal/agency/index.html IR http://www.wacom.com/jp/ja/investors 349-114811 TEL48-78-1211FAX48-78-122
19718 19973 19925 20001 20004 19984 19994 199112 ST 10,000 20,000 89 19988 200011 TPS PARK 24 ACHIEVEMENTS
 PARK 24 REPORT 2006 20051112006430 04 07 11 12 21 19718 19973 19925 20001 20004 19984 19994 199112 ST 10,000 20,000 89 19988 200011 TPS PARK 24 ACHIEVEMENTS SPC 20063 20064 200012 20019 40,000 60,000 20033
Top Message 2005116449 57.674841.3464 37.9 20% 25% 11001400 200611 72850480 20062 Financial Highlights 200241120200472012251 1 2
 Top Message 2005116449 57.674841.3464 37.9 20% 25% 11001400 200611 72850480 20062 Financial Highlights 200241120200472012251 1 2 4 Interview 3 Interview 2 17 1020 1 6 Interview 5 Interview 2030 100 4 Operations
2018
 2018 The Trust Bank Future Bloom 4 1 2 3 4 The Trust Bank 6 2018 1 P.4 4 6 7 P.8 8 10 12 20 24 IIRC ESG ESG 2017 4 2018 3 2018 4 2 2018 28 32 P.26 35 36 40 42 44 46 48 50 52 60 64 66 RAF 68 72 P.50 74
日立 統合報告書 2017 (2017年3月期)
") MANAGEMENT & 2017 6 01 1972 Bharat Forge Limited 1983 1994 1997 2016 02 1991 Alcan Inc. 1996 1998 2002 CEO 2007 Anglo American plc. CEO 2013 4 2013 03 2002 2010 2013 2014 2015 2017 04 1993 Emerson Electric
MANAGEMENT & 2017 6 01 1972 Bharat Forge Limited 1983 1994 1997 2016 02 1991 Alcan Inc. 1996 1998 2002 CEO 2007 Anglo American plc. CEO 2013 4 2013 03 2002 2010 2013 2014 2015 2017 04 1993 Emerson Electric
 ファイル名 :0101010_0805306972207.doc 更新日時 :2010/06/30 14:03 印刷日時 :2010/06/3014:05 事業内容の概要及び主要な経営指標等の推移 1 事業内容の概要当行グループは 親会社である株式会社三菱 UFJ フィナンシャル グループの下 当行 子会社および関連会社で構成され 銀行業務 その他 ( 金融商品取引業務 リース業務等 ) の金融サービスに係る事業を行っております
P. 2 P. 4 P. 5 P. 6 P. 7 P. 8 P. 9 P P.11 P.13 P.15 P.16 P.17 P.17 P.18 P.20 P.21 P.23 P P P P P P P.30 16
 2018303 2018 5 15 P. 2 P. 4 P. 5 P. 6 P. 7 P. 8 P. 9 P.10 2018 P.11 P.13 P.15 P.16 P.17 P.17 P.18 P.20 P.21 P.23 P.24 10 P.25 11 P.27 12 P.28 13 P.29 14 P.29 15 P.30 16 P.32 1 2 20172016 Copyright 2018
IT /
 Corporate Outline 212 1 2 3 4 6 9 1 11 12 13 15 16 18 22 23 24 IT / 26 28 32 36 38 4 41 42 43 44 45 &HLDGS. &HLDGS. 46,6 15,6 &HLDGS.1 4,8 1,7 プロフィール 185 164 196-188 1,64 8 5 2 4 2 3-14,5 173 176 26 486-469


 20 15 14.6 15.3 14.9 15.7 16.0 15.7 13.4 14.5 13.7 14.2 10 10 13 16 19 22 1 70,000 60,000 50,000 40,000 30,000 20,000 10,000 0 2,500 59,862 56,384 2,000 42,662 44,211 40,639 37,323 1,500 33,408 34,472

- 2 -
 - 2 - - 3 - (1) (2) (3) (1) - 4 - ~ - 5 - (2) - 6 - (1) (1) - 7 - - 8 - (i) (ii) (iii) (ii) (iii) (ii) 10 - 9 - (3) - 10 - (3) - 11 - - 12 - (1) - 13 - - 14 - (2) - 15 - - 16 - (3) - 17 - - 18 - (4) -
2 1980 8 4 4 4 4 4 3 4 2 4 4 2 4 6 0 0 6 4 2 4 1 2 2 1 4 4 4 2 3 3 3 4 3 4 4 4 4 2 5 5 2 4 4 4 0 3 3 0 9 10 10 9 1 1
 1 1979 6 24 3 4 4 4 4 3 4 4 2 3 4 4 6 0 0 6 2 4 4 4 3 0 0 3 3 3 4 3 2 4 3? 4 3 4 3 4 4 4 4 3 3 4 4 4 4 2 1 1 2 15 4 4 15 0 1 2 1980 8 4 4 4 4 4 3 4 2 4 4 2 4 6 0 0 6 4 2 4 1 2 2 1 4 4 4 2 3 3 3 4 3 4 4
 I? 3 1 3 1.1?................................. 3 1.2?............................... 3 1.3!................................... 3 2 4 2.1........................................ 4 2.2.......................................
1 (1) (2)
 (2)") 1 2 (1) (2) (3) 3-78 - 1 (1) (2) - 79 - i) ii) iii) (3) (4) (5) (6) - 80 - (7) (8) (9) (10) 2 (1) (2) (3) (4) i) - 81 - ii) (a) (b) 3 (1) (2) - 82 - - 83 - - 84 - - 85 - - 86 - (1) (2) (3) (4) (5) (6)
1 2 (1) (2) (3) 3-78 - 1 (1) (2) - 79 - i) ii) iii) (3) (4) (5) (6) - 80 - (7) (8) (9) (10) 2 (1) (2) (3) (4) i) - 81 - ii) (a) (b) 3 (1) (2) - 82 - - 83 - - 84 - - 85 - - 86 - (1) (2) (3) (4) (5) (6)
光学基金報告会資料 最終版.ppt
 2012 5 17 AIJ 2012/5/17 Oval Risk-Management Services Inc., All Rights Reserved 1 2012/5/17 Oval Risk-Management Services Inc., All Rights Reserved 2 22 No.93 2011 November 3 86 63 1 49 9 18 56
年次報告書2008年3月期
 P60 P107 3 1 3 2 3 12008 3 2 5 1 2008 3 78,592 290,743 227,020 23,521 128,616 88,445 16,756 300,361 1,154,054 78,592 105,465 227,020 23,521 15,747 7,389 16,756 129,885 1 604,375 106,140 185,278 112,869
Microsoft PowerPoint - 平成22年度決算の概要(Ver2)
") 平成 22 年度決算の概要 目次 1. 平成 22 年度損益の概況 ( 単体 ) 2 2. 総預金 個人預り資産の概要 ( 単体 ) 3 3. 貸出金の概要 ( 単体 ) 4 4. 信用保証協会保証付 個人向け貸出金 ( 単体 ) 5 5. 有価証券 ( 単体 ) 6 6. 利回り 自己資本比率 ( 単体 ) 7 7. 経費および経営効率 ( 単体 ) 8 8. 不良債権の状況 ( 単体 ) 9 9.
平成 22 年度決算の概要 目次 1. 平成 22 年度損益の概況 ( 単体 ) 2 2. 総預金 個人預り資産の概要 ( 単体 ) 3 3. 貸出金の概要 ( 単体 ) 4 4. 信用保証協会保証付 個人向け貸出金 ( 単体 ) 5 5. 有価証券 ( 単体 ) 6 6. 利回り 自己資本比率 ( 単体 ) 7 7. 経費および経営効率 ( 単体 ) 8 8. 不良債権の状況 ( 単体 ) 9 9.
1 Copyright 2017 JAPAN POST INSURANCE Co.,Ltd. All Rights Reserved. 1
 20183 2017 11 20 1 Copyright 2017 JAPAN POST INSURANCE Co.,Ltd. All Rights Reserved. 1 1956219 19794 20078 20126 20136 20137 20144 20156 20176 Copyright 2017 JAPAN POST INSURANCE Co.,Ltd. All Rights Reserved.