CONTENTS CEO CSR 3 31 IMSJPM 213 IMS Health IMS-JPM
|
|
|
- こうしろう かやぬま
- 5 years ago
- Views:
Transcription

1 Eyeing Further Specialization

2 CONTENTS CEO CSR 3 31 IMSJPM 213 IMS Health IMS-JPM
3
 35.3% 1 3, 4MR 211-213 211 213 1. 213 3D")
4 P.12 P % 2 1 No % 5.4% No % % 1.3 % , % 1 No.1( ) 35.3% 1 3, 4MR DMARDs IMS-JPM

5 mL P P. 6 CEO
6 /212 11,619 15,494 1,123 4,896 18,458 2,953 4,21 11,594 29,64 18,723 18,826 14,123 1,315 3,421 11,812 3,739 21,333 19,797 13,221 1,651 2, ,416 26,732 17,161 16,966 17,225 3,281 2, ,66 24,681 16,521 21,729 16,72 3,69 3,291 $ 1,265, , , ,36 177,777 38,368 34, % (7.7) (3.7) 28.1 (2.9) , , , , , ,99 198, , , ,88 $ 2,122,77 1,538 1,752,346.4% (19.).2 1 EPS , , , , , $ (.6)% (.6) 5.9. % % % ROE% DOE% , , , , , ,5 % 3 4 % 4 1,191 1,144 1,16 1,18 1,
7 EPS % DE EPS ROE 1 DOE 2, % 2 12 % 1 1,645 1,648 1,373 1,561 1, , ROE ROE ROE DOE 5 DOE 5% 5 % P.42 P.46 P.48 11
8 CEO CEO CEO


9 %1, % % CSO CEO ROEDOE DOE 5.1%6 5% DOE5% ,938,5 CEO
10 KANAME POC 1 DE-19 3 DE /2a DE DE DE Cyclokat 3 Cyclokat 3 1. Proof of Concept DE-117 EP2 DE-15 DE-9 DE-98 APO-1 Cyclokat DE-19 DE-12 Vekacia DE-111 DE-114 DE-85 DE-89 4 DE


11 4.3% % No.1 7.2% 95.5% 74.6% CEO


12 % % MR 1 MR No.1
13 CEO ISO NGO % , CSR CSR CSR CSR ISO26 2 CSR 22 CSR CSR
14 Eyeing Further Specialization Back-of-the-eye Diseases No.1
15 網膜疾患領域の市場ポテンシャル 高齢化などを背景として 網膜疾患領域市場は急速な成長を遂げています 後眼部領域には 滲出型加齢黄斑変性や 糖尿病に 起因する網膜症や黄斑浮腫など 未充足ニーズの高 い疾患が多く存在しており 世界中の患者さんが画期 特集 眼科における未充足領域への挑戦 後眼部領域に対する治療剤は少なく 有効な新薬が求められています えにくくなり 患者さんの QOL Quality of Life 生活 の質 を著しく低下させます 新生血管が発生 発育して 血液や滲出液が漏れ 的な新薬を待ち望んでいます また 海外市場に目を 出 す原因物質として VEGF が見 つ かっています 向けても 網膜疾患領域市場は未充足ニーズが高く VEGFは正常な血管を形成し 維持するために不可欠 各国で拡大を続けています このような観点からも な物質ですが 本来は必要のない血管を発生させるこ 当社の今後の成長において この市場が高いポテン とによって 滲出型加齢黄斑変性を引き起こします 滲出型加齢黄斑変性は 2 年前には有効な治療 シャルを有していると考えています 加齢黄斑変性とは 視力に最も重要な網膜の中心 方法がありませんでしたが その後 レーザー治療 に位置する黄斑部に異常が生じる疾患で 萎縮型と 抗体医薬 バイオ製剤など 治療法が飛躍的に進歩 滲出型に分類されます 滲出型の場合 黄斑部の網 しました 高齢化なども背景に 国内の網膜疾患領域 膜下で病的な新生血管が形成され 血液中の水分の 市場は年率約 2% の成長を示しており 医療用眼科 漏出等により網膜の破壊や機能障害が起こります 薬市場全体の約 1%を占めるに至っています そのため 視野の中心にある 一番見たいもの が見 滲出型加齢黄斑変性のメカニズム これらのイラストはイメージ図です 網膜でのイメージ 見え方のイメージ 新生血管 出血 黄斑 滲出型加齢黄斑変性では 黄斑部の網膜が 脈絡膜にある新生血管からの出血や 漏れ 出た血液中の水分により傷められ 中心部 網膜 正面から見た図 脈絡膜 横から見た図 に見えないところやゆがみが生じます Santen Pharmaceutical Co., Ltd. Annual Report

16 QOL Quality of Life 4 VEGF

17 QOL VEGF VEGF VEGF 4 2 QOL VEGF 3, 1, IMS-JPM Message 211 No.1 1 3,

18 VEGF

19 DE-19 SAKURA DE-19 SAKURA DE-12 BRVO 2 2/ Study Assessing double-masked Uveitis treatment 2. Branch Retinal Vein Occlusion Message VEGF2


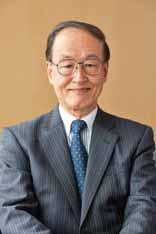
20 Research and Development CEO POC 1


21 213 4 CSO 1. Proof of Concept KANAME DE DE-118 DE-19 3 Cyclokat
22 1 2 3 DE DE DE DE DE-117 1/2a DE DE-9 MSD
23 DE DE DE-85 DE DE-9 2 NMDA MSD DE POC Proof of Concept DE-117 EP2 1/2a
24 1 2 3 DE-12 BRVO 1 2/3 DE Branch Retinal Vein Occlusion DE Cyclokat Vekacia Catioprost Cortiject 1/ DE
25 DE-12 BRVO 1 2/3 1. Branch Retinal Vein Occlusion DE DE DE DE-114 DE H Cyclokat 32 Vekacia 3 Catioprost F2 Cortiject DE-98 APO-1 2
26 , % %2, % % 1, , 3 2,269 2,349 2,474 2,549 2,734 2, , 35.3% VEGF 6
27 11.3% QOL Quality of Life 7.2% % % P2Y2 2 2.
28 2.8%948 35% % % % % %
29 % % % % H1 H1


30 , % EN1995 EN QOL EN EN 24 DMARDs % EN6.5% %.7% DMARDs39.7% DMARDs EN QOL Quality of Life 3


31 , % , % FX FX 4.8%64 59 PC % 21 79
32 , % % % %

33 MR 21 5 MR212 2% TOPICS No GMP 1 : 1. Good Manufacturing Practice


34 CSR CSR QOL Quality of Life: CSR QOL Quality of Life CSR CSR CSR 211 4CSR ISO26 1 CSR CSR CSR CSR CSR 1. ISO NGO
35 CSR CSR CSR 3ISO26 KPI CSR CSR CSR CSR CSRCSR Plan Do Check Action PDCA CSR CSR CSR ISO26 CSR 3 ISO CSR CSR CSR CSR CSR CSR CSR NPO NGO


36 MR 3 MR 1997 CSR


37 ISO NGO CO 2 t-co CSR CSR
38 213 6 CSR CEO
39 CSR
40 4 3 PDCA 1 BCM 1. P PlanD DoC CheckA Action

41 IR Message

42 213 8 CEO CSR CEO
43
44 2 98.1% 4.4%1, % %1, % 1, % 4.3% % % EN 1.1% 59.3%14 81 FX 4.8% % % 1 % ,81 111, ,336 17, ,981 93, ,874 9,987 (1.1) 1,481 3,642 (59.3) 6,474 4, ,256 2,57 (12.2) 2,246 2,558 (12.2) 1 12 (9.6) 119,66 114,
45 1,5 7.7% ,16 1,16 1,18 1,144 1, %2.7% 75 % % % % % % % 35.4%
46 3.7% % 13.9% 1EPS EPS % 8 4 1, ROA 8.9%8.3% 1, %66.4% ROA ROA % 2,5 2 1, % , , , , ,988 1, %82.6% 1 5.9% ,998.44ROE 1.7%1.% ROE ROE % 2, 2 1,252 1, , ,645 1, ,
47 ROE DOE DOE 5.% 11DOE 5.1% 1DOE 1 DOE % ,943 21,483 (11,54) (4,596) (1,273) 5,677 (21,557) (8,559) (12,998) 59,797 75,35 (15,238)
48 PL % % XE EN
49 1 7% PL
50 ,253 89,858 92,696 98,398 32,272 31,859 33,71 34,535 45,284 43,475 4,4 42,868 12,697 14,524 18,982 2, ,947 13,775 18,436 2,342 1,444 7,454 7,413 7,319 8,53 6,321 11,23 13,23 7,46 3,226 4,97 2,16 4,311 4,521 4,75 4,824 12,719 11,853 12,62 13, , , , , ,88 23,196 6,619 2,879 (9,951) 5,246 (2,97) (1,33) (6,57) (12,122) (12,712) (5,9) % ,431 91,231 82,735 93,893 4,85 37,237 32,676 3, ,148 15, ,98 15,458 23,47 12,686 6,882 5,614 97,126 13,5 18,24 118,637 ROE% ROA% % % PER DOE% ,74 87,963 86,659 86,751 2,5 2,335 2,38 2, =
51 ,486 13,394 11,619 11,594 11, , ,66 $1,265,987 35,484 36,513 35,947 34,71 34,437 35,385 41,51 441,267 44,59 46,51 5,178 46,244 45,636 52,299 52, ,293 2,412 2,371 15,494 29,64 3,739 26,732 24, , ,39 2,483 15,824 28,61 31,74 27,791 25, ,19 7,891 7,832 5,71 9,887 9,741 1,63 9,71 96,448 13,148 12,651 1,123 18,723 21,333 17,161 16, ,661 3,556 3,151 2,953 1,315 1,651 3,281 3,69 38,368 4,761 4,593 4,21 3,421 2,976 2,949 3,291 34,991 13,663 12,942 18,458 14,123 13,221 17,225 16,72 177, $ , , , , , , , ,959 15,468 11,849 26,11 17,768 21,483 9,943 $ 15,718 (5,846) (2,83) (5,619) (829) (7,676) (1,273) (4,596) (48,866) (5,691) (11,415) (11,373) (6,753) (1,57) (8,559) (21,557) (229,211) ,285. 3, ,82 12,754 11,53 118, ,668 14, ,583 $1,49,74 3,485 29,849 28,665 26,574 24,957 25,523 27,42 291, ,99 156, ,12 166, ,81 198,81 199,641 2,122,77 5,446 5, , , , , , ,99 164, ,88 1,752, ,825 86,867 86,916 86,992 87,53 87,147 82,469 2,49 2,483 2,69 2,756 2,867 3,53 3,5
52 ,797 75,35 $ 635, ,94 3,939 22, ,111 43,78 37, ,33 (2) (1) (2) 43,839 37, , ,949 17, , ,88 1,921 19,995 4,24 3,521 42, ,583 14,288 1,49, ,241 8,213 87,621 42,87 41,58 455,154 11,818 11, ,662 11,936 11,32 126, ,676 2,455 1,366 26,98 77,59 73, ,12 (5,89) (47,934) (532,571) 27,42 25, , ,158 12, ,7 5,936 5,82 63,118 6,768 5,942 71,961 1,42 1,134 15, ,46 6,5 47,425 2,88 1,2 3,618 39,638 32,99 421, , ,81 $2,122,77
53 ,266 8,75 $ 98, ,868 9,9 14,927 4,22 4,486 44, ,39 5,283 32, ,761 27,11 27, , , ,664 3,459 38, , ,269 1,996 24, ,76 1, ,727 7,498 6,514 79, ,59 33,94 366, ,,212 22,, 82,469, ,146,83 7,81 6,695 75, ,775 8,49 82, ,2 156,3 1,65, ,246 (2) (4) (27) 165,856 17,77 1,763, , ,416 (2,968) (6,37) (31,554) (1,48) (6,256) (11,138) , , ,861 1,755, , ,81 $2,122,77
54 ,66 114,416 11,812 $1,265,987 41,51 35,385 34, ,267 77,565 79,31 76, ,72 52,884 52,299 45, ,293 24,681 26,732 3, , , , (123) 977 (7) (23) (36) (74) 57 (15) 7 (15) (135) (19) 1 (19) ,549 25,592 27,791 31,74 272, ,98 9,912 9,97 84,86 1, (229) 12,362 9,71 1,63 9,741 96,448 16,521 17,161 21, ,661 16,521 17,161 21, ,661 16,521 17,161 21, , , (579) 19,869 3,339 (689) (957) 35,56 5,28 (195) (1,536) 55,375 21,729 16,966 19, ,36 21,729 16,966 19,797 $ 231, $
55 ,539 7, ,53 (4,958) 136 (4,661) (6,88) 21,333 (26) 659 4,982 (579) (957) ,615 7, ,578 (2) (443) (5,618) (8,79) 17,161 (2) 494 (689) ,695 8,49 156,3 (4) 51 (6,37) (8,469) 16,521 (13,738) (66) (13,8) 13,74 1,869 3,339 (23) ,81 7, ,2 (2) 1,92 (2,968) $71,185 $85,583 $1,659,15 $ (46) $ 547 $(67,6) $3,69 4,14 4,14 (9,45) 175,661 (146,76) (7,15) (139,81) 146,95 19,869 35,56 (238) $75,289 $82,672 $1,65,55 $ (27) $2,416 $(31,554) $3,452
56 ,592 27,791 31,74 $ 272,19 2,657 2,787 2,976 28, , ,987 (522) (529) (521) (5,55) (5,56) 1,37 (3,893) (59,112) (2,589) (3,294) (1,299) (27,527) 1,17 2, ,443 (1,79) 1 (11) (19,4) 19,786 3,219 29,243 21, ,661 (3) (17) (36) (35) (1,372) (9,268) (11,952) (11,283) 9,943 21,483 17,768 15,718 (3,69) (3,281) (1,651) (38,368) (4,883) (2,42) (4,296) (51,918) (87) (1,783) (5,873) (8,577) 4,68 7,632 3,922 49,748 (1,84) (7) (1) (18) (1) 15 (186) (4,596) (1,273) (7,676) (48,866) 259 (776) (13,763) (2) (26) (146,349) 5,641 (8,469) (8,76) (6,88) (9,44) ,182 (21,557) (8,559) (1,57) (229,211) 972 (98) (389) 1,336 (15,238) 2,553 8,133 (162,23) 75,35 72,482 64, ,825 59,797 75,35 72,482 $ 635,82
57 ,171 $ 6,251 6,195 (34) (2,32) (2) 1,955 (32) (119) 1,84 $
58
59
60 ,368 87,127 85, ,5 87,214 85,
61 i ii ,71318, , , $ 3,795 (57) 2, ,795 (1,27) (33) (1,926) 1, ,869 3,339 (689) 35,56 5,28 (195) $ 55,375
62 5. 1 Novasorb* Cyclokat Novasorb * % 1% 3 1,42126, ,727 1,955133, ,19575, ,171 14,247 12,446151,432 13,617165, ,134 2,32 28,227 2,66 32, ,17 75,
63 ,797 59,797 () 75,35 75,35 () 43,841 43,841 37,924 37, ,218 4,218 () 4,239 4,236 (3) 15,477 15,477 11,754 11,754 (9,266) (9,266) (8,75) (8,75) (9,868) (9,868) (9,9) (9,9) (3,39) (3,39) (5,283) (5,283)
64 213 $ 635,82 $ 635,798 $ (4) 466, , ,851 44,846 (5) 164, ,563 (98,525) (98,525) (14,927) (14,927) (32,39) (32,39) $4, $5, ,797 75,35 $ 635,82 $ 43,841 37, , , 2,2 3, ,265 23,392 15,724 2,2 116,878 5 $1,124,13 $23,
65 ,74 1,75 1 2,514 2,513 (1) 4,239 4,236 (3) 4,218 4,218 () 4,239 4,236 (3) 213 $18,119 $18,125 $ 6 26,732 26,721 (11) $44,851 $44,846 $ (5) ,12 15,61 3,49 4,43 5,195 1, (84) 7,628 6,556 (1,72) 12,512 15,477 2,965 11,674 11, $127,723 $16,135 $32,412 5,317 4,428 (889) $133,4 $164,563 $31, ,2143
66 $ 794 (15) $ % 3 5% ,73 14,672 $177, ,643 3,621 2,677 38,499 2,949 17,949 $222, $ 1 $ 1 $
67 $ $ 1 $ $ 4, ,6 1, $13, $ $ $ $1,538
68 $ $1, (17,372) (14,926) $(184,78) 11,53 1, ,517 (6,319) (4,64) (67,191) 2,655 1,181 28,228 (249) (223) (2,647) (3,913) (3,682) $ (41,61) $1, ,128 (28) (198) (195) (2,29) , ,865 2,312 2,21 1,962 $24, $ 553
69 % 2.% 2.% 2.% 2.% 2.% * * 1 1 1% 13. 5% 25% 1% ,551 16,4961, ,739146, ,938,5 667,15 13,8139,81 13,74146, ,123 43, ,3 114,5 12,5 168,
70 ,7 99,3 12,7 129, ,2 137,6 92, ,3 124,
71 ,5 12,5 168,4 156,8 99,3 124,3 28,8 57,6 52,8 9,8 124,3 114,5 91,7 11,8 14, 89, ,1 11, 3,7 9 21,3 62,1 28,4 7,8 38,9 2, ,315 3,23 3,17 2,92 2,734 3,5 3,838 3,616 3,531 4, ,715 2,48 1,743 1,176 3,698 3,61 3,435 * * , ,72177,77717,22513, % 4.4% 4.4%
72 % 4.4% 4.4% 2.8 (.3) (5.2) (.5) (.5).3 (.5) (5.1) (6.2) (4.3) (.7) % 38.2% 31.3% ,842 5,65 $ 62,112 2,562 2,633 27,239 1, , , , ,279 6, , ,837 1,419 19,528 14,192 14,178 15,9 (6,764) (5,683) (71,916) 7,428 8,495 78,984 (2,256) (1,98) (23,984) (1,57) (3) (11,242) (18) (32) (188) (26) (28) (278) (3,357) (2,7) (35,692) 4,71 6,425 $ 43,292
73 ,88 1,921 $ 19,995 4,46 6,5 47,425 (2,269) (1,996) (24,128) 4,71 6,425 $ 43, % % % , ,81 2, ,66 119, (114) 116,81 2,37 119,18 (114) 119,66 25,354 (673) 24,681 24,681 12,546 2, ,99 76, ,641 2,67 5 2,657 2, , ,243 5,243
74 ,846 2,57 114, , (113) 111,846 2, ,529 (113) 114,416 26, ,732 26,732 16,535 2,126 18,661 9,14 198,81 2, ,787 2, , ,971 15, ,576 2,236 11,812 11, (122) 18,576 2,358 11,934 (122) 11,812 3, ,739 3,739 9,67 1,814 91,881 92,92 184,81 2, ,976 2,976 2, ,187 2, $1,242,2 $23,985 $1,265,987 $ $1,265,987 1,213 1,213 (1,213) 1,242,2 25,198 1,267,2 (1,213) 1,265, ,583 (7,156) 262, ,427 1,281,722 25,985 1,37,77 815, 2,122,77 27, ,247 28,247 6,744 6,744 6,744 55, ,748 55,
75 ,981 93,62 9,797 $1,52,436 9,874 9,987 9,834 14,988 1,481 3,642 3,222 15,742 6,474 4,597 4,723 68,836 2,246 2,558 2,225 23, ,66 114,416 11,812 $1,265, ,712 95,374 92,549 $1,7,826 9,22 8,88 8,517 97, ,451 3,7 6,192 8,56 6,76 6,668 91, ,66 114,416 11,812 $1,265,987 22,56 21,157 2,939 $239,878 2,597 2,245 1,962 27, ,545 1,553 1,486 1,578 16,58 27,42 25,523 24,957 $291, ,486 23,297 21,465 $27,978 21,716 2,392 2,712 23,92 11,929 11,825 11, ,839
76 $ 19 $ $6, $6,744 5,936 5,82 $63,118 5,936 5,82 $63, , % 3,5 1%
77 1 CEO % CEO Santen Pharmaceutical Co.,Ltd. Annual Report 213Internal Control Report
78 KPMG AZSA LLC Santen Pharmaceutical Co., Ltd. Annual Report 213Independent Auditor s Report
79 URL A 25F TEL IR ir@santen.co.jp ,81 7, UFJ TEL ,51,93 82,469, %.% 1 1, , , , , UFJ 2, , RBC IST LONDON - LENDING ACCOUNT 1, % 44.6% 92.8% 9.%.9%.%.7%.5% 1.4% 4.6% 1, , , 4, 3, 2, 1, TOPIX 1 12, 8/4 9/4 1/4 11/4 12/4 13/4 1. TOPIX 9, 6, 3, 8/4 9/4 1/4 11/4 12/4 13/ ,34 3,195 3,445 3,655 4,99 2,46 2,694 2,731 2,778 3,


80 TEL FAX TEL FAX Niittyhaankatu 2, P.O. Box 33, FIN Tampere, Finland TEL FAX TEL FAX TEL FAX
81 A TEL FAX TEL FAX Santen Holdings U.S. Inc. 21 Powell Street, Suite 16, Emeryville, California 9468, U.S.A. Santen Inc. 21 Powell Street, Suite 16, Emeryville, California 9468, U.S.A. TEL FAX Advanced Vision Science, Inc Thornwood Drive, Goleta, California 93117, U.S.A. TEL FAX Santen Holdings EU B.V. Herikerbergweg 238, 111CM Amsterdam Zuidoost, Netherlands Santen Oy Niittyhaankatu 2, P.O. Box 33, FIN Tampere, Finland TEL FAX Santen S.A.S. 1 rue Pierre Fontaine, Genavenir IV, F-9158 Evry cedex, France TEL: FAX: Santen GmbH Erika-Mann-Strasse Munchen, Germany TEL FAX SantenPharma AB Santen Pharmaceutical (China) Co., Ltd. Solna torg 3, SE Solna, Sweden TEL FAX TEL FAX Santen Pharmaceutical Korea Co., Ltd. 3F C&K Tower, 35, Yeoksam-ro 25-gil, Gangnam-gu, Seoul, , Korea TEL FAX Taiwan Santen Pharmaceutical Co., Ltd TEL FAX Santen India Private Limited No. 216, Raheja Chambers, 12 Museum Road, Bangalore 56 1, India TEL: FAX: W3-126B TEL FAX


82 FX EN NE P
83 ISO141 SAIN % XE FX E FX V VEGF PC AL 27 a 28 4i
84 OFTAQUIX Printed in Japan
Eyeing the Next Stage
 Eyeing the Next Stage 2014 3 2014 Our Values CONTENTS 1 2 6 8 10 18 24 26 30 36 38 42 47 48 49 89 90 92 At a Glance CEO CSR 2014 3 12 3 31 IMSJPM 2014 IMS Health IMS-JPM 2009.4-2014.3 1 1. 1890 120 Santen
80% No.1 3... 1... 2... 5... 5... 9... 13... 14... 22... 22... 23... 24... 26... 27... 53... 54
 2005 2005 3 Looking ahead 80% No.1 3... 1... 2... 5... 5... 9... 13... 14... 22... 22... 23... 24... 26... 27... 53... 54 20052004 3 2005 3 2004 3 2005/2004 2005 3... 92,696 89,858 3.2% $ 863,175... 18,982
8% No
 Our vision... 24 24 3 8% No.1 3... 4 23-25... 6... 6... 8... 12... 14... 15... 16... 24... 25... 26... 28... 29... 53... 54... 55 for growth Santen Annual Report 24 1 for the future 2 Santen Annual Report
* Contents 1 2 CEO 4 CEO 5 : Reaching Out Globally 9 13 120 14 16 19 20 24 25 25 26 28 30 31 61 62 63 3 31 IMSJPM MIDAS 2006.1-2010.3
 2010 for the Future Reaching Out 2010 2010 3 * Contents 1 2 CEO 4 CEO 5 : Reaching Out Globally 9 13 120 14 16 19 20 24 25 25 26 28 30 31 61 62 63 3 31 IMSJPM MIDAS 2006.1-2010.3 3 31 2010 2009 2010/2009
4% P % 11.1%1, % %1, %1, % 3.5%1, % %1, % Santen Ph
 Financial Section 11 5 54 56 58 59 6 63 http://www.santen.co.jp/ja/ir/document/securities.jsp Santen Pharmaceutical Co., Ltd. Annual Report 215 49 4% 215 3 214 3 P.8 2 98.4% 11.1%1,592 62 12.6% 25 69 1.6%1,618
2004 3 1963 1 2 4 2004 MISUMI It s about TIME QCT 8 12 CSR 14 16 17 6 18 19 24 39 40
 2004 2004 3 MISUMI It s about TIME 2004 3 1963 1 2 4 2004 MISUMI It s about TIME QCT 8 12 CSR 14 16 17 6 18 19 24 39 40 MISUMI Corporation ANNUAL REPORT 2004 2003 32004 3.................................................
,889 99, , , ,031 8,952 13,261 16,443 14,464 17,948 % ,037 8,848 10,927
 2013 2013 3 3 313 31 2008 2009 2010 2011 2012 90,889 99,764 104,069 103,232 107,031 8,952 13,261 16,443 14,464 17,948 % 9.8 13.3 15.8 14.0 16.8 2,037 8,848 10,927 9,231 12,422 % 2.2 8.9 10.5 8.9 11.6 4,575
CONTENTS
 Annual Report 2017 CONTENTS Santen Pharmaceutical Co., Ltd. Annual Report 2017 1 Value Creation 2 Santen Pharmaceutical Co., Ltd. Annual Report 2017 Santen Pharmaceutical Co., Ltd. Annual Report 2017 3
1120再入稿_Ushio_ウシオ電機_53中期_株主通信.indd
 PRISM 2015 4 12015 9 30 2015 12 CONTENTS USHIO NOW! P 2 P 4 P 6 P 8 P10 P12 P14 USHIO NOW! 1964 No. 1 1964 3 19,556 2015 9 30 5,764 1,749 853 3,162 2015 4 12015 9 30 886 441 387 479 20 65 4 5 2 USHIO NOW!
ニコンレポート2016
 NIKON REPORT 216 216 216 3 1 2171 19171 216 3Next 1 - Transform to Grow 6 216 2171215 1 http://www.nikon.co.jp/profile/museum/ ABOUT NIKON 2 4 6 BUSINESS STRATEGY 8 9 14 16 BUSINESS PERFORMANCE 18 22 216
 100 3 100 Contents 2 4 6 8 12 UA 16 3 17 18 EC 20 22 24 26 30 32 38 5 44 11 46 2017 2017 IIRC 4 13 31 2017 3 IR www.united-arrows.co.jp/ir/lib/index.html P38 5 2 3 1 2 3 VISION VOICE VISUAL 1989 1995 2001
Kyowa_本文.indd
 2009 200810 5 9 11 13 14 19 21 39 1 2009 ................................................... 3 5 7.................. 9................ 10 2009 20097 P8 2008 Biokyowa 200941 20082008420093 200820081 122009

THE INTAGE WAY SDI 1964 SCI CONTENTS FEATURE 18 FEATURE INTAGE HOLDINGS Inc.
 Renovation and Innovation 2015 201532 55 THE INTAGE WAY 1960 196032 507 SDI 1964 SCI 1970 1960 1973 CONTENTS 02 04 06 12 12 14 15 16 FEATURE 18 FEATURE INTAGE HOLDINGS Inc. POS 20153 439 2015 2000 2001
Kumagai09-hi-2.indd
 CSR2009 CONTENTS 1 2 3 4 5 6 7 8 9 10 350 11 12 13 14 15 16 17 18 Do Check Action Plan 19 20 INPUT r r r r k k OUTPUT 21 22 Plan Action Check Do 23 24 25 26 27 28 16:50 7:30 8:00 8:30 9:30 10:00 18:00
13
 Pharmaceutical Segment 12 13 14 Pharmaceutical Segment 15 16 Pharmaceutical Segment 17 GERMANY CHINA JAPAN U.S.A. KOREA SINGAPORE 18 Pharmaceutical Segment 19 20 Pharmaceutical Segment 21 22 Pharmaceutical
 18725 136 2008 3 4 6 8 10 16 18 24 40 41 6 42 43 54 59 75 76 77 CSR 30 34 38 200620072008 3 4.27,235 26.9635 1.68.8 ROE2.69.2 1234.0 1 2006 2007 2008 2008/2007 2008 670,957 694,594 723,485 +4.2% $7,220,409
PREFACE: The Origins of Quality A I D A E n g i n e e r i n g, LT D.
 PREFACE: The Origins of Quality A I D A E n g i n e e r i n g, LT D. Manufacturing In the Age of The Environment NS1-1500(D) +LFL 200 188 100 wh 97 1 1.67 2 100 kw/h A n n u a l R e p o rt 2 0 1 0 1 PREFACE:
1 1,200m ,482,620m 1 323,825m 1 205,988m 114,988m 60,000m 31,000m ,837m ,158,795m ,340m 1 48,006m 1 33,016m 1,125m
 IV 39 7 10 167 1 3 9 2 10 79 1 1,200m 23 23 6 1 429 2,482,620m 1 323,825m 1 205,988m 114,988m 60,000m 31,000m 27 117,837m 3 2 426 2,158,795m 44 277,340m 1 48,006m 1 33,016m 1,125m 33,016m 4 14,990m 2 44
NIKON REPORT2018
 NIKON REPORT 218 218 218 3 Unlock the future with the power of light Unleashing the limitless possibilities of light. Striving to brighten the human experience. Focused, with purpose, on a better future
1) IT IR CSR 120 DAIWA SECURITIES GROUP ANNUAL REPORT 2010
 IT IR CSR 120 DAIWA SECURITIES GROUP ANNUAL REPORT 2010") p120 p126 p130 p131 p133 DAIWA SECURITIES GROUP ANNUAL REPORT 2010 119 1) 2010 7 1 IT IR CSR 120 DAIWA SECURITIES GROUP ANNUAL REPORT 2010 121 DAIWA SECURITIES GROUP ANNUAL REPORT 2010 CEO COO SMBC PI
p120 p126 p130 p131 p133 DAIWA SECURITIES GROUP ANNUAL REPORT 2010 119 1) 2010 7 1 IT IR CSR 120 DAIWA SECURITIES GROUP ANNUAL REPORT 2010 121 DAIWA SECURITIES GROUP ANNUAL REPORT 2010 CEO COO SMBC PI
ニコンレポート2017
 NIKON REPORT 217 217 217 3 Unlock the future with the power of light 217 7 251 1 1 1 217216 11 Unlock the future with the power of light 2 NIKON REPORT 217 BUSINESS STRATEGY 2 3 8 CFO 1 1 12 FAQ 13 TOPICS
サステナビリティ報告書
 Living and Working together for the common good. 1 Canon Sustainability Report 2003 Canon Sustainability Report 2003 2 3 Canon Sustainability Report 2003 Canon Sustainability Report 2003 4 93 94 95 96
Quality of Life Human Chemistry, Human Solutions Quality of Life Quality of Life HumanChemistry HumanSolutions ChemistrySol
 2006 CSR 2005 7519936Quality of Life 1020034 Human Chemistry, Human Solutions Quality of Life 1 2 3 Quality of Life 1 2 3 HumanChemistry HumanSolutions ChemistrySolutions21 Chemistry 1 TEIJIN CSR Report
010_9553901302406.indd
 2011 WDB REPORT CONTENTS 1 WDB Holdings co.,ltd. Annual Report 2011 2 WDB Holdings co.,ltd. Annual Report 2011 3 WDB Holdings co.,ltd. Annual Report 2011 4 WDB Holdings co.,ltd. Annual Report 2011 5 WDB
 138 2 4 121 3 31 1 2 8 1 12 1. 2. 3. 4. 5. 6. 14 16 18 22 24 26 1. 2. 3. 4. 5. 28 Sumitomo Trust and Banking 138 1 Q 21 2 2,5 2, 1,5 1, 1,611 1,962 2,154 2,168 2,411 1,2 1, 8 6 4 968 1, 1,38 823 5 2 79
Contributes to The Health of Individuals Worldwide
 ANNUAL REPORT 2008 Annual Report 2008 Our Contribution to Financial and Social Responsibility Contributes to The Health of Individuals Worldwide 2 4 10 16 17 20 22 29 30 32 37 38 40 47 54 64 66 70 102
-2-
 -1- -2- -3- -4- -5- -6- -7- -8- 10-9- -10-1 2 -11-1 1-12- -13- -14- Plan Do Check Action Check Action 1 -15- -16- -17- -18- -19- -20- -21- -22- 10 2 9 3 9 2 1 10 2 9 3 6 4 1 6 6 10 2 10 2 11 1 8 1 8 4
平成20年度内部評価実施結果報告書《本編》
 10 11 12 13 14 15 16 17 Plan Do Check Action 1 2 3 4 146 13 20 43 44 45 62 104 5 6 7 8 9 10 11 12 13 14 15 16 17 18 19 20 21 22 23 24 25 26 27 28 29 30 31 32 33 34 35 36 37 38 39 40 41 42 43 44 45 46 47
untitled
 1 1 2 3 2 1 ( 0) 2000 00 3 4 Check Action Do Plan 5 6 14001 5000 5000 1000 1000 7 8 9 10 2004 0.1 0.1 0.0 0.0 0.0 15.3 483.5 0.4 11 12 13 14 http://kankyou.pref.shizuoka.jp/seikan/seikanindex.htm 15 16
 http://www.softbank.co.jp/ The No.1 Name in Broadband ANNUAL REPORT 2003 Contents 2 4 The Reason why SOFTBANK is No.1 in the Broadband Market 12 13 54 55 21 1876 1941 1970 IT20 ADSL Yahoo! BB No.1 2003
untitled
 CONTENTS 1 2 4 6 8 10 11 12 14 15 16 17 18 19 20 21 22 23 24 27 28 29 30 31 32 33 Top Message 2 Daifuku Co., Ltd. CSR Report 2010 Daifuku Co., Ltd. CSR Report 2010 3 4 Daifuku Co., Ltd. CSR Report 2010
% 1,310 1, , % % , , , C
 1 2 3 311 % 1,310 1,409 102.0 107.5 1,455 103.3 2015 2016 2017 % 63 64 51 % 115 111 8.8 7.9 94 6.5 2015 2016 2017 1 1 1 1 1,117.23 1,081.49 1,019.68 Contents 01 03 07 09 15 2016 16 CSR 17 21 23 24 25 26
 1.... 1 1.1...1 1.2...2 2.... 3 2.1...3 2.2...3 2.3...4 2.4...5 3.... 6 3.1...6 3.2...19 3.3...20 4.... 22 4.1...22 4.2...23 4.3...23 4.4...24 4.5...34 4.6...34 4.7 PDCA...35 1. 1.1 2 261 46 26 JR 17 1
Quality of Life Human Chemistry, Human Solutions Quality of Life Quality of Life HumanChemistry HumanSolutions CSRCSR 1 2 C
 2007 CSR 2006 7519936Quality of Life 1020034 Human Chemistry, Human Solutions Quality of Life 1 2 3 Quality of Life 1 2 3 HumanChemistry HumanSolutions CSRCSR 1 2 CSR 3 CSR 4 5 6 7 CSR ChemistrySolutions21
CSR ERX ERX
 Corporate Report 2010 2010 3 100 1959 1 2 4 6 7 8 9 10 12 14 18 20 22 23 24 26 27 28 30 50 50 100 100 100 CSR 100 1960 1962 1 1969 1974 1985 1993 2003 ERX ERX 50 2009 Corporate Report 2010 1 50 100 50
Nikon アニュアルレポート 2000
 2000 1999 2000 371,801 305,765 $ 3,503 21.6% 18,434 ( 8,741) 174 7,770 (18,233) 73 21.01 (49.29) $ 0.20 5.00 3.00 0.05 66.7% 502,175 474,965 $ 4,731 5.7% 166,495 160,991 1,568 3.4% 1 2 3 4 5 6 NSR-S204B
02 CSR REPORT 09
 02 CSR REPORT 09 CSR REPORT 09 03 04 CSR REPORT 09 CSR REPORT 09 05 06 CSR REPORT 09 REPORT 01 CSR REPORT 09 07 REPORT 02 08 CSR REPORT 09 REPORT 03 CSR REPORT 09 09 MESSAGE 10 CSR REPORT 09 MESSAGE CSR

年 3 月期
 214 214 年 3 月期 1 巻頭特集 6 6 年間の主要財務指標 8 株主の皆様へ 12 特集グローバルサプライチェーン構築の取り組み モダニゼーション事業の状況 16 営業概況 25 CSR 28 コーポレート ガバナンス 3 取締役 監査役 執行役員 32 財務セクション 33 財政状態および経営成績の検討と分析 36 連結貸借対照表 38 連結損益計算書 39 連結包括利益計算書 4 連結株主資本等変動計算書
 1 20 2 26 4 28 6 30 10 32 12 33 14 74 75 1 2 0 6,000 7,000 5,000 4,000 3,000 2,000 1,000 2015 2012 2013 500 600 700 400 300 200 100 0 10 12 14 8 6 4 2 2015 2012 2013 2014 6,016 2014 6,252 2016 7.1 8.7
ITC_H1H4,H2H3_080728_last.indd
 CSR ACTION PLAN 9 ITOCHU Corporation CSR Report 008 ITOCHU Corporation CSR Report 008 0 CSR ACTION PLAN ITOCHU Corporation CSR Report 008 ITOCHU Corporation CSR Report 008 CSR ACTION PLAN ITOCHU Corporation
Profile 1927 12 1958 1969 PT MANDOM INDONESIA Tbk 1996 11 2 1978 7 27 1984 7 1 2 3 6 8 8 10 12 14 16 20 22 24 28 30 31 32 34 35
 MANDOM Corporation Annual Review 2005 Construct the Foundation for Next Growth Profile 1927 12 1958 1969 PT MANDOM INDONESIA Tbk 1996 11 2 1978 7 27 1984 7 1 2 3 6 8 8 10 12 14 16 20 22 24 28 30 31 32
電気・電子用RTVシリコーンゴム
 CONTENTS P3 P4-6 P7-9 P10-11 P12-25 P12-15 P16 P17 P18-19 P20-21 P22-23 P24 P25 P26-27 2 P28 P29 P30 P31 O Si O Si O Si Si O Si O O Si O Si Si O H C H H Si O O Si O O Si H C H H 3 Feature 1 Feature 2 Feature
アニュアルレポート2003
 ..................................... 1............................. 2 6 8 10 12 14............................ 16..................... 20.............................. 21.........................................
1. 2. 3. 4. 5. Contents The Asahi Kasei History... 1... 4... 5 Growth Action 21... 6... 12 At a Glance... 14... 16... 32 CSR... 36... 38... 39... 7...
 27 27 1. 2. 3. 4. 5. Contents The Asahi Kasei History... 1... 4... 5 Growth Action 21... 6... 12 At a Glance... 14... 16... 32 CSR... 36... 38... 39... 7... 72... 73 The Asahi Kasei History 1922 1931 199199
アニュアルレポート2004
 1 2 6 6 8 10 12 14 16 18 18 20 22 28 30 31 32 33 44 45 46 48 49 2004 2003 2002 2001 2000 2004 2004/2003 191,939 167,942 174,218 242,726 174,812 $1,810,745 14.3% 9,600 3,225 140 23,903 (4,628) 90,566 197.7

The Chain of Choice FC2008 FC Q&A Being the Chain of Choice for Franchise Owners FC FC Q A CSR
 Our Overriding Goal 2008 2008 2 01 02 03 04 12 The Chain of Choice FC2008 FC Q&A Being the Chain of Choice for Franchise Owners FC 18 21 22 24 26 27 71 72 73 2008FC Q A CSR The Chain of Choice FC CVS FC
磐田市水道事業ビジョン
 20162025 I w a t a C i t y W a t e r w o r k s V i s i o n C o n t e n t s 2009 2010 2011 2012 2013 2014 2015 2016 2017 2018 2019 2020 2021 2022 2023 2024 2025 2049 (H21) (H22) (H23) (H24) (H25) (H26)
95 SMBC
 94 CEO CIO S ( CEO ) 2002 6 26 95 SMBC 2002 6 26 2002 6 26 96 2002 7 1 97 2002 7 1 98 2002 7 1 100-8155 6 4 03 3243-2626 100-0011 2 2 03 3508-8111 102-0073 2 3 03 3221-9811 104-0028 8 1 03 3243-3811 104-0061
untitled
 27.4.1 s 28.3.31 31 8515 Vol.24 June 28 Top Message 283 1 16 4 17 5 Topics 18 CSR 7 19 1 2 12 21 21 4,574,99 321,63274 1 3 Top Message 2 4,112 33 317 2825 7 64%5% ROA1.5% 5, 1, 15, 2, 25, 3, 25,225 25/3
大和ハウスグループ アニュアルレポート2009
 CEO COO CFO 18 19 Dear Stakeholders Building a New Era with Heart 20 2008 4 2 3 Challenge 2010 2008 35.3% GDP 2008 1.1% 1 6,909 5 6 735 817.4% 398 5 535.0% 41 768.1% ROE 0.7%9.0% 1 24 22009 20207 9 1002055
fix_180824_小林製薬様_統合報告書2018_J_4C.indd
 2017 Contents 01 03 04 06 08 10 12 20 23 26 30 31 34 35 36 38 40 11 46 MD&A 48 50 56 57 ESG IIRC 01 Something New / Something Different SimpleClearSpeed 02 2017 2017100 35 03 1886 1970 1975 1894 10 1994
untitled
 ANNUAL REPORT 28 28 3 28 3 1. 1, 35.4% 2. 11.7% 8.1% 3. 17.9% 29.3% 4. Contents 2 4 6 1 12 14 7 1 16 1 18 2 28 3 2 21 22 23 & 24 CSR 26 28 29 57 58 59 Annual Report 28 1 2728 3 28 27 28 336,864 31,88 $

...j.N.. AR2005(.O..)
") 1984 expansion 1998 world 2001 2005 transformation FAST RETAILING CO., LTD. our group UNIQLO COMPTOIR DES COTONNIERS FOOT PARK ASPESI national standard Theory business model products Do you know?
1984 expansion 1998 world 2001 2005 transformation FAST RETAILING CO., LTD. our group UNIQLO COMPTOIR DES COTONNIERS FOOT PARK ASPESI national standard Theory business model products Do you know?
ニコン レポート 2014
 NIKON REPORT 2014 2014 20143 2014 20153 CSR CONTENTS 02 04 06 08 09 14 Next 100 - Transform to Grow 18 18 20 22 FPD 24 26 28 30 31 32 FOCUS CSR 34 CSR 36 38 39 41 42 CSR 44 46 48 52 57 58 60 61 01 P.67
SEIKO EPSON CORPORATION
 2004 Digital Image Innovation SEIKO EPSON CORPORATION SEIKO EPSON CORPORATION 1 2 SEIKO EPSON CORPORATION TFT 1 Print Image Matching SEIKO EPSON CORPORATION 3 4 SEIKO EPSON CORPORATION 15 10 10 9 9 18
日立 統合報告書 2017 (2017年3月期)
") MANAGEMENT & 2017 6 01 1972 Bharat Forge Limited 1983 1994 1997 2016 02 1991 Alcan Inc. 1996 1998 2002 CEO 2007 Anglo American plc. CEO 2013 4 2013 03 2002 2010 2013 2014 2015 2017 04 1993 Emerson Electric
MANAGEMENT & 2017 6 01 1972 Bharat Forge Limited 1983 1994 1997 2016 02 1991 Alcan Inc. 1996 1998 2002 CEO 2007 Anglo American plc. CEO 2013 4 2013 03 2002 2010 2013 2014 2015 2017 04 1993 Emerson Electric
【アニュアルレポート】
 Unparalleled Innovation and Customer Satisfaction For Local Communities in Japan and Increasingly Overseas 2012 2012 3 457 BIZ-e- 6 AA Yamato Holdings Co., LTD. 2 4 5 12 14 16 16 18 BIZ- 20 22 e- 24 26
Vision and Strategy IP 1 Fields: An Evolving History 5 9 11 Performance 17 18 At a Glance 20123 18 19 19 22 25 Sustainability CSR 27 32 Financial Sect
 We Make It Happen 2012 2011412012 331 Vision and Strategy IP 1 Fields: An Evolving History 5 9 11 Performance 17 18 At a Glance 20123 18 19 19 22 25 Sustainability CSR 27 32 Financial Section 39 49 51
1) 2011 7 1 104
 2011 7 1 104") P104 P110 P114 P115 P117 103 1) 2011 7 1 104 22011 7 1 CEO COO CFO CRO CIO 105 1) 2011 7 1 106 22011 7 1 107 108 1) 2011 7 1 109 22011 7 1 2011 7 1 100-6755 1 9 1 03 5555-7555 060-8601 3 7 011 214-6111
P104 P110 P114 P115 P117 103 1) 2011 7 1 104 22011 7 1 CEO COO CFO CRO CIO 105 1) 2011 7 1 106 22011 7 1 107 108 1) 2011 7 1 109 22011 7 1 2011 7 1 100-6755 1 9 1 03 5555-7555 060-8601 3 7 011 214-6111
...a.T.X 04_PDF.p
 2004 Sustainable Focus DAAM P19 P32 P42 P19 P41 P18 P16-17 P22 P23 4 21 KYOWA BIO-INNOVATOR 1. 2. 3. 4. 5. 6. 7. 8. 9. Kyowa Hakko Group s Sustainability Universe OUT CO2 SOx NOx IN OUT 2 MR IN OUT CONTENTS
KAITEKIレポート
 INDEX R e p o r t Corporate Social Responsibility 1 2 2011 3 11 MCHC 616 26 6 MCHCGood Chemistry for Tomorrow APTSIS 10 20253 Sustainability Health Comfort 3 MBA Master of Business Administration MOT Management
21322* IR * 2 * 1 *1 *2 *3 IRIR *4 *5 *6 *7 *8 * 4 * 3 * 7 * 3 FATCA VBI VBI M&A M&A * 4 * 7 * 5 ALM * 9 * 8 * 8 * 6
 213 25121 6 J. J.C. M. 3 22 VBI 211 1 J.C. 21322*9 25126 IR * 2 * 1 *1 *2 *3 IRIR *4 *5 *6 *7 *8 * 4 * 3 * 7 * 3 FATCA VBI VBI M&A M&A * 4 * 7 * 5 ALM * 9 * 8 * 8 * 6 2312 3 213 6 13 5 15 4 16 2 4 5 9

Traditional View The Red that You ve never seen CYAN : 10 MAGENTA : 100 YELLOW : ADK VISION VI Visual Identity ADK ADK Active Red Ac
 2014 2014 12 THE DIFFERENCE IN RED Traditional View The Red that You ve never seen CYAN : 10 MAGENTA : 100 YELLOW : 90 2013 ADK VISION 2020 2014 VI Visual Identity ADK ADK Active Red Active Red ADK BLACK
アニュアルレポート2008
 2008 2008 3 Moving Forward with the Global Subaru Identity page 2-7 page 8-15 page 16-17 page 18 page 19-21 page 22-23 page 24 page 25-33 page 34 page 35 Corporate Social Responsibility, CSR 9 1917 360
OVERVIEW Our Sustainability ALSOK 1 ALSOK 1 P P.12 3 P.26 4 ALSOK 8 P.9
 CSR REPORT 2013 CSR 2013 2331 OVERVIEW Our Sustainability ALSOK 1 ALSOK 1 P.10 2 7 2 P.12 3 P.26 4 ALSOK 8 P.9 ALSOK ALSOK CSR 5 P.8 6 6 P.19 7 3 4 P.18 5 8 P.20 ALSOK CSR Report 2013 1 OVERVIEW Our Corporate
Message 2012 CSR 02 03 04 08 10 12 14 16 18 20 22 23 5 Mission Vision 2 KAJIMA ROAD CSR REPORT 2012
 CSR 2012 Message 2012 CSR 02 03 04 08 10 12 14 16 18 20 22 23 5 Mission Vision 2 KAJIMA ROAD CSR REPORT 2012 CSR 1. 2. 3. 4. 1. 2. 3. 4. 5. 1. 2. 3. 4. KAJIMA ROAD CSR REPORT 2012 3 4 KAJIMA ROAD CSR REPORT
On the Cover SUV4WD SUV 4 MITSUBISHI MOTORS
 2006 2006 3 1 2 3 4 1 6 12 13 14 16 17 2 18 24 26 28 30 34 36 38 39 42 44 45 46 48 86 88 On the Cover SUV4WD1982 19912 19993 250 170 4 23 SUV 4 MITSUBISHI MOTORS CORPORATION ANNUAL REPORT 2006 MITSUBISHI
 26 1. 2. 3. 4. 5. Annual Report 26 1 C o n t e n t s... 2... 3 Growth Action 21... 4... 6... 11 At a Glance... 12... 14... 31... 32... 34... 35... 36 CSR... 38... 4... 41... 72... 74... 75 2 3 311 * 26
STQM STQMSANDEN WAY
 STQM STQMSANDEN WAY C O N T E N T S 2 3 4 5 6 7 8 9 10 11 12 13 1415 16 17 18 19 2021 22 23 2425 26 27 28 29 30 30 31 3233 3435 36 37 3839 4041 4 5 67% 30% 3% Sanden Global Network 6 25% 7 30% 8 9 10 11
Contents P. P. 1
 Contents P. P. 1 P. 2 TOP MESSAGE 3 4 P. P. 5 P. 6 7 8 9 P. P. P. P. P. 10 11 12 Economy P. P. 13 14 Economy P. 1,078 1,000 966 888 800 787 716 672 600 574 546 556 500 417 373 449 470 400 315 336 218 223
untitled
 2006 One Company 62,028372,669 WINWIN M&AOne Company 1997200610% 15%2010121,50010%ROE 11% 200532020063201231 2005.3 2006.3 2006.12 2006.12 % 92,492 9,373 10.1 6,105 2,290 3,524 3,956 2,944 5,636 105,665

ROE
 26 49 41 26 1,074 159 3 1,074 1,200 26 10 10 11 10 589 54.8% 159 26 10 10 11 10 86 54.1% 26... 1... 2... 2... 2... 3... 5... 6... 6... 7 ROE... 9... 10... 11... 11... 13... 14... 14... 15... 15... 16...
参考資料
 CO2 ( http://www.mext.go.jp/a_menu/shisetu/ecoschool/detail/1291993.htm ACTION CHECK PLAN DO 19 60 n=2,138 202 n=2,138 202 40 3020 20 17 7420 4320 25 30 55 25 C A B C 25 50 75 D 13 1,140 18 872 1990 210
ニコンCSR報告書2011 PDF詳細版
 Nikon CSR REPORT 2011 CSR2011 PDF : NIKON CORPORATION : 100-8331 1-12-1 TEL03-3214-5311 : : 1917725 : 654.75 20113 : 8,875.12 20113 6,776.61 20113 : 24,409 20113 5,306 20113 955,791 1,000,000 879,719 887,512
* ,195,393 1,269,415 $8,987,917 45,664 96, ,338 10,679 50,318 80,293 5,180 25,177 38,947 ** 1,193,011 1,240,008 8,970,008
 2002 2002 3 Breakthrough * 3 31 1 2002 2001 2002 1,195,393 1,269,415 $8,987,917 45,664 96,024 343,338 10,679 50,318 80,293 5,180 25,177 38,947 ** 1,193,011 1,240,008 8,970,008 ** 496,826 516,013 3,735,534
H 2O CONTENTS 2 3 6 7 8 9 10 11 13 14 14 1
 20096 H 2O CONTENTS 2 3 6 7 8 9 10 11 13 14 14 1 top message 2 3 12F 11F 10F 9F 8F 7F 6F 5F 4F 3F 2F 1F B1F B2F 4 5 topics 6 topics 7 topics 20095 8 20082008412009331 509,525 108.0% 364,028 108.8% 132,079
P001-052.indd
 Quality of Life 1 TEIJIN CSR Report 2014 2 TEIJIN CSR Report 2014 CONTENTS 3 5 9 15 21 23 25 26 28 37 38 41 42 29 30 34 35 36 43 44 45 49 50 51 52 http://www.teijin.co.jp/csr/ WEB 3 TEIJIN CSR Report 2014
 2004 2004 41 2005 331 Exceed Your Vision VisionExceed 14......................... 01... 04................. 08......................... 12............................. 14......................... 16........................
untitled
 High Performance Mass Flow Controller 45 45 s G H T W I A B C D E F G T D W I F E H+6 H SEC SEF -Z512KX SEC SEF -Z512 MG X SEC SEF -Z522 MG XN SEC SEF -Z532MGX N SEC SEF -Z542MGX N SEC SEF -Z552MGX
7532_05arj.pdf
 Don Quijote Evolving with Customers 25 25 P ROFILE 1989 1 24 DonQ 22 1725 6 C ONTENTS 2 4 7 14 33 35 Distinctive Advantages uijote 3 1,m 2 3 5m 2 24 3 1 U.S. 6 31 25 24 25 232,778 192,84 $2,14 1,814 1,611
 Creating for Tomorrow 214 214 CSR CSR 2 3 CSR 4 1 8 9 16 17 18 At a Glance 18 2 22 213213 4214 3 214 4 7 RC 9 7 8 GRI 3.1 ISO26 32 34 38 4 48 5 54 55 72 74 75 24 26 28 3 2 56 11 58 64 66 214 1 214 215
1. 8. Value Chain 10. At a Glance
 Annual Report 2007 1. 8. Value Chain 10. At a Glance 12. 14. 18. 23. 33. 41. 48. 49. 50. 51. HOUSING MARKET Market trends are not promising but there are many opportunities for our growth 1 () 128 127

mr_csr_10_0916_pdf.indd
 MITSUBISHI RAYON CO.,LTD. CSR MITSUBISHI RAYON GROUP CSR REPORT 2010 MMA AN20095MMA No.1 MMANo.1 No.1 MMA48.7135.6 2015 25 No.1 CO2 25% 22% 6% 10% 59% AN 1 We are everywhere.... 3 2 MMA... 5 3... 7...
アニュアルレポート 2014
 SoftBank Corp. ANNUAL REPORT 2014 053 The Fast Read CSR SoftBank Corp. ANNUAL REPORT 2014 054 The Fast Read CSR 2014 6 20 1981 9 1983 4 1986 2 1996 1 1996 7 2001 6 BB 2004 2 CEO 2004 7 2006 4 CEO 2006
215 GDP 215 % UFJ % UFJ GDP *
 5 211 212 213 214 215 82.19 94.5 12.92 12.17 112.68 35,2 36,342 37,534 42,29 41,432 18,45 18,168 18,786 21,816 21,135 969 951 1,84 1,114 1,17 9,642 1,422 11,63 13,86 13,25 2,255 2,882 3,62 3,529 3,63 3,747
2 3 4 5 6 7 8 9 10 12 14 17 20 23 26 28 29 30 32 33 34 35 2
 2 3 4 5 6 7 8 9 10 12 14 17 20 23 26 28 29 30 32 33 34 35 2 21 3 CO-GROWING HUMAN CONVINNOVATION 4 5 6 ISO14001 PDCA Plan Do Check Action Plan Do Check Action 7 a a a 8 9 10 input \ output \ DATA input
avex-Pages.indd
 Backstage Value Multiplier 21 9.4.1-1.3.31 Giving Life to a Blossoming Crescendo avex group 1 : 25 26 27 28 29 1 ORANGE RANGE EXILE 2 EXILE 3 Mr. Children B'z 4 SMAP EXILE B'z 5 KAT-TUN 6 EXILE KAT-TUN
10/17CII/CIIIJ
 Minebea Co., Ltd., 2002 1 56.0% 43.7% 2002 2001 2000 1999 1998 142.0 136.8 127.7 124.5 122.0 150 120 90 60 30 0 2002 156.3 2001 2000 1999 1998 180.9 157.6 146.1 151.9 200 160 120 80 40 0 2002 2001 2002/2001

正義感を持って世の中の 不 を解消しよう もっと何かできるはず
 217 231-8528 89-1 csr tel 45-226-1518 FaX 45-226-123 e-mail csr_promote@fancl.co.jp 正義感を持って世の中の 不 を解消しよう もっと何かできるはず 198 199 2 198 1985 1992 1996 2 215 1981 1993 1996 24 2 1 2 215 217 4 6 217 7 1982 1989
 44 48 2 3 5 kg/m 3 % (GPa) MPa GPa MPa m x -6 / W/(m K) J/(kg K) V/m cm (X -4 ) (X -4 ) JIS C24 JIS C24 JIS R6 JIS R6 JIS R62 JIS R67 JIS R68 JIS R6 JIS R6 JIS C24 A-479 99% White 3.8 3 5.2 3 36.23 3 4

EPSON Safety Instructions Manual
 1 2 3 4 5 6 7 8 9 10 11 12 13 14 15 16 < EUROPE, MIDDLE EAST & AFRICA > ALBANIA : ITD Sh.p.k. http://www.itd-al.com AUSTRIA : Epson Deutschland GmbH http://www.epson.at BELGIUM : Epson Europe B.V. Branch