日本化学療法学会雑誌第59巻第6号
|
|
|
- みいか えんの
- 9 years ago
- Views:
Transcription
1 Key words
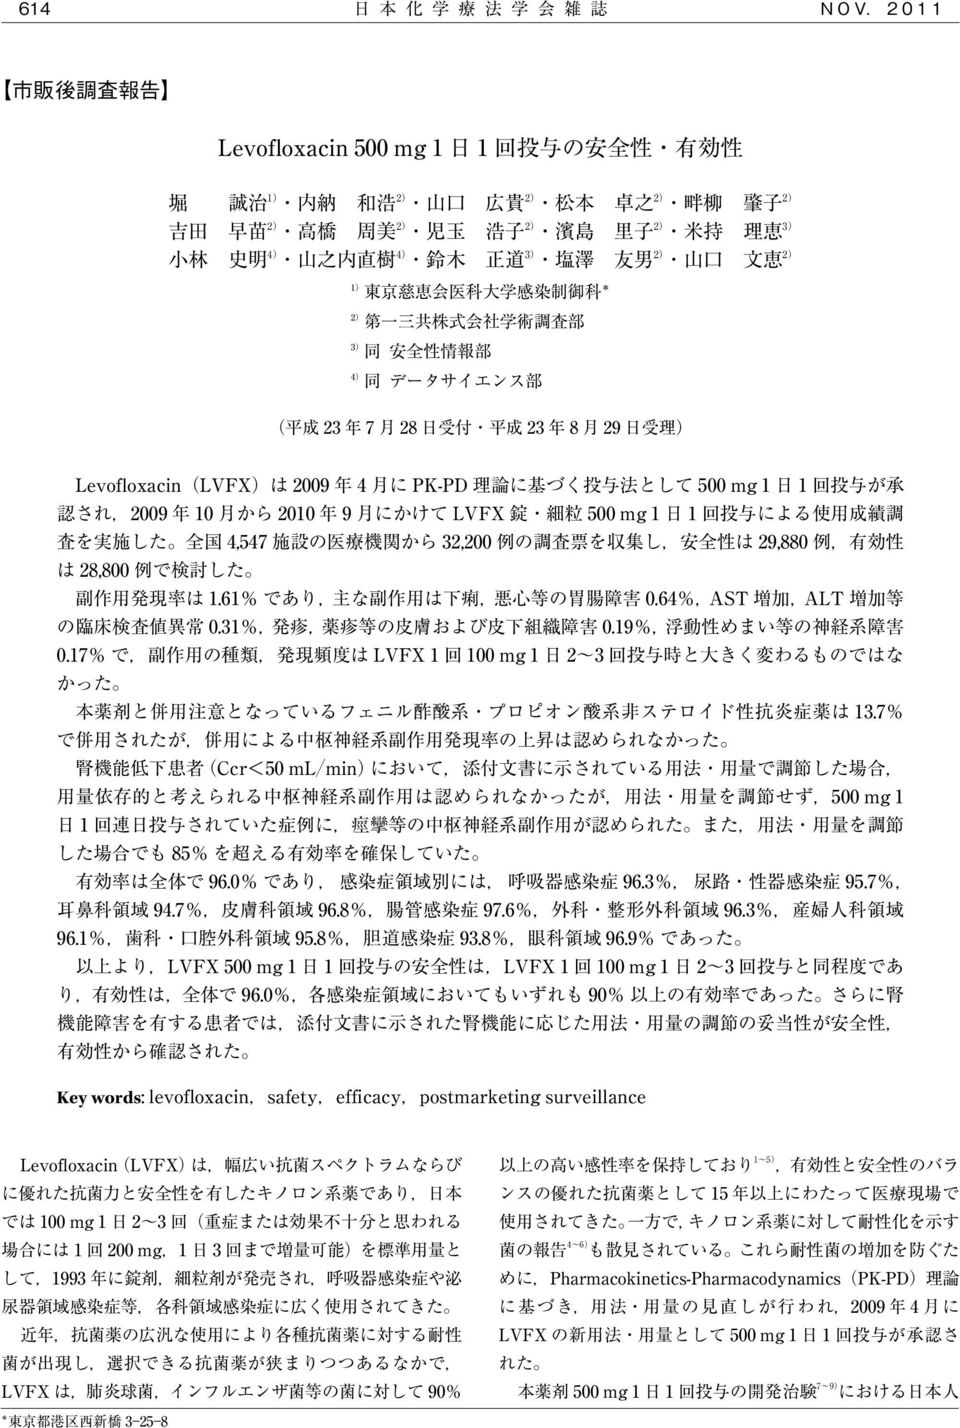
2 Survey forms collected: 32,200 Patients subject to safety analysis: 29,880 Excluded from safety analysis: 2,320 Reasons: Administration outside contract period: 6 Registered 8 days after the start of LVFX: 35 Different partients at entry: 7 Duplicated patients: 1 Patients taking LVFX 100 mg product: 16 LVFX not administered: 12 No information after LVFX administration: 2,210 Unrecorded or unclear adverse event evaluation: 33 Excluded from efficacy analysis: 1,080 Reasons: No infections: 64 Off-label use: 141 Multiple infections: 591 Inevaluable efficacy or not mentioned: 204 Pediatric cases: 70 Patients subject to efficacy evaluation: 28,800 Pregnant: 10 Fig. 1. Disposition of subjects. I

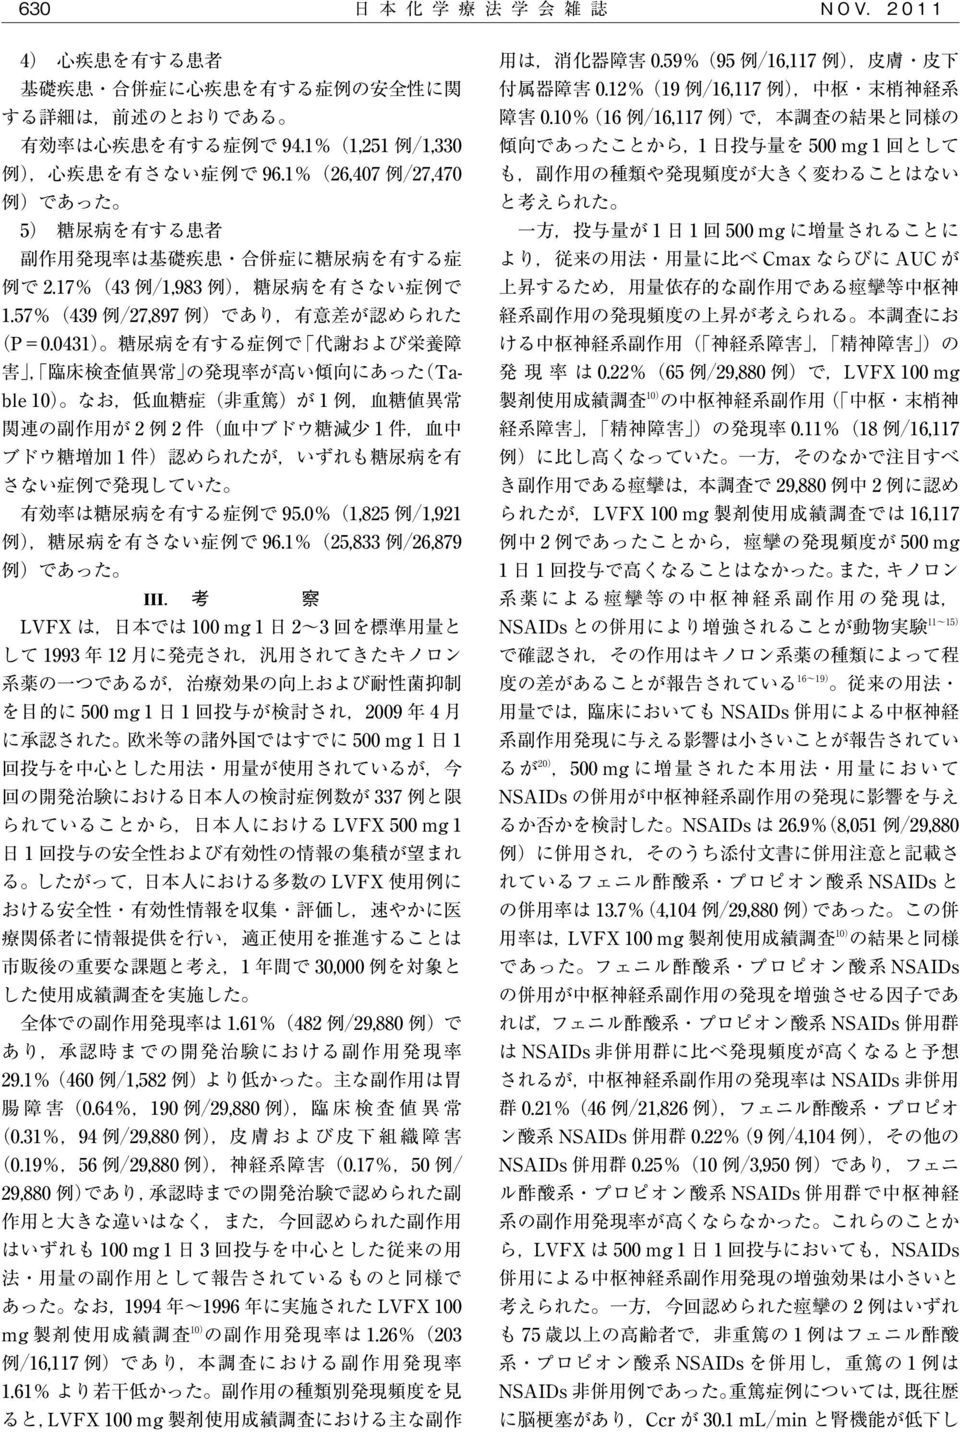
3 Table 1. Patients profiles in safety analysis Gender Age Inpatient/outpatient Types of infections Severity of infection Underlying disease (s) complications History of allergies Dose form Daily dose(1st day of administration) No. of days of administration Concomitant drug Item No. of patients (%) Male 12,833 (42.9%) Female 17,047 (57.1%) ( 0.2%) 15 to 65 18,898 (63.2%) 65 to 75 5,162 (17.3%) 75 5,748 (19.2%) Mean SD Minimum, Median, Maximum 7, 56, 109 Inpatient 1,996 ( 6.7%) Outpatient 27,883 (93.3%) Unclear/unrecorded 1 ( 0.0%) Respiratory tract infections 13,274 (44.4%) Urinary tract or genitals infectious disease 8,455 (28.3%) Obstetrics and gynecology area infections 396 ( 1.3%) Dermatological infections 1,501 ( 5.0%) Surgery and orthopedics department area infections 729 ( 2.4%) Biliary tract infections 115 ( 0.4%) Otorhinolaryngology area infections 2,454 ( 8.2%) Ophthalmology department area infections 132 ( 0.4%) Intestinal tract infections 1,282 ( 4.3%) Dental and oral surgical area infections 745 ( 2.5%) Other 797 ( 2.7%) Mild 15,508 (51.9%) Moderate 13,390 (44.8%) Severe 939 ( 3.1%) Unclear/unrecorded 43 ( 0.1%) No 16,478 (55.1%) Yes 13,402 (44.9%) Hepatic disease 655 ( 2.2%) Renal disease 392 ( 1.3%) Heart disease 1,380 ( 4.6%) Cerebrovascular disorder 1,108 ( 3.7%) Diabetes 1,983 ( 6.6%) Convulsive disease 124 ( 0.4%) Others 12,459 (41.7%) No 27,280 (91.3%) Yes 1,944 ( 6.5%) Unclear/unrecorded 658 ( 2.2%) Tablets 29,723 (99.5%) Fine granules 155 ( 0.5%) Unclear/unrecorded 2 ( 0.0%) 500 mg 28,724 (96.1%) 500 mg q.d 28,309 (94.7%) 250 mg b.i.d 415 ( 1.4%) 250 mg (250 mg q.d) 1,112 ( 3.7%) Others 44 ( 0.1%) 1 3 days 2,497 ( 8.4%) 4 7 days 20,798 (69.6%) 8 14 days 5,635 (18.9%) days 839 ( 2.8%) 30 days or longer 95 ( 0.3%) Unclear/unrecorded 16 ( 0.1%) Mean SD Minimum, Median, Maximum 1, 5, 250 No 7,506 (25.1%) Yes 22,374 (74.9%)
 75 5,748 (19.2%) Mean SD 54.5 19.9 Minimum, Median, Maximum 7, 56, 109 Inpatient 1,996 ( 6.7%) Outpatient 27,883 (93.3%) Unclear/unrecorded 1 ( 0.0%) Respiratory tract infections 13,274 (44.")
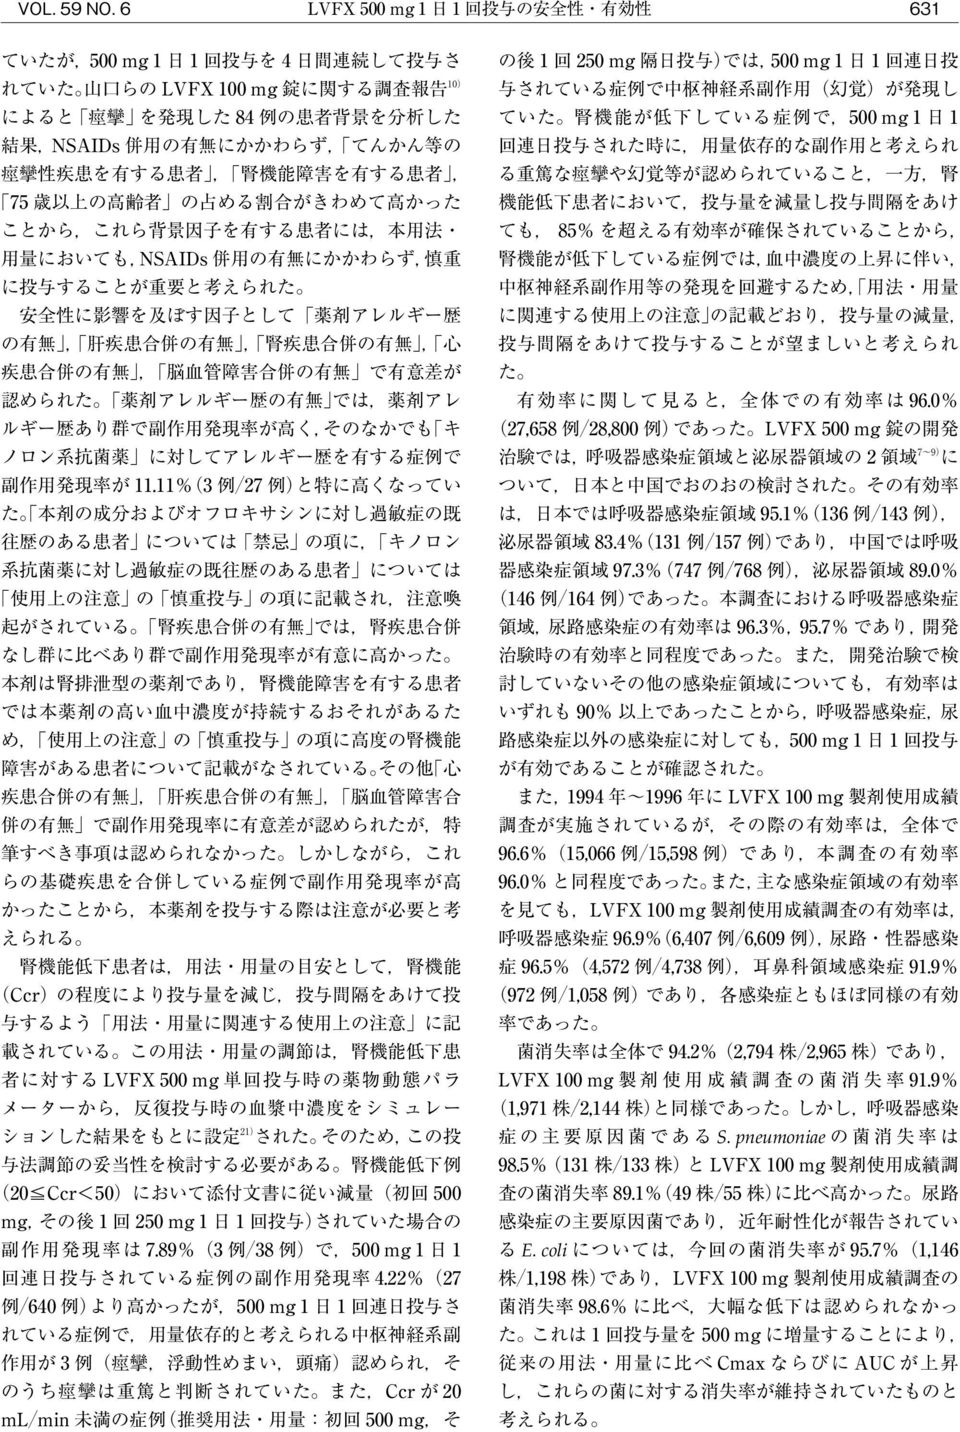
4 Table 2. Incidence of adverse drug reactions Item Studies conducted before approval Use-result survey Total Number of patients subject to safety analysis 1,582 29,880 31,462 No. of patients with ADRs No. of occurrences of ADRs ,352 Incidence of ADRs (%) Type of ADRs Incidence by type of ADRs (%) Infections and infestations 1 (0.06) 7 (0.02) 8 (0.03) Candidiasis 1 (0.00) 1 (0.00) Oral candidiasis 1 (0.00) 1 (0.00) Pneumonia 1 (0.00) 1 (0.00) Superinfection 1 (0.00) 1 (0.00) Urinary tract infection 1 (0.06) 1 (0.00) Vulvovaginal candidiasis 3 (0.01) 3 (0.01) Blood and lymphatic system disorders 2 (0.13) 5 (0.02) 7 (0.02) Anaemia 4 (0.01) 4 (0.01) Leukopenia 2 (0.13) 1 (0.00) 3 (0.01) Immune system disorders 2 (0.01) 2 (0.01) Anaphylactic shock 1 (0.00) 1 (0.00) Anaphylactoid reaction 1 (0.00) 1 (0.00) Metabolism and nutrition disorders 16 (1.01) 15 (0.05) 31 (0.10) Hyperkalaemia 1 (0.00) 1 (0.00) Hypoglycaemia 1 (0.00) 1 (0.00) Hypokalaemia 1 (0.00) 1 (0.00) Hyponatraemia 2 (0.01) 2 (0.01) Decreased appetite 16 (1.01) 10 (0.03) 26 (0.08) Psychiatric disorders 44 (2.78) 17 (0.06) 61 (0.19) Agitation 1 (0.06) 1 (0.00) Dysphoria 2 (0.01) 2 (0.01) Hallucination 2 (0.01) 2 (0.01) Initial insomnia 3 (0.19) 2 (0.01) 5 (0.02) Insomnia 37 (2.34) 10 (0.03) 47 (0.15) Sleep disorder 1 (0.00) 1 (0.00) Affect lability 1 (0.06) 1 (0.00) Dyssomnia 2 (0.13) 2 (0.01) Nervous system disorders 92 (5.82) 50 (0.17) 142 (0.45) Ageusia 1 (0.00) 1 (0.00) Convulsion 2 (0.01) 2 (0.01) Depressed level of consciousness 1 (0.00) 1 (0.00) Dizziness 59 (3.73) 24 (0.08) 83 (0.26) Dysgeusia 4 (0.25) 2 (0.01) 6 (0.02) Headache 23 (1.45) 9 (0.03) 32 (0.10) Hypoaesthesia 4 (0.25) 3 (0.01) 7 (0.02) Mental impairment 3 (0.19) 3 (0.01) Nervous system disorder 1 (0.00) 1 (0.00) Somnolence 6 (0.38) 5 (0.02) 11 (0.03) Syncope 1 (0.06) 1 (0.00) 2 (0.01) Tremor 3 (0.19) 3 (0.01) 6 (0.02) Poor quality sleep 8 (0.51) 8 (0.03) (Continued)
 Vulvovaginal candidiasis 3 (0.01) 3 (0.01) Blood and lymphatic system disorders 2 (0.13) 5 (0.02) 7 (0.02) Anaemia 4 (0.01) 4 (0.01) Leukopenia 2 (0.13) 1 (0.00) 3 (0.")
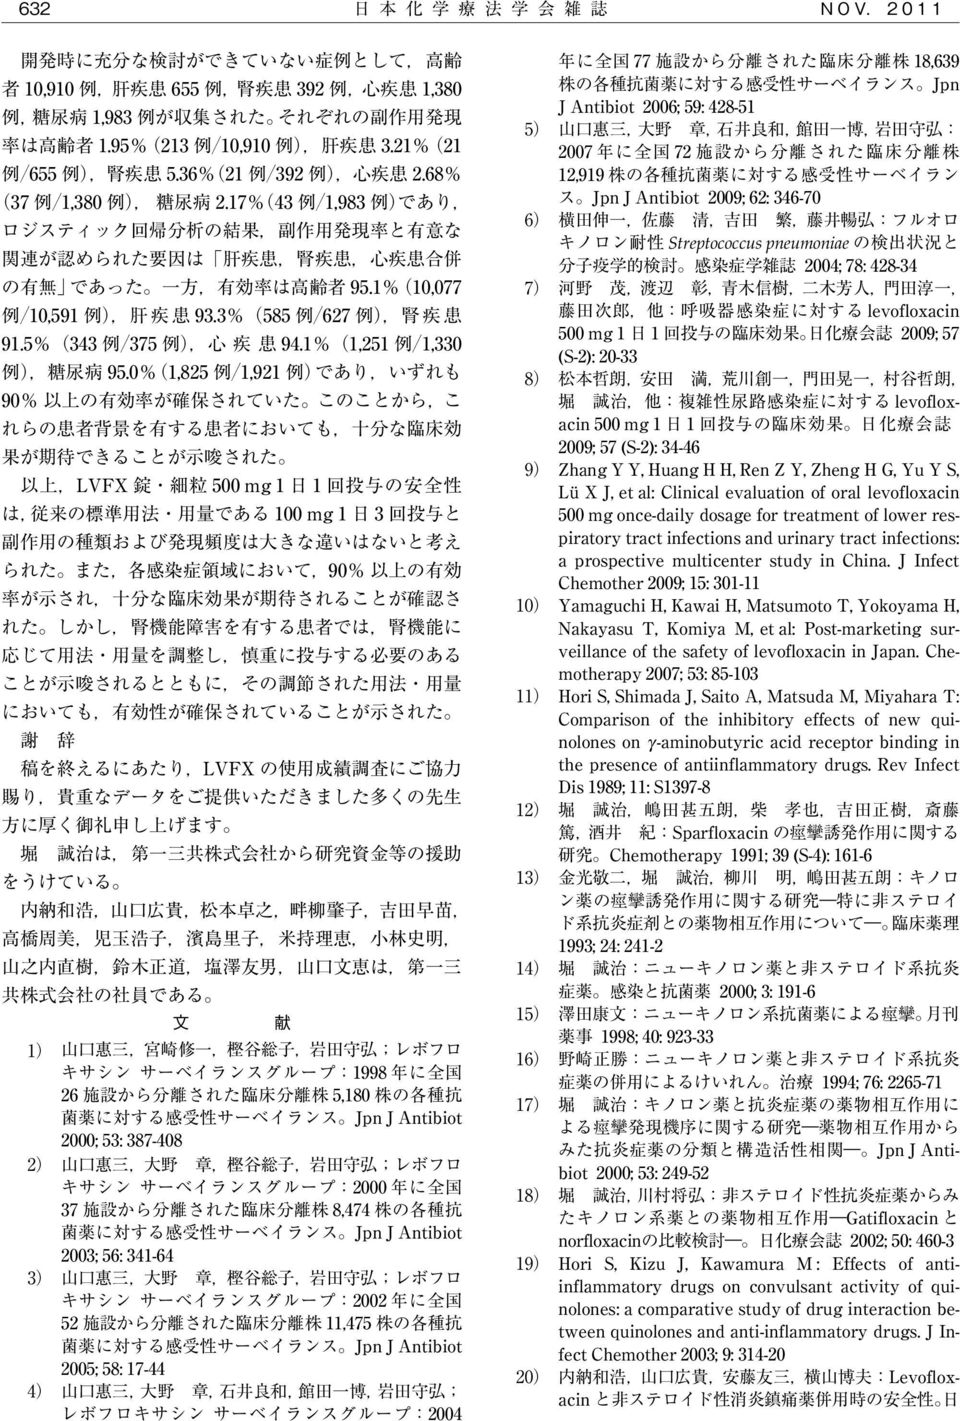
5 Table 2. (Continued) Item Studies conducted before approval Use-result survey Total Type of ADRs Incidence by type of ADRs (%) Eye disorders 3 (0.19) 5 (0.02) 8 (0.03) Diplopia 1 (0.00) 1 (0.00) Dry eye 1 (0.06) 1 (0.00) Eye swelling 1 (0.06) 1 (0.00) Eyelid oedema 1 (0.06) 1 (0.00) Ocular hyperaemia 1 (0.00) 1 (0.00) Vision blurred 1 (0.00) 1 (0.00) Visual acuity reduced 1 (0.00) 1 (0.00) Visual impairment 1 (0.00) 1 (0.00) Ear and labyrinth disorders 3 (0.19) 1 (0.00) 4 (0.01) Tinnitus 2 (0.13) 2 (0.01) Vertigo 1 (0.00) 1 (0.00) Ear discomfort 1 (0.06) 1 (0.00) Cardiac disorders 10 (0.63) 9 (0.03) 19 (0.06) Bradycardia 1 (0.06) 1 (0.00) Palpitations 9 (0.57) 9 (0.03) 18 (0.06) Vascular disorders 2 (0.13) 3 (0.01) 5 (0.02) Flushing 1 (0.00) 1 (0.00) Hypertension 1 (0.06) 1 (0.00) 2 (0.01) Hot flush 1 (0.06) 1 (0.00) 2 (0.01) Respiratory, thoracic and mediastinal disorders 5 (0.32) 7 (0.02) 12 (0.04) Choking sensation 1 (0.06) 1 (0.00) Dry throat 4 (0.25) 4 (0.01) Dyspnoea 3 (0.01) 3 (0.01) Epistaxis 2 (0.01) 2 (0.01) Interstitial lung disease 1 (0.00) 1 (0.00) Rhinorrhoea 1 (0.00) 1 (0.00) Gastrointestinal disorders 139 (8.79) 190 (0.64) 329 (1.05) Abdominal discomfort 20 (1.26) 24 (0.08) 44 (0.14) Abdominal distension 12 (0.76) 3 (0.01) 15 (0.05) Abdominal pain 6 (0.38) 5 (0.02) 11 (0.03) Abdominal pain lower 1 (0.06) 1 (0.00) 2 (0.01) Abdominal pain upper 8 (0.51) 12 (0.04) 20 (0.06) Constipation 4 (0.25) 9 (0.03) 13 (0.04) Diarrhoea 22 (1.39) 73 (0.24) 95 (0.30) Dry mouth 11 (0.70) 11 (0.03) Dyspepsia 5 (0.32) 3 (0.01) 8 (0.03) Eructation 2 (0.13) 2 (0.01) Frequent bowel movements 1 (0.06) 1 (0.00) Gastritis 3 (0.01) 3 (0.01) Gastrooesophageal reflux disease 3 (0.19) 3 (0.01) Gastrointestinal disorder 6 (0.38) 5 (0.02) 11 (0.03) Glossitis 1 (0.00) 1 (0.00) Mouth ulceration 1 (0.00) 1 (0.00) Nausea 55 (3.48) 51 (0.17) 106 (0.34) Stomatitis 2 (0.01) 2 (0.01) Vomiting 22 (1.39) 16 (0.05) 38 (0.12) Tongue dry 1 (0.06) 1 (0.00) Epigastric discomfort 1 (0.06) 1 (0.00) 2 (0.01) Hypoaesthesia oral 1 (0.00) 1 (0.00) Hepatobiliary disorders 16 (1.01) 22 (0.07) 38 (0.12) Hepatic function abnormal 15 (0.95) 14 (0.05) 29 (0.09) Liver disorder 1 (0.06) 8 (0.03) 9 (0.03) (Continued)
 Bradycardia 1 (0.06) 1 (0.00) Palpitations 9 (0.57) 9 (0.03) 18 (0.06) Vascular disorders 2 (0.13) 3 (0.01) 5 (0.02) Flushing 1 (0.00) 1 (0.00) Hypertension 1 (0.06) 1 (0.00) 2 (0.")
6 Table 2. (Continued) Item Studies conducted before approval Use-result survey Total Type of ADRs Incidence by type of ADRs (%) Skin and subcutaneous tissue disorders 24 (1.52) 56 (0.19) 80 (0.25) Cold sweat 2 (0.01) 2 (0.01) Drug eruption 2 (0.13) 16 (0.05) 18 (0.06) Eczema 3 (0.01) 3 (0.01) Erythema 1 (0.06) 3 (0.01) 4 (0.01) Hyperhidrosis 1 (0.06) 1 (0.00) Photosensitivity reaction 1 (0.00) 1 (0.00) Pruritus 8 (0.51) 4 (0.01) 12 (0.04) Rash 13 (0.82) 19 (0.06) 32 (0.10) Rash generalised 1 (0.06) 1 (0.00) 2 (0.01) Rash pruritic 1 (0.00) 1 (0.00) Urticaria 10 (0.03) 10 (0.03) Pruritus generalised 2 (0.01) 2 (0.01) Musculoskeletal and connective tissue disorders 13 (0.82) 10 (0.03) 23 (0.07) Arthralgia 3 (0.19) 2 (0.01) 5 (0.02) Back pain 2 (0.13) 1 (0.00) 3 (0.01) Flank pain 1 (0.00) 1 (0.00) Joint swelling 1 (0.06) 1 (0.00) Muscular weakness 2 (0.13) 1 (0.00) 3 (0.01) Musculoskeletal pain 1 (0.06) 1 (0.00) Myalgia 3 (0.01) 3 (0.01) Pain in extremity 4 (0.25) 4 (0.01) Tendon disorder 1 (0.00) 1 (0.00) Tendon pain 1 (0.00) 1 (0.00) Renal and urinary disorders 4 (0.25) 9 (0.03) 13 (0.04) Haematuria 1 (0.06) 1 (0.00) Oliguria 1 (0.06) 1 (0.00) Pollakiuria 1 (0.06) 2 (0.01) 3 (0.01) Proteinuria 1 (0.00) 1 (0.00) Renal disorder 1 (0.00) 1 (0.00) Urine abnormality 1 (0.00) 1 (0.00) Renal impairment 1 (0.06) 4 (0.01) 5 (0.02) Reproductive system and breast disorders 1 (0.06) 1 (0.00) Menstrual disorder 1 (0.06) 1 (0.00) General disorders and administration site conditions 27 (1.71) 30 (0.10) 57 (0.18) Asthenia 12 (0.76) 3 (0.01) 15 (0.05) Chest discomfort 6 (0.38) 6 (0.02) Chills 1 (0.06) 1 (0.00) Death 1 (0.00) 1 (0.00) Face oedema 3 (0.01) 3 (0.01) Fatigue 1 (0.06) 1 (0.00) Feeling abnormal 3 (0.19) 5 (0.02) 8 (0.03) Feeling hot 1 (0.06) 1 (0.00) Irritability 1 (0.00) 1 (0.00) Malaise 1 (0.06) 8 (0.03) 9 (0.03) Oedema 1 (0.00) 1 (0.00) Oedema peripheral 2 (0.13) 3 (0.01) 5 (0.02) Pyrexia 1 (0.00) 1 (0.00) Thirst 1 (0.06) 6 (0.02) 7 (0.02) Localised oedema 1 (0.00) 1 (0.00) (Continued) χ χ
 Pruritus generalised 2 (0.01) 2 (0.01) Musculoskeletal and connective tissue disorders 13 (0.82) 10 (0.03) 23 (0.07) Arthralgia 3 (0.19) 2 (0.01) 5 (0.02) Back pain 2 (0.13) 1 (0.00) 3 (0.")
7 Table 2. (Continued) Item Studies conducted before approval Use-result survey Total Type of ADRs Incidence by type of ADRs (%) Investigations 211 (13.34) 94 (0.31) 305 (0.97) Alanine aminotransferase increased 29 (1.83) 26 (0.09) 55 (0.17) Aspartate aminotransferase increased 22 (1.39) 26 (0.09) 48 (0.15) Basophil count increased 1 (0.06) 1 (0.00) Blood bilirubin increased 10 (0.63) 10 (0.03) Blood chloride decreased 1 (0.00) 1 (0.00) Blood creatine phosphokinase increased 4 (0.25) 5 (0.02) 9 (0.03) Blood creatinine increased 3 (0.19) 8 (0.03) 11 (0.03) Blood glucose decreased 1 (0.06) 1 (0.00) 2 (0.01) Blood glucose increased 1 (0.00) 1 (0.00) Blood lactate dehydrogenase increased 26 (1.64) 6 (0.02) 32 (0.10) Blood potassium increased 2 (0.13) 2 (0.01) 4 (0.01) Blood pressure increased 1 (0.00) 1 (0.00) Blood urea decreased 1 (0.06) 1 (0.00) Blood urea increased 1 (0.06) 3 (0.01) 4 (0.01) C-reactive protein increased 1 (0.00) 1 (0.00) Blood uric acid increased 1 (0.06) 1 (0.00) Eosinophil count decreased 3 (0.19) 3 (0.01) Eosinophil count increased 19 (1.20) 10 (0.03) 29 (0.09) Gamma-glutamyltransferase abnormal 1 (0.06) 1 (0.00) Gamma-glutamyltransferase increased 10 (0.63) 8 (0.03) 18 (0.06) Glucose urine present 3 (0.19) 1 (0.00) 4 (0.01) Hematocrit decreased 2 (0.13) 2 (0.01) Hematocrit increased 1 (0.06) 1 (0.00) Blood urine present 3 (0.19) 3 (0.01) Hemoglobin decreased 1 (0.00) 1 (0.00) Hemoglobin increased 1 (0.06) 1 (0.00) Liver function test abnormal 3 (0.01) 3 (0.01) Lymphocyte count decreased 2 (0.13) 2 (0.01) Lymphocyte count increased 4 (0.25) 4 (0.01) Monocyte count increased 2 (0.13) 2 (0.01) Neutrophil count decreased 13 (0.82) 1 (0.00) 14 (0.04) Platelet count decreased 18 (1.14) 3 (0.01) 21 (0.07) Red blood cell count decreased 2 (0.13) 2 (0.01) White blood cell count decreased 50 (3.16) 4 (0.01) 54 (0.17) White blood cell count increased 3 (0.19) 2 (0.01) 5 (0.02) Blood bilirubin decreased 1 (0.06) 1 (0.00) Platelet count increased 15 (0.95) 2 (0.01) 17 (0.05) Basophil percentage increased 3 (0.19) 3 (0.01) Eosinophil percentage increased 3 (0.19) 6 (0.02) 9 (0.03) Neutrophil percentage decreased 5 (0.32) 5 (0.02) Neutrophil percentage increased 1 (0.06) 1 (0.00) Monocyte percentage increased 2 (0.13) 2 (0.01) Lymphocyte percentage decreased 1 (0.06) 1 (0.00) 2 (0.01) Lymphocyte percentage increased 8 (0.51) 8 (0.03) Protein urine present 4 (0.25) 1 (0.00) 5 (0.02) Blood alkaline phosphatase increased 5 (0.32) 6 (0.02) 11 (0.03) Hepatic enzyme increased 1 (0.00) 1 (0.00) II
 11 (0.03) Blood glucose decreased 1 (0.06) 1 (0.00) 2 (0.01) Blood glucose increased 1 (0.00) 1 (0.00) Blood lactate dehydrogenase increased 26 (1.64) 6 (0.02) 32 (0.")
8 Gender Age Types of infections Severity of infection Dose form Drug history of allergies Table 3. Incidence of adverse drug reactions by patients profile Parameters No. of cases No. of patients with ADRs (%) Univariate Multivariate OR 95%CI P OR 95%CI P Male 12, (1.6%) (ref) (ref) Female 17, (1.7%) ( ) ( ) (0%) ( ) ( ) 15 to 65 18, (1.4%) (ref) (ref) 65 to 75 5, (2%) ( ) ( ) 75 5, (1.9%) ( ) ( ) Respiratory tract infections 13, (1.7%) (ref) (ref) Urinary tract or genitals infectious disease 8, (1.6%) ( ) ( ) Obstetrics and gynecology area infections (1%) ( ) ( ) Dermatological infections 1, (1.7%) ( ) ( ) Surgery and orthopedics department area infections (0.8%) ( ) ( ) Biliary tract infections (1.7%) ( ) ( ) Otorhinolaryngology area infections 2, (1.9%) ( ) ( ) Ophthalmology department area infections (0%) ( ) ( ) Intestinal tract infections 1, (1.1%) ( ) ( ) Dental and oral surgical area infections (1.5%) ( ) ( ) Other (2.4%) ( ) ( ) Mild 15, (1.5%) (ref) (ref) Moderate 13, (1.7%) ( ) ( ) Severe (1.9%) ( ) ( ) Unclear/unrecorded 43 0 (0%) ( ) ( ) Tablets 29, (1.6%) (ref) (ref) Fine granules (2.6%) ( ) ( ) Unclear/unrecorded 2 0 (0%) ( ) ( ) No 29, (1.5%) (ref) (ref) Yes (6.2%) ( ) ( ) (Continued)
 (ref) 0.4115 (ref) Urinary tract or genitals infectious disease 8,455 132 (1.6%) 0.9282 (0.7471 1.1531) ( ) Obstetrics and gynecology area infections 396 4 (1%) 0.5972 (0.2211 1.")
9 Underlying disease (s) complications Concomitant drug LVFX administration method Table 3. (Continued) Hepatic disease Renal disease Heart disease Parameters Cerebrovascular disorder Diabetes Convulsive disease Propionate/phenylacetate NSAIDs Warfarin No. of cases No. of patients with ADRs (%) Univariate Multivariate OR 95%CI P OR 95%CI P No 29, (1.6%) (ref) (ref) Yes (3.2%) ( ) ( ) No 29, (1.6%) (ref) (ref) Yes (5.4%) ( ) ( ) No 28, (1.6%) (ref) (ref) Yes 1, (2.7%) ( ) ( ) No 28, (1.6%) (ref) (ref) Yes 1, (3.2%) ( ) ( ) No 27, (1.6%) (ref) (ref) Yes 1, (2.2%) ( ) ( ) No 29, (1.6%) (ref) (ref) Yes (2.4%) ( ) ( ) No 25, (1.6%) (ref) (ref) Yes 4, (1.5%) ( ) ( ) No 29, (1.6%) (ref) (ref) Yes (2.4%) ( ) ( ) 500 mg daily 28, (1.6%) (ref) (ref) 250 mg daily 1, (1.4%) ( ) ( ) 500 mg 1 on day 1, 250 mg 1 from day (2.8%) ( ) ( ) 500 mg 1 on day 1, 250 mg 1 from day (6.7%) ( ) ( ) Other (1.5%) ( ) ( )
 (ref) 0.0001 (ref) 0.0001 Yes 392 21 (5.4%) 3.5652 (2.2754 5.5864) 2.9237 (1.8449 4.6332) No 28,500 445 (1.6%) (ref) 0.0014 (ref) 0.0494 Yes 1,380 37 (2.7%) 1.737 (1.2366 2.4398) 1.4218 (1.0009 2.")
10 Table 4. Incidence of ADRs by presence/absence of drug allergy, hepatic disease, renal disease, heart disease, cerebrovascular disorder Drug allergy Hepatic disease Renal disease Heart disease Cerebrovascular disorder No Yes No Yes No Yes No Yes No Yes No. of patients 29, , , ,500 1,380 28,772 1,108 No. of patients with ADRs No. of occurrences of ADRs Incidence of ADRs 1.51% 6.15% 1.58% 3.21% 1.56% 5.36% 1.56% 2.68% 1.55% 3.16% Type of ADRs No. of occurrences of ADRs (%) No. of occurrences of ADRs (%) No.of occurrences of ADRs (%) No.of occurrences of ADRs (%) No. of occurrences of ADRs (%) Infections and infestations 6 (0.02%) 1 (0.15%) 6 (0.02%) 1 (0.15%) 6 (0.02%) 1 (0.26%) 7 (0.02%) 0 (0.00%) 7 (0.02%) 0 (0.00%) Blood and lymphatic system disorders 5 (0.02%) 0 (0.00%) 5 (0.02%) 0 (0.00%) 5 (0.02%) 0 (0.00%) 2 (0.01%) 3 (0.22%) 4 (0.01%) 1 (0.09%) Immune system disorders 2 (0.01%) 0 (0.00%) 2 (0.01%) 0 (0.00%) 2 (0.01%) 0 (0.00%) 2 (0.01%) 0 (0.00%) 2 (0.01%) 0 (0.00%) Metabolism and nutrition disorders 13 (0.04%) 2 (0.29%) 15 (0.05%) 0 (0.00%) 13 (0.04%) 2 (0.51%) 12 (0.04%) 3 (0.22%) 13 (0.05%) 2 (0.18%) Psychiatric disorders 17 (0.06%) 0 (0.00%) 17 (0.06%) 0 (0.00%) 16 (0.05%) 1 (0.26%) 15 (0.05%) 2 (0.14%) 16 (0.06%) 1 (0.09%) Nervous system disorders 44 (0.15%) 6 (0.88%) 47 (0.16%) 3 (0.46%) 49 (0.17%) 1 (0.26%) 45 (0.16%) 5 (0.36%) 46 (0.16%) 4 (0.36%) Eye disorders 5 (0.02%) 0 (0.00%) 5 (0.02%) 0 (0.00%) 5 (0.02%) 0 (0.00%) 5 (0.02%) 0 (0.00%) 4 (0.01%) 1 (0.09%) Ear and labyrinth disorders 1 (0.00%) 0 (0.00%) 1 (0.00%) 0 (0.00%) 1 (0.00%) 0 (0.00%) 1 (0.00%) 0 (0.00%) 1 (0.00%) 0 (0.00%) Cardiac disorders 9 (0.03%) 0 (0.00%) 9 (0.03%) 0 (0.00%) 9 (0.03%) 0 (0.00%) 9 (0.03%) 0 (0.00%) 9 (0.03%) 0 (0.00%) Vascular disorders 3 (0.01%) 0 (0.00%) 3 (0.01%) 0 (0.00%) 3 (0.01%) 0 (0.00%) 3 (0.01%) 0 (0.00%) 3 (0.01%) 0 (0.00%) Respiratory, thoracic and mediastinal disorders 5 (0.02%) 2 (0.29%) 7 (0.02%) 0 (0.00%) 7 (0.02%) 0 (0.00%) 7 (0.02%) 0 (0.00%) 7 (0.02%) 0 (0.00%) Gastrointestinal disorders 176 (0.60%) 14 (2.05%) 185 (0.63%) 5 (0.76%) 188 (0.64%) 2 (0.51%) 180 (0.63%) 10 (0.72%) 182 (0.63%) 8 (0.72%) Hepatobiliary disorders 19 (0.07%) 3 (0.44%) 20 (0.07%) 2 (0.31%) 20 (0.07%) 2 (0.51%) 21 (0.07%) 1 (0.07%) 21 (0.07%) 1 (0.09%) Skin and subcutaneous tissue disorders Musculoskeletal and connective tissue disorders 47 (0.16%) 9 (1.32%) 54 (0.18%) 2 (0.31%) 54 (0.18%) 2 (0.51%) 56 (0.20%) 0 (0.00%) 53 (0.18%) 3 (0.27%) 8 (0.03%) 2 (0.29%) 10 (0.03%) 0 (0.00%) 10 (0.03%) 0 (0.00%) 9 (0.03%) 1 (0.07%) 8 (0.03%) 2 (0.18%) Renal and urinary disorders 9 (0.03%) 0 (0.00%) 9 (0.03%) 0 (0.00%) 7 (0.02%) 2 (0.51%) 7 (0.02%) 2 (0.14%) 7 (0.02%) 2 (0.18%) General disorders and administration site conditions 27 (0.09%) 3 (0.44%) 28 (0.10%) 2 (0.31%) 30 (0.10%) 0 (0.00%) 29 (0.10%) 1 (0.07%) 29 (0.10%) 1 (0.09%) Investigations 88 (0.30%) 6 (0.88%) 84 (0.29%) 10 (1.53%) 85 (0.29%) 9 (2.30%) 83 (0.29%) 11 (0.80%) 81 (0.28%) 13 (1.17%)
 No.")
11 Table 5. Incidence of ADRs by presence/absence of NSAIDs No concomitant NSAIDs (N 21,826) Concomitant use of propionate/phenylacetate NSAIDs (N 4,104) Concomitant use of other NSAIDs (N 3,950) No. of patients with ADRs (%) 323 (1.48) 61 (1.49) 98 (2.48) P No. of patients with CNS ADRs (%) 46 (0.21) 9 (0.22) 10 (0.25) P test γ
 No. of patients with ADRs (%) 323 (1.48) 61 (1.49) 98 (2.48) P 0.")
12 Table 6. Patients who onset convulsions Recovery Duration Other Time to convulsion Concomitant propionate/ phenylacetate NSAIDs Dose/ administration period of LVFX Underlying disease/ complications Medical history Gender Age Diagnosis ADR (seriousness) Body weight: 48 kg Ccr: 30.1 ml/min BUN: 11.2 mg/dl None 4 days Recovered 1 day 500 mg (once a day) 4 days Chronic heart failure Constipation Reflux esophagitis Cerebral infarction Urinary bladder cancer Left renal pelvic cancer Cognitive impairment Male 85 Cystitis Convulsion (serious) Ccr: not measured BUN: not measured Yes 1 day Recovered 1 day 500 mg (once a day) 4 days Rheumatoid arthritis Osteoporosis Interstitial pneumonia Male 78 Deep skin infections Convulsion (not serious)
 4 days Chronic heart failure Constipation Reflux esophagitis Cerebral infarction Urinary bladder cancer Left renal pelvic cancer")
13 Table 7. Efficacy by type of infection and indicated diseases Infection No. of cases Effective Ineffective Efficacy rate Overall 28,800 27,658 1, % Types of infections Indicated diseases Respiratory tract infections 13,146 12, % Urinary tract or genitals infectious disease 8,386 8, % Obstetrics and gynecology area infections % Dermatological infections 1,477 1, % Surgery and orthopedics department area infections % Biliary tract infections % Otorhinolaryngology area infections 2,435 2, % Ophthalmology department area infections % Intestinal tract infections 1,270 1, % Dental and oral surgical area infections % Other infection % Respiratory tract infections Urinary tract or genitals infectious disease Obstetrics and gynecology area infections Dermatological infections Surgery and orthopedics department area infections Biliary tract infections Otorhinolaryngology area infections Ophthalmology department area infections Intestinal tract infections Laryngopharyngitis 3,729 3, % Tonsillitis 1,745 1, % Acute bronchitis 4,945 4, % Pneumonia 1,929 1, % Secondary infections of chronic respiratory diseases % Cystitis 6,309 6, % Pyelonephritis % Prostatitis % Epididymitis % Urethritis % Cervicitis % Bartholinitis % Intrauterine infection % Uterine adnexitis % Superficial skin infections % Acne % Deep skin infections % Lymphangitis/lymphadenitis % Chronic pyoderma % Secondary infection in trauma, burns, operative wound % Mastitis % Perianal abscess % Cholecystitis % Cholangitis % Otitis externa % Otitis media % Sinusitis 1,755 1, % Suppurative sialadenitis % Dacryocystitis % Hordeolum % Tarsadenitis % Infectious enteritis 1,269 1, % Paratyphoid % Dental and oral Periodontitis % surgical area Pericoronitis % infections Gnathitis % Other infection Q fever %

14 Table 8. Efficacy and bacterial eradication by causative bacteria Bacteria Efficacy rate Bacterial eradication rate Overall 94.0% (3,265/3,472) 94.2% (2,794/2,965) Gram-positive bacteria 92.8% (936/1,009) 93.6% (902/964) Staphylococcus sp. 89.9% (401/446) 91.5% (389/425) Streptococcus sp. 93.5% (217/232) 95.9% (208/217) Enterococcus sp. 93.7% (148/158) 92.1% (174/189) Streptococcus pneumoniae 98.3% (170/173) 98.5% (131/133) Gram-negative bacteria 94.6% (2,223/2,349) 94.5% (1,793/1,898) Acinetobacter sp % (10/10) 100.0% (14/14) Haemophilus influenzae 98.5% (134/136) 98.1% (106/108) Enterobacter sp. 94.4% (34/36) 95.0% (38/40) Campylobacter sp. 96.4% (27/28) 100.0% (16/16) Klebsiella sp. 98.6% (143/145) 98.6% (145/147) Salmonella sp. 91.7% (11/12) 90.9% (10/11) Citrobacter sp. 93.5% (58/62) 94.1% (48/51) Serratia sp. 96.2% (25/26) 92.3% (24/26) Salmonella paratyphi 100.0% (1/1) 100.0% (1/1) Proteus sp % (60/60) 98.5% (65/66) Providencia sp. 75.0% (3/4) 85.7% (6/7) Moraxella (Branhamella) catarrhalis 95.5% (42/44) 97.5% (39/40) Morganella morganii 90.9% (10/11) 91.7% (11/12) Escherichia coli 95.4% (1,521/1,594) 95.7% (1,146/1,198) Pseudomonas aeruginosa 85.8% (103/120) 79.6% (86/108) Strains of respiratory tract infection origin 86.4% (38/44) 69.7% (23/33) Strains of urinary tract infection origin 81.0% (34/42) 81.8% (27/33) Others 91.2% (31/34) 85.7% (36/42) Neisseria gonorrhoeae 68.3% (41/60) 71.7% (38/53) Anaerobic bacteria 100.0% (9/9) 100.0% (15/15) Peptostreptococcus sp % (9/9) 100.0% (15/15) Atypical bacteria 92.4% (97/105) 95.5% (84/88) Legionella sp % (4/4) 100.0% (2/2) Trachoma chlamydia (Chlamydia trachomatis) 92.1% (93/101) 95.3% (82/86) Streptococcus pneumoniae Staphylococcus Streptococcus Enterococcus
 Haemophilus influenzae 98.5% (134/136) 98.1% (106/108) Enterobacter sp. 94.4% (34/36) 95.0% (38/40) Campylobacter sp. 96.4% (27/28) 100.0% (16/16) Klebsiella sp. 98.6% (143/145) 98.")
15 Ccr (ml/min) Ccr 50 Ccr 20 No. of patients (%) 2,947 (99.26) 22 (0.74) (94.26) 38 (5.60) 1 (0.15) 41 (54.67) 6 (8.00) 28 (37.33) Table 9. Occurrence of ADRs and efficacy rate by Ccr and dose Dosage and administration 500 mg once as a consecutive dose 500 mg/day on day 1, 250 mg/day from day 2 as a consecutive dose 500 mg/day on day 1, 250 mg/day from day 3 as an alternative dose 500 mg once as a consecutive dose 500 mg/day on day 1, 250 mg/day from day 2 as a consecutive dose 500 mg/day on day 1, 250 mg/day from day 3 as an alternative dose 500 mg once a day as a consecutive dose 500 mg/day on day 1, 250 mg/day from day 2 as a consecutive dose 500 mg/day on day 1, 250 mg/day from day 3 as an alternative dose Incidence of ADRs Overall 3.02% (89/2,947) 0% (0/22) CNS 0.27% (8/2,947) 0% (0/22) Efficacy rate 94.5% (2,672/2,829) 100% (22/22) 4.22% (27/640) 7.89% (3 2 /38) 100% (1 3 /1) 2.44% (1 4 /41) 16.67% (1 5 /6) 3.57% (1 6 /28) 0.47% (3 1 /640) 0% (0/38) 0% (0/1) 2.44% (1 4 /41) 0% (0/6) 0% (0/28) 92.5% (580/627) 86.5% (32/37) 100% (1/1) 91.9% (34/37) 100% (6/6) 88.5% (23/26) Gray areas: Dosage and administration entered in Precautions related to dosage and administration. 1: Convulsion: 1 (serious), Dizziness: 1 (not serious), Headache: 1 (not serious) 2: Renal impairment: 1 (not serious), White blood cell count decreased: 1 (not serious), Blood lactate dehydrogenase increased: 1 (not serious), Blood potassium increased: 1 (not serious) 3: Glucose urine present: 1 (not serious), Protein urine present: 1 (not serious) 4: Hallucination: 1 (not serious) 5: Renal impairment: 1 (not serious) 6: Alanine aminotransferase increased: 1 (not serious), Aspartate aminotransferase increased: 1 (not serious) Haemophilus influenzae Moraxella Branhamella catarrhalis Escherichia coli Neisseria gonorrhoeae Providencia Pseudomonas aeruginosa Legionella Chlamydophila pneumoniae Mycoplasma pneumoniae H. influenzae M. B. catarrhalis E. coli

16 Table 10. Incidence of ADRs by age and the presence of diabetes Age Diabetes No Yes No. of patients 18,970 5,162 5,748 27,897 1,983 No. of patients with ADRs No. of occurrences of ADRs Incidence of ADRs 1.42% 2.01% 1.90% 1.57% 2.17% Type of ADRs No. of occurrences of ADRs (%) No. of occurrences of ADRs (%) Infections and infestations 4 (0.02%) 2 (0.04%) 1 (0.02%) 7 (0.03%) 0 (0.00%) Blood and lymphatic system disorders 1 (0.01%) 0 (0.00%) 4 (0.07%) 5 (0.02%) 0 (0.00%) Immune system disorders 2 (0.01%) 0 (0.00%) 0 (0.00%) 2 (0.01%) 0 (0.00%) Metabolism and nutrition disorders 1 (0.01%) 6 (0.12%) 8 (0.14%) 10 (0.04%) 5 (0.25%) Psychiatric disorders 10 (0.05%) 3 (0.06%) 4 (0.07%) 16 (0.06%) 1 (0.05%) Nervous system disorders 32 (0.17%) 9 (0.17%) 9 (0.16%) 46 (0.16%) 4 (0.20%) Eye disorders 3 (0.02%) 1 (0.02%) 1 (0.02%) 5 (0.02%) 0 (0.00%) Ear and labyrinth disorders 1 (0.01%) 0 (0.00%) 0 (0.00%) 1 (0.00%) 0 (0.00%) Cardiac disorders 4 (0.02%) 5 (0.10%) 0 (0.00%) 9 (0.03%) 0 (0.00%) Vascular disorders 1 (0.01%) 2 (0.04%) 0 (0.00%) 3 (0.01%) 0 (0.00%) Respiratory, thoracic and mediastinal disorders 6 (0.03%) 1 (0.02%) 0 (0.00%) 7 (0.03%) 0 (0.00%) Gastrointestinal disorders 119 (0.63%) 37 (0.72%) 34 (0.59%) 177 (0.63%) 13 (0.66%) Hepatobiliary disorders 15 (0.08%) 4 (0.08%) 3 (0.05%) 20 (0.07%) 2 (0.10%) Skin and subcutaneous tissue disorders 34 (0.18%) 10 (0.19%) 12 (0.21%) 52 (0.19%) 4 (0.20%) Musculoskeletal and connective tissue disorders 5 (0.03%) 2 (0.04%) 3 (0.05%) 10 (0.04%) 0 (0.00%) Renal and urinary disorders 3 (0.02%) 2 (0.04%) 4 (0.07%) 7 (0.03%) 2 (0.10%) General disorders and administration site conditions 16 (0.08%) 8 (0.15%) 6 (0.10%) 28 (0.10%) 2 (0.10%) Investigations 37 (0.20%) 25 (0.48%) 32 (0.56%) 81 (0.29%) 13 (0.66%)
 0 (0.00%) Metabolism and nutrition disorders 1 (0.01%) 6 (0.12%) 8 (0.14%) 10 (0.04%) 5 (0.25%) Psychiatric disorders 10 (0.05%) 3 (0.06%) 4 (0.07%) 16 (0.06%) 1 (0.")
17 III
18 S. pneumoniae E. coli
19 Streptococcus pneumoniae γ
20
日本化学療法学会雑誌第61巻第4号
 μ μ μ μ μ μ Key words I β μ Sex Age (years) Height (cm) Evaluation items Table1.Characteristics of patients 1. mg/kg/day (n14) 2.5 mg/kg/day (n9) 5. mg/kg/day (n9) Total (n32) male 12 8 7 27 female 2 1
日本化学療法学会雑誌第60巻第4号
 Streptococcus pneumoniae Haemophilus influenzae S. pneumoniae H. influenzae Key words β Streptococcus pneumoniae Haemophilus influenzae S. pneumoniae H. influenzae μ μ S. pneumoniae H. influenzae S. pneumoniae
日本化学療法学会雑誌第59巻第5号
 Streptococcus pneumoniae Haemophilus influenzae Moraxella catarrhalis S. pneumoniae H. influenzae M. catarrhalis S. pneumoniae H. influenzae M. catarrhalis S. pneumoniae H. influenzae M. catarrhalis S.
日本化学療法学会雑誌第65巻第3号
 μ Key words Chlamydia trachomatis C. trachomatis I Table1.Observation items, categories and scores Observation item Category Score Body temperature () Lower abdominal pain Uterine corpus tenderness Condition
日本化学療法学会雑誌第56巻第1号
 β β β β β Streptococcus pneumoniaehaemophilus influenzaemoraxella catarrhalismycoplasma pneumoniaechlamydia pneumoniae β Key wordsβ mys nilc laci ngis Table. Assessmentschedule Parameters Patientcharacteristics
366 12 THE JAPANESE JOURNAL OF ANTIBIOTICS 65 6 Dec. 2012 1 8 DNA 2,3 16 12 20 171 2008 12 2010 11 2 3,558 4.44% 1.65% 1.17% 90% 9 Escherichia coli -
 Dec. 2012 THE JAPANESE JOURNAL OF ANTIBIOTICS 65 6 365 11 sita oxacin 1 1 1 1 1 1 2 2 3 3 1 1 1 2 3 2012 9 14 sita oxacin STFX 50 mg 10% 2008 1 2008 12 2010 11 2 STFX 1,452 91.4% 1,235/1,351 95.9% 466/486
日本化学療法学会雑誌第61巻第6号
 β Moraxella catarrhalis Escherichia coli Citrobacter Klebsiella pneumoniae Enterobacter cloacae Serratia marcescens Proteus Pseudomonas aeruginosa Acinetobacter Bacteroides fragilis β Haemophilus influenzae
Key words : 7432-S, Oral cephem, Urinary tract infection Fig. 1. Chemical structure of 7432-S.
 Key words : 7432-S, Oral cephem, Urinary tract infection Fig. 1. Chemical structure of 7432-S. Table 1. Clinical summary of acute uncomplicated cystitis patients treated with 7432-S UTI : Criteria by the
日本化学療法学会雑誌第58巻第4号
 Escherichia coli Enterococcus faecalisstreptococcus agalactiae Klebsiella pneumoniae Staphylococcus epidermidis E. colie. faecalispseudomonas aeruginosa K. pneumoniae S. agalactiae E. coli E. coli μ p
CHEMOTHERAPY JUN Citrobacter freundii 27, Enterobacter aerogenes 26, Enterobacter cloacae 27, Proteus rettgeri 7, Proteus inconstans 20, Proteus
 VOL. 32 S-4 CHEMOTHERAPY Fig. 1 Chemical structure of sodium cefoperazone Fig. 2 Chemical structure of sodium cefoperazone CHEMOTHERAPY JUN. 1984 Citrobacter freundii 27, Enterobacter aerogenes 26, Enterobacter
Table 1. Antibacterial activitiy of grepafloxacin and other antibiotics against clinical isolates
 Table 1. Antibacterial activitiy of grepafloxacin and other antibiotics against clinical isolates Table 2-1. Summary of patients treated with grepafloxacin for respiratory infection 1) Out: outpatient,
Fig.2. Sensitivity distribution of clinical isolates of S. epidermidis (24 strains, 106 CFU/ml) Staphylococcus aureus Staphylococcus epider- midis Ent
 Staphylococcus aureus Staphylococcus epider- midis Ent") Fig.2. Sensitivity distribution of clinical isolates of S. epidermidis (24 strains, 106 CFU/ml) Staphylococcus aureus Staphylococcus epider- midis Enterococcus faecalis Klebsiella pneumoniae, Morganella
Fig.2. Sensitivity distribution of clinical isolates of S. epidermidis (24 strains, 106 CFU/ml) Staphylococcus aureus Staphylococcus epider- midis Enterococcus faecalis Klebsiella pneumoniae, Morganella
400 46 THE JAPANESE JOURNAL OF ANTIBIOTICS 65 6 Dec. 2012 LVFX 100 mg 3 / 7 150 mg 2 / 7 2 2006 2008 9 LVFX PK PD 2009 7 100 mg 1 3 500 mg 1 1 AUC/MIC
 Dec. 2012 THE JAPANESE JOURNAL OF ANTIBIOTICS 65 6 399 45 2012 11 5 LVFX 500 mg 1 1 20 Chlamydia trachomatis C. trachomatismycoplasma genitalium M. genitalium LVFX 1 500 mg 1 1 7 22 22 C. trachomatis 17
CHEMOTHERAPY FEB Table 1. Activity of cefpirome and others against clinical isolates
 VOL.39 S-1 CHEMOTHERAPY FEB. 1981 Table 1. Activity of cefpirome and others against clinical isolates VOL.39 S-1 CHEMOTHERAPY FEB. 1991 72 M, 55.5 kg 66 F, 53 kg Chronic bronchitis Bronchopneumonia Peak
CHEMOTHERAPY Table 1 Urinary excretion of mezlocillin Fig. 4 Urinary excretion of mezlocillin Fig. 3 Blood levels of mezlocillin
 CHEMOTHERAPY Fig. 2 Urinary excretion of mezlocillin Fig. 1 Blood levels of mezlocillin CHEMOTHERAPY Table 1 Urinary excretion of mezlocillin Fig. 4 Urinary excretion of mezlocillin Fig. 3 Blood levels
日本化学療法学会雑誌第57巻第S-2号
 Key words β I Table. Observationandtestschedule Testschedule Observation/Tests Beforetreatment Endoftreatment 5 9days aftercompletion oftreatment 4 6weeks aftercompletion oftreatment Informedconsent Patientbackground
Staphylococcus sp. K.pneumoniae P.mirabilis C.freundii E. cloacae Serratia sp. P. aeruginosa ml, Enterococcus avium >100ƒÊg/ml
 CHEMOTHERAPY SEPT. 1992 cefoperazone ceftazidime (CAZ), imipenem (IPM) Staphylococcus sp., Enterococcus (CPZ), faecalis, Escherichia coli, Klebsiella pneumoniae, Citrobacter freundii, Enterobacter cloacae,
CHEMOTHERAPY JUNE 1993 Table 1. Background of patients in pharmacokinetic study
 CHEMOTHERAPY JUNE 1993 Table 1. Background of patients in pharmacokinetic study VOL. 41 S 1 Table 2. Levels (Đg/ml or Đg/g) of S-1006 in serum, bile, and tissue (gallbladder) after oral administration
日本化学療法学会雑誌第56巻第3号
 β Key words Candida albicans albicans Candida C. albicans Candida glabrata Candida krusei albicans Candida C. glabrata C. albicans albicans Candida β in vitro in vivo C. glabrata C. krusei I β γ µ Candida
DatRetPrePTC_R1.4_J.doc
 MedDRA Release 1.4 MedDRA 10.1 ICH MedDRA 2007 912 MedDRA DATA RETRIEVAL AND PRESENTATION: POINTS TO CONSIDER Release 1.4 Based on MedDRA Version 10.1 ICH-Endorsed Guide for MedDRA Users on Data Output
VOL. 34 S-2 CHEMOTH8RAPY 913
 VOL. 34 S-2 CHEMOTH8RAPY 913 914 CHEMOTHERAPY APR. 1986 Fig. 1 Chemical structure of T-2588 and T-2525 T- 2588 pivaloyloxymethyl (+ )- (6 R, 7 R)-7-[(Z)-2- (2-amino- 4-thiazolyl)-2-methox yiminoacetamido]-3-[(
CHEMOTHERAPY
 CHEMOTHERAPY VOL.41 S-2 Laboratory and clinical evaluation of teicoplanin CHEMOTHERAPY AUG. 1993 VOL.41 S-2 Laboratory and clinical evaluation of teicoplanin Table 1. Comparative in vitro activity of teicoplanin
VOL.35 S-2 CHEMOTHERAPY Table 1 Sex and age distribution Table 2 Applications of treatment with carumonam Table 3 Concentration of carumonam in human
 CHEMOTHERAPY Fig. 1 Chemical structure of carumonam Disodium(+)-(Z)-CCE1-(2-amino-4-thiazoly1)-2-[[(2S, -(carbamoyloxymethyl)-4-oxo-1-sulfonato-3-azetidinyll -2-oxoethylidene] amino] oxy] acetate 3S)-2
208 ( 2 ) THE JAPANESE JOURNAL OF ANTIBIOTICS 63 _ 3 June 2010 Cefditoren pivoxil (CDTR-PI) MS MS 10%
 THE JAPANESE JOURNAL OF ANTIBIOTICS 63 _ 3 June 2010 Cefditoren pivoxil (CDTR-PI) MS MS 10%") 207 ( 1 ) Cefditoren pivoxil G 2010 2 2 2006 3 Cefditoren pivoxil CDTR-PI MS 10% CDTR-PI 305 2,144 2,006 1,958 1.79% 36 2,006 26 (1.30%) CDTR-PI CDTR-PI (9 mg/kg/day) 1.5 2 (2.70%) 2 (1.92%) 93.5% 1,831
207 ( 1 ) Cefditoren pivoxil G 2010 2 2 2006 3 Cefditoren pivoxil CDTR-PI MS 10% CDTR-PI 305 2,144 2,006 1,958 1.79% 36 2,006 26 (1.30%) CDTR-PI CDTR-PI (9 mg/kg/day) 1.5 2 (2.70%) 2 (1.92%) 93.5% 1,831
988 CHEMOTHERAPY NOV. 1971
 988 CHEMOTHERAPY NOV. 1971 VOL. 19 NO. 8 CHEMOTHERAPY 989 Effect of medium-ph and inoculum size on activity of SB-PC heart infusion agar, mcg/ml Sensitivity distribution of Staphylococci to SB-PC in surgical
日本化学療法学会雑誌第58巻第2号
 Key words β Candida Table1. MCFGCPAstudygroup Investigator (representative) YoshitsuguMiyazaki NaoyukiMiyashita RyoichiAmitani KenjiOgawa AtsuyukiKurashima ToshiroKiguchi MichiakiMishima YuichiInoue HiroshiSaito
日本化学療法学会雑誌第51巻第2号
 piperacillin piperacillin PIPC. g Cmax CL PIPC CL CLR CLNR CL PIPC g g Cmax PIPC Key words: piperacillin Piperacillin PIPC PIPC g g PIPC Cmax g g ml g g ml g g ml T T T PIPC g g T Ccr ml min AUCCmax PIPC
 VOL. 17 NO. 7 CHEMOTHERAPY 1305 1) W. BRumFirr et al. : Clinical and laboratory studies with carbenicillin. Lancet 1: 1289~ 1293, 1967 2) E. T. KNUDSEN et al. : A new semisynthetic penicillin active against
VOL.42 S-1
 CHEMOTHERAPY APR. 1994 VOL.42 S-1 CHEMOTHERAPY APR. 1994 Table 1. Criteria for evaluation of clinical efficacy by the Japanese Society of Oral and Maxillo-Facial Surgeons Grades of symptoms and numerical
日本化学療法学会雑誌第57巻第4号
 Streptococcus pneumoniae Haemophilus influenzae β β Key words I β Enterococcus faecium Pseudomonas aeruginosa Streptococcus pneumoniae S. pneumoniae Haemophilus influenzae S. pneumoniae H. influenzae Table.
VOL.39 S-3
 VOL.39 S-3 CHEMOTHERAPY SEPT.1991 Table 1. Background of characteristics and allocation of 5 healthy male volunteers in a multiple-dose study on panipenem/betamipron Day 1 Fig. 1. Schedule of multiple-dose
 Table 1. Influence of urine ph on MBCs of new quinolones against Escherichia coli NIHJ JC-2 and Pseudomonas aeruginosa 18S; MBCs in urine were compared with those in Miieller-Hinton broth. Table 2. Influence
Fig. 1 Chemical structure of KW-1070
 Fig. 1 Chemical structure of KW-1070 Fig. 2 Sensitivity distribution of clinical isolates Fig. 4 Sensitivity distribution of clinical isolates Fig. 3 Sensitivity distribution of clinical isolates Fig.
 Table 1 Patients with various renal function * Ccr, Creatinine clearance ml/min per 1. 48 m2 ** C.V.D., Cerebral vascular disease ; C.R F., Chronic renal failure ; H.D., Hemoclialysis ; D., Dialyzer ;
Fig. 1 Chemical structure of norfioxacin (AM-715)
") Fig. 1 Chemical structure of norfioxacin (AM-715) Table 1 Serum and biliary concentration of norfloxacin (AM-715) Table 2 Protocol for clinical evaluation of norfloxacin (AM-715) in the treatment of biliary
Fig. 1 Chemical structure of norfioxacin (AM-715) Table 1 Serum and biliary concentration of norfloxacin (AM-715) Table 2 Protocol for clinical evaluation of norfloxacin (AM-715) in the treatment of biliary
Fig. 1 Chemical structure of DL-8280
 Fig. 1 Chemical structure of DL-8280 Fig. 2 Susceptibility of cl in ical isolates to DL4280 Fig. 5 Susceptibility of clinical isolates to DL-8280 Fig. 3 Susceptibility of clinical isolates to DL-8280 Fig.
Fig. 1 Clinical findings and extent of inflammation area in female urethrocystitis Fig. 2 Classification and distribution of female patients with blad
 Key words: Female with bladder irritability, Subjective symptoms, Pyuria, Bacteriuria Fig. 1 Clinical findings and extent of inflammation area in female urethrocystitis Fig. 2 Classification and distribution
L-DOPA III ( ( [ ] UPDRS Part III Observed Case(OC UPDRS Part III 4.05 OC Last Observation Carried Forward(LOCF S.D
![L-DOPA III ( ( [ ] UPDRS Part III Observed Case(OC UPDRS Part III 4.05 OC Last Observation Carried Forward(LOCF S.D](/thumbs/89/98293599.jpg "L-DOPA III ( ( [ ] UPDRS Part III Observed Case(OC UPDRS Part III 4.05 OC Last Observation Carried Forward(LOCF S.D") 248.505 (3 III L-DOPA 6, 7 1 III L-DOPA ( 248.505 6 L-DOPA L-DOPA III 248.326 7 87 87L-DOPA III ( 248.505 L-DOPA 3 L-DOPA (1 120 2 3 Modified Hoehn & Yahr (2L-DOPA 1Wearing-off 2on-off 3 L-DOPA 4L-DOPA
248.505 (3 III L-DOPA 6, 7 1 III L-DOPA ( 248.505 6 L-DOPA L-DOPA III 248.326 7 87 87L-DOPA III ( 248.505 L-DOPA 3 L-DOPA (1 120 2 3 Modified Hoehn & Yahr (2L-DOPA 1Wearing-off 2on-off 3 L-DOPA 4L-DOPA
 VOL.32 S-9 CHEMOTHERAPY Table 1 Minimum inhibitory concentrations of AC-1370, CPZ and CAZ Table 2 Efficacy of AC-1370 and CPZ against systemic infections in mice *Inoculum size: 106 cells/ml * 95% confidence
CHEMOTHERAPY Fig. 1 Chemical structure of CXM-AX
 Fig. 1 Chemical structure of CXM-AX NOV. 1986 Fig. 2 Sensitivity distribution of clinical isolates organisms (106 cells/ml) a Smurcus 27 strains d) P.m irabilis 15 strains b Ecol i 27 strains 111.morganii
epidermidis, Enterococcus faecalis, Enterococcus Klebsiella pneumoniae, Proteus mirabilis, indolepositive Proteus spp., Enterobacter spp., Serratia
 epidermidis, Enterococcus faecalis, Enterococcus Klebsiella pneumoniae, Proteus mirabilis, indolepositive Proteus spp., Enterobacter spp., Serratia Table 3. Overall clinical efficacy of cefozopran in
Table 1. Antibacterial spectrum SBT ABPC ABPC CPZ : sulbactamiampicillin : ampicillin : cefoperazone
 Table 1. Antibacterial spectrum SBT ABPC ABPC CPZ : sulbactamiampicillin : ampicillin : cefoperazone (inoculum size= 106 CFU/ml) (Ĉ-lactamase producer : 2 strains) Fig. 1. Sensitivity distribution of
CHEMOTHERAPY MAY. 1988
 CHEMOTHERAPY MAY. 1988 CHEMOTHERAPY Fig. 1 Chemical structure CHEMOTHERAPY MAY. 1988 VOL.36 5-1 CHEMOTHERAPY CHEMOTHERAPY MAY. 1988 VOL.36 S-1 CHEMOTHERAPY CHEMOTHERAPY MAY. 1988 VOL.36 S-1 CHEMOTHERAPY
 Table 1. Antibacterial activity of cefdinir, cefixime, cefteram, cefuroxime, cefaclor and amoxicillin against standard strains Inoculum size: 108 cells/ml CFDN: cefdinir, CFIX: cefixime, CFTM: cefteram,
 Ⅰ. Statistics Concerning Health Birthweight (1) Birthweight by year (2) Mean birthweight by prefecture, 2007-1997 (3) Percentage of births under 2,500g by prefecture, 2007-1997 Sex Ratio (4) Sex ratio
 Table 1.Distribution and number of cases with acute upper respiratory tract infections classified according to antimicrobial agents administered Table 2. Distribution of cases which were enrolled to set
A Nutritional Study of Anemia in Pregnancy Hematologic Characteristics in Pregnancy (Part 1) Keizo Shiraki, Fumiko Hisaoka Department of Nutrition, Sc
 Keizo Shiraki, Fumiko Hisaoka Department of Nutrition, Sc") A Nutritional Study of Anemia in Pregnancy Hematologic Characteristics in Pregnancy (Part 1) Keizo Shiraki, Fumiko Hisaoka Department of Nutrition, School of Medicine, Tokushima University, Tokushima Fetal
A Nutritional Study of Anemia in Pregnancy Hematologic Characteristics in Pregnancy (Part 1) Keizo Shiraki, Fumiko Hisaoka Department of Nutrition, School of Medicine, Tokushima University, Tokushima Fetal
CHEMOTHERAPY Table 1 Clinical effect of Sultamicillin
 CHEMOTHERAPY CHEMOTHERAPY Table 1 Clinical effect of Sultamicillin CHEMOTHERAPY Fig. 1 MICs of sultamicillin against respiratory pathogenic Branhamella catarrhalis 62 strains, inoculum size 106CFU/m1 Fig.
 1) Chemical name: Fig. 1 Chemical structure of TE-031 (-)-(3R,4S,5S,6R,7R,9R,11R,12R,13S,14R)-4-[(2, PYranosyl)oxy]-14-ethyl-12,13-dihydroxy-7-meth 6-dideoxy-3-C-methyl-3-O-methyl-a-L-ribo-hexo- oxy-3,5,7,9,11,13-hexamethy1-6-[[3,4,6-trideoxy-3-
Key words : Adverse reactions, Egg allergy, IgG antibody, Mills allergy, FAST
 Key words : Adverse reactions, Egg allergy, IgG antibody, Mills allergy, FAST 13) Danaeus, A., Johansson, S. G. O., Foucard, T. & Ohman, S.: Clinical and immunogical aspects of food allergy in childhood.
2108 CHEMOTHERAPY SEPT Table 1 Antimicrobial spectrum Fig. 1
 2108 CHEMOTHERAPY SEPT. 1977 Table 1 Antimicrobial spectrum Fig. 1 VOL. 25 NO. 7 CHEM 014 HERAPY 2109 Table 2 Susceptibility distribution of Staphylococcus aureus to aminoglycosides (54 strains) Table
 Table 1 Classification of female patients with vealcal irritating symptom by their signs Urination pain with other vesical irritability or not Table 2 Serum levels of DL-8280 after a single oral administration
MIC MIC...
 50 mg 10% 2.7.36 2.7.36 2.7.36... 1 1.6... 1 2.6... 3 3.6... 5 3.16... 5 3.26... 12 3.36... 16 4.6... 17 5.6... 19 6.6... 20 2.7.3.3.16-1 MIC... 9 2.7.3.3.16-2 MIC... 10 2.7.3.3.16-3 MIC E. coli... 11
日本職業・災害医学会会誌第51巻第5号
 太田ら 同時多発性高血圧性脳葉出血の 1 手術例 図 1 搬入時 CT 上段 単純 CT 下段 造影 CT 図 2 術後の脳血管撮影検査では明らかな出血源は認めない 379 Reprint request: MULTIPLE SIMULTANEOUS HYPERTENSIVE LOBAR HEMORRHAGE Hirotsugu OHTA M.D. 1) and Akira YOKOTA M.D.
CHEMOTHERAPY
 CHEMOTHERAPY CHEMOTHERAPY Table 1 Antibacterial activity of BRL 28500 against standard strains of bacteria Fig, 1 Sensitivity distribution of ABPC-resistant E. coli isolated from urinary tract Fig. 2 Sensitivity
THE JAPANESE JOURNAL OF ANTIBIOTICS 68 3 June 2015 Streptococcus pneumoniae, Haemophilus influenzae, Moraxella catarrhalis % 2 S. pneumon
 June 2015 THE JAPANESE JOURNAL OF ANTIBIOTICS 68 3 189 49 1 : 14 1 2 2 3 1 2 3 2015 4 3 1 : 14 CVA/AMPC 1 : 14 27 CVA/AMPC 1 : 14 88.5% Streptococcus pneumoniae, Haemophilus influenzae, Moraxella catarrhalis
CHEMOTHERAPY DEC phvlococcus aureus Staphylococcus Enterococcus faecalis Escherichia Klebsiella pneumoniae Serratia marcescens Pseudomonas cepac
 CHEMOTHERAPY DEC. 1988 phvlococcus aureus Staphylococcus Enterococcus faecalis Escherichia Klebsiella pneumoniae Serratia marcescens Pseudomonas cepacia 1 Bacteroides bivius Propionibacterium granulosum
Title 泌尿器科領域に於ける17-Ketosteroidの研究 17-Ketosteroidの臨床的研究 第 III 篇 : 尿 Author(s) 卜部, 敏入 Citation 泌尿器科紀要 (1958), 4(1): 3-31 Issue Date URL
 卜部, 敏入 Citation 泌尿器科紀要 (1958), 4(1): 3-31 Issue Date URL") Title 泌尿器科領域に於ける17-Ketosteroidの研究 17-Ketosteroidの臨床的研究 第 III 篇 : 尿 Author(s) 卜部, 敏入 Citation 泌尿器科紀要 (1958), 4(1): 3-31 Issue Date 1958-01 URL http://hdl.handle.net/2433/111559 Right Type Departmental Bulletin
Title 泌尿器科領域に於ける17-Ketosteroidの研究 17-Ketosteroidの臨床的研究 第 III 篇 : 尿 Author(s) 卜部, 敏入 Citation 泌尿器科紀要 (1958), 4(1): 3-31 Issue Date 1958-01 URL http://hdl.handle.net/2433/111559 Right Type Departmental Bulletin
第65回日本化学療法学会東日本支部総会 抄録
 鍵 76 Clostridioides difficile C. difficile 77 γ γ Mycobacterium avium 78 79 Clostridium difficile Treponema pallidum 80 81 82 in vitro in vitro 83 鍵 Treponema pallidum 84 Chlamydia trachomatis Mycoplasma
 Table 1 Method of administration Inactive placebo. Table 2 Critoria for overall ef4fficy rating by committee L Severity and scores of main symptoms 1) Acute tonsillitis (Peritonsillids, Peritonsillar abscess)
untitled
 CONTENTS 01 02-03 04-05 06-07 09 10 11 12 13 14 15 16 17 18 19 20 21 22 23 24 26 27 28 29 30 31 32 33 34 35 36 37 38 39 40 41 42 43 44 45 46 48-49 50-51 52 01 02 Mishima,Michiaki 03 04 05 06 07 09 10 11