第6章 ベネズエラの石油産業
|
|
|
- ゆうりゅう のたけ
- 5 years ago
- Views:
Transcription
1 % %
2 BCV, Información Estadística ( [sembrar el petróleo]) Karl[1997] Paradox of Plenty Corden[1984] PDVSA Petróleos de Venezuela, S.A.
3
4 IT ( API API
5
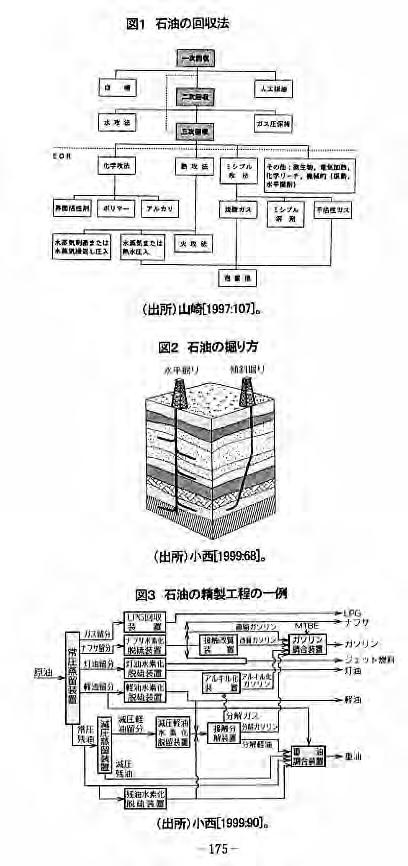
6 HP( WTI 2004 WTI 10 1)(exploration) 2)(development) 3)(production)
7 PDVSA PDVSA 100% Citgo
8 2005 PDVSA
9 EPC Schlemberger Halliburton
10
11 (Possible reserves) (Probable reserves) (Proven Recoverable) [1999:53-54] 1970 OPEC 73.9%(2004 ) 10 OECD 7% OPEC R/P ratio 40.5 OPEC 70 OECD
12 UAE (1)
13 ,803 55,824 57,468 68,008 80, ,219 7,216 3,601 9,032 10, n/a n/a 10,904 6,288 9, ,014 10,008 10,580 8,322 7, ,908 5,387 2,205 3,744 4, ,912 3,065 3, ,545 2,505 2,989 3, ,903 3, ,735 1,812 2,402 3, ,503 2,422 1,744 2,959 2, UAE* 282 1,696 1,260 2,410 2, ,785 1,499 1,998 2, ,371 2,132 1,127 2,130 2, ,675 2,749 2, ,313 2,271 1, , ,003 1,151 1,327 1, ,220 1,514 1,025 1,439 1, , n/a n/a , ,306 1,342 1,578 1, ,779 13,669 20,060 20,737 20, ,386 27,168 16,695 27,607 32, ,559 18,740 28,733 33,103 35,
14 30.6% 10 UAE % % % OPEC % OPEC % OECD 25.8% ,000 (2004 )
15 76,
16 7.8% 5.5% 20 75% 25% OPEC OPEC OPEC
17 OECD
18 OPEC OPEC OPEC (NYMEX) 2% WTI
19
20 [2001:49-51] WTI WTI EIA [ % % % %
21
22 0.26% API 1990 PDVSA ,000 20,000 6% OPEC 35.2% 97.6 OPEC
23
24 OPEC IOC: International Oil Companies (NOC: National Oil Companies) 70 OPEC % 12 OPEC 38.9% 51.8% OPEC, 12 Pemex Statoil
25
26 [2003:11-12] OPEC
27
28
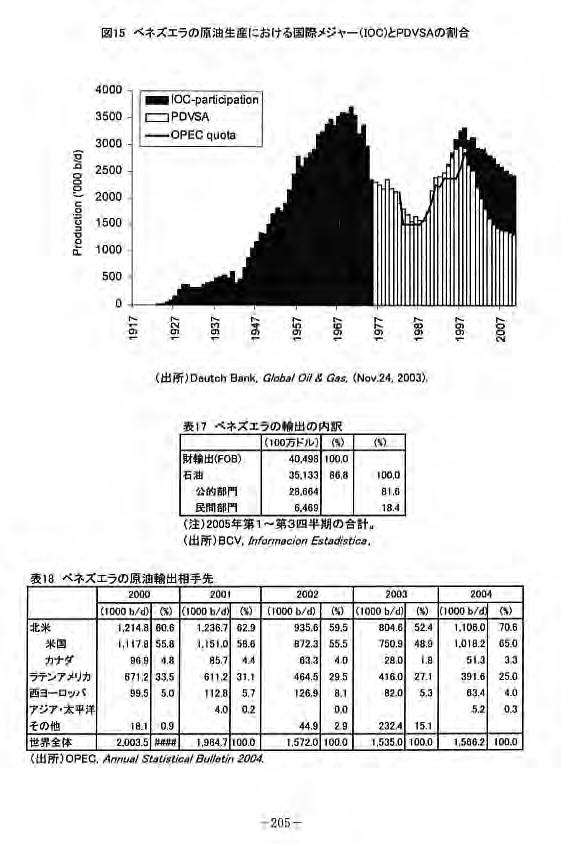
29 2005 PDVSA GDP 17.2% 84.9% 55.3% (BCV, Información Estadídstica) 772 BP PDVSA 300 IEA EIA 260
30 300 IEA EIA OPEC OPEC, OPEC Annual Statistical Bulletin 2004, Monthly Oil Market Report OPEC [ 260 BP 40 BP OPEC (2006 )
31
32
33
34 (IOC) PDVSA PDVSA PDVSA 90 PDVSA PDVSA 90 PDVSA % PDVSA PDVSA
35
36 18 65% 25% 55.8% 65.0% PDVSA PDVSA
37 PDVSA 1990 PDVSA PDVSA PDVSA PDVSA PDVSA PDVSA PDVSA PDVSA PDVSA PDVSA PDVSA PDVSA PDVSA Fondespa Fonden[ ] PDVSA % 30% 34% 50% 2005 PDVSA 90
38 2005 CNPC Petrocaribe,Petrosur 25% 12 Petrobras PDVSA 18
39 [2003] [1991] [1999] [2003] 21 Vol.51 No.2. [2003] Vol.51 No.2. [2003] [2001] : [1986] [2003] Vol.51 No.2. [1997] W.L Corden, W,M.[1984] Booming Sector and Dutch Disease Economics Oxford Economic Papers, November Vol.36 No.3, pp Deutsche Bank, Global Energy Wire, (Nov.24, 2003). Karl, Terry Lynn[1997]The Paradox of Plenty: Oil Booms and Petro-States, Berkeley: University of California Press.
40 Mommer, Bernardo [2004] The Value of Extra-Heavy Crude Oil from the Orinoco Belt, Middle East Economic Survey, Vol.47 No.22 (March 15), pp.d1-d11. JPI ( Banco Central de Venezuela, Información Estadística, ( British Petroleum, BP Statistical Review of World Energy ( Energy Information Administration, US Government (EIA), International Energy Annual ( IEA(International Energy Agency) World Energy Outlook ( Ministerio de Energía y Petroleo ( Ministerio de Energía y Minas) ( OPEC, OPEC Annual Statistical Bulletin ( OPEC, Monthly Oil Market Report ( PDVSA ( World Trade Atlas
41
56 14 PDVSA 2003 : 4 vs vs 1990PDVSA 1999 PDVSA OPEC OPEC OPEC BP
 PDVSA 2000 2008140 2008 70 10 2007 BP 2008 21 Petróleos de Venezuela, S.A. PDVSA PDVSA 2008 PDVSA 1990 1 1960 70 2001 Vol.25 No.2 55 56 14 PDVSA 2003 : 4 vs vs 1990PDVSA 1999 PDVSA OPEC 2006 2008 OPEC
571†i−â−Ô”††j
 Iwama Koichi 7336 OPEC 8685 7 86 3 87.5 83 3 8 7 6 5 4 3 8 8 8 6 7 8 8 86WTI 3 4 5 6 7 BP767 8 3 4 5 6 7 No. 578 5 7 BRICs 673 33 535 NYMEX WTIWTI 385.4% WTI83 6 WTI53 WTI8 WTI 7 78BNP No. 578 5 3 7 5
2 1 WTI p HP http : //
 2006 1 2 3 4 2006 5 1 3 1973 4 OPEC 80 1/4 2005 70 3 2006 2 1 WTI 2006 1 1 2007 8 31 2002 2 3 1 3 2006 2006 77.03 7 2007 1 49.9 1 2 3 2006 12 112 4 12 2007 2007 2 p. 8. 2007 1 13 HP http : //www.jri.co.jp/
topics_040
 / / SWF Sovereign Wealth Fund Ease of Doing Business 1.0 0.4 7.9 9.7 Bank of Canada [2015] Monetary Policy Report, January 2015. Bank of England [2015] Inflation Report, February 2015. BIS [2015]
Missing Barrels OIL MARKET INTELLIGENCE (OMI) , , , ,200 OECD ,900 OECD 10 3, , ,400 OECD
 , , , ,200 OECD ,900 OECD 10 3, , ,400 OECD") Missing Barrels 2 1990 OIL MARKET INTELLIGENCE (OMI) 2002 2 58 4,800 13 1,600 45 3,200 45 3,200 OECD29 25 9,900 OECD 10 3,400 7 4,400 1 100 5,400 OECD 10 3,400 2001 12 52.3 2002 1 2 52 5-1-1. 2002 2 13
Missing Barrels 2 1990 OIL MARKET INTELLIGENCE (OMI) 2002 2 58 4,800 13 1,600 45 3,200 45 3,200 OECD29 25 9,900 OECD 10 3,400 7 4,400 1 100 5,400 OECD 10 3,400 2001 12 52.3 2002 1 2 52 5-1-1. 2002 2 13
 ;;; ;;; ;; ;; ;; ;; ;; ;; ;; ;; ;;;; ;;;; ;;;; ;;;;; ;;;; ;;;; ;;;; The World Bank Annual Report World Development
伝統的な経済学では、「消費は重要ではあるが、気にしなくてもよい」と考えられてきた
 2005 1 2004 SARS 2003 IMF 2004 5.0 2004 4.1 0.9 30 2005 2004 2005 2005 2005 2004 2005 IMF 2005 4.3 2004 IMF 2004 2003 3.0 4.3 2003 2 2003 2004 IT 2005 IMF 2005 2004 3.5 IT 1995 10 2.8% 10 2 1 IT IT 2004
経済論集 47‐2(よこ)(P)☆/2.則長
(P)☆/2.則長") 1 1 2 3 2 1 2 3 4 3 1 2 3 4 1 NHK 2012 5 19 1 1 2 2012 9 8 1 8 15 19 20 2 2 1000 m BP Statistical Review of World Energy 2006 2 6000 1 96 1 2.6 80 3 1 World Energy Council, WEC Survey of Energy Resources
1 1 2 3 2 1 2 3 4 3 1 2 3 4 1 NHK 2012 5 19 1 1 2 2012 9 8 1 8 15 19 20 2 2 1000 m BP Statistical Review of World Energy 2006 2 6000 1 96 1 2.6 80 3 1 World Energy Council, WEC Survey of Energy Resources
Association of South East Asian Nations: ASEAN ASEAN ASEAN ASEAN ASEAN ASEAN ASEAN
 Association of South East Asian Nations: ASEAN ASEAN ASEAN ASEAN ASEAN ASEAN ASEAN ASEAN ASEAN ASEAN ASEAN ASEAN ASEAN ASEAN Free Trade Agreement: FTA FTA ASEAN ASEAN ASEAN ASEAN The European Union: EU
調査レポート
 1 27 6.3% FDI FDI 4 2.2 FDI 15% 1% 5% % -5% -1% -15% JBIC) 23 1 4 2.2 BRICs 2 1% 5% % -5% -1% -15% GDP 3 2 23 3 3% 28% 26% 24% 22% 2% 18% 16% IMF, International Financial Statistics 21 26 28 56 8/9 6 5
74-2 岩間
 128 74 2 21 3 128 134 Journal of the Japanese Association for Petroleum Technology Vol. 74, No. 2 March, 2009 pp. 128 134 Lecture * ** Received February 23, 2009 accepted February 26, 2009 The impact of
6, ,000km % 6.89% 1.64% 1.29% 0.68% 0.34% 8.12% Jacques CHIRAC Jean Pierre RAFFARIN Nicolas SARKOZY G
 6,181 2003 550,000km 2 1.5 81.4% 6.89% 1.64% 1.29% 0.68% 0.34% 8.12% Jacques CHIRAC1995 5 7 Jean Pierre RAFFARIN2002 5 Nicolas SARKOZY 2004 3 31 1 GDP 18,340 2003 1 GDP 30,475 2003 1 GDP 0.1 2003 2 GDP
untitled
 .. 1 2000 2010 +43%+16%+15%+13% +11% +10%+8% +1% +0.4% 100.0 80.0 60.0 % 40.0 20.0 80.3 9.0 70.3 9.1 67.9 9.9 85 9.8 150.0 100.0 50.0 119.1 10.7 92.4 9.6 73.5 8.0 60.7 9.5 100.0 80.0 60.0 40.0 20.0 54.0
情勢分析 米国メキシコ湾原油流出事故により一段と重要性を高める中東産原油
 BP BP BOP Blowout Preventer BOP BOP BP ROV Remotely Operated Vehicle BOP BP BP BP USGS Giant Oil Spill BP CEO BP CEO BP BP CEO BP ANWR Arctic National Wildlife Refuge b d LNG b d BP BP BP Shallow Water
89 El Gran Viraje V GDP a s s
 1999 90 20044.11 2002 11 12 2004 8 Misión 2005 2004 24 22 2005 PDVSA 2005 1 1992 Por Ahora Vol.22 No.2 33 89 El Gran Viraje 4.11 6 9 18 V 1999 2000 2001 2002 2003 2004 2005 GDP a -6.0 3.7 3.4-8.9-7.7 17.9
和RIM28_向山氏.indd
 9ASEAN 23 2615.314.7EU 12.3 27.1 223 2638.1 M&A45.3 2.6 CIS97.5 2 ASEAN 26 RIM 28 Vol.8 No.28 13 1 2 1 2 1 2 1 2 8 9 14 RIM 28 Vol.8 No.28 ASEAN 2 28 GDP 15 2 199798 5 5 15 1997 98 99 2 1 2 3 4 5 6 World
PeakOil.dvi
 2005 12 11 0. 1. 2. 3. 4. 5. 6. 7. 2004 11 4 1986 1990 5 1 2004 11 12 1992 30 30 20 1 2005 12 1 2005 7 23 29 28 13 MINGA 2005 8 2 1 4 60 2003 12 23 45 1 2005 11 3 2003 9 1 25 2005 8 11 60 8 29 70.85 2005


’M‰à„”Łñ2004-06PDFŠp
 Shinkin Central Bank Monthly Review 2004. 6 Shinkin Central B a n k Monthly Review 2004 6 2 23 46 63 73 75 2004 6 2 3 4 5 6 7 8 9 10 11 12 13 14 15 16 17 18 19 20 21 22 23 24 25 26 27 28 29 30 31 32 33


LNG The Potential of Natural Gas Natural Gas 1 CH4 C CO2 SOx 7 1 NOx NOx SOx CO IEA Mtoe 18, 12,73Mtoe 12, 21% 14,922Mtoe 22% 17,197Mtoe
 LNG 22 22LNG 211 11 14 16 18 22 25 3 Annual Report 213 13 LNG The Potential of Natural Gas Natural Gas 1 CH4 C CO2 SOx 7 1 NOx NOx 4 7 1 SOx CO2 6 8 1 IEA Mtoe 18, 12,73Mtoe 12, 21% 14,922Mtoe 22% 17,197Mtoe
和RIMNo.22高安氏.indd
 NIEsGDP 1990 200436.1 22.365.1 80 GDP 4 RIM 2006 Vol.6 No.22 RIM 2006 Vol.6 No.22 5 NIEs GDP GDP GDP GDP 90 GDP 1951 80 81 90 90 90 2001 2003 GDP 80 90 2001 2002 GDP 87GDP 80 GDP GDP 6 RIM 2006 Vol.6 No.22
2 100 BTU 2
 - - 2010 8 14 1 GDP GDP GDP GDP 960-1296 Tel/Fax:024-548-8439 E-mail:e059@ipc.fukushima-u.ac.jp 1 2 100 BTU 2 3 GDP GDP (Stern, 2000) GDP GDP (Cleveland et al., 2000) 4 80 1 10 1 3 (Smil, 2008) 5 IEA(
% GDP
 7 2030 1 2009 11 2030 2030 2 2008 2020 3 2 4 GDP 5 1 5 2015 GDP 6 9% 6 2000 2000 2010 2000 2000 2 10 96 2008 2020 40% 2009 7 8 2020 9 10 11 2020 GDP 2030 2010 3 2000 2 3 4 5 7. 2030 97 7.1 2000 7-1 2000
石油76-2 ブック
 138 76 2 23 3 138 145 Journal of the Japanese Association for Petroleum Technology Vol. 76, No. 2 March, 2011 pp. 138 145 Lecture * ** Received December 15, 2010 accepted January 12, 2011 Development of
第9章 香港
 1842 1997 1997 7 1 4 97 7 GDP 97 5.0% 98 5.1% 1999 98 1 GDP 99 2 5 1997 2 1999 2000 22 9 37 113 52 114 30 211 1,100 3 95% 2000 687 1996 60.3 32.6 95.2 38.1 1974 1993 25 8,000 24 9,180 214 331 757 757 1573
untitled
 NEDO 2001 17 (640 kl) 2006 49 (1,850 kl) 5 3 2012 75 (2,840 kl)eia Energy Information Administration 112 (4,240 kl) 1 1 EIA 1MTBE 2 3 Twenty in Ten 4 5EIA 2 6 1 EIA: Annual Energy Outlook 2007 16 F.O.Licht
Republic of Indonesia 2 1, ,992,570 km 2 (45% ) (14%) (7.5%) (7.5%) (26%) (88%) (6%) (3%) (2%) (2%) Megawati Sukarnoputri GDP
 (14%) (7.5%) (7.5%) (26%) (88%) (6%) (3%) (2%) (2%) Megawati Sukarnoputri GDP") Republic of Indonesia 2 1,480 2001 1,992,570 km 2 (45% ) (14%) (7.5%) (7.5%) (26%) (88%) (6%) (3%) (2%) (2%) Megawati Sukarnoputri 2001 7 GDP 2094 2000 1 GDP 995 2000 1 GDP 3.3% 2001 2 1 GDP GDP GDP 1998
Republic of Indonesia 2 1,480 2001 1,992,570 km 2 (45% ) (14%) (7.5%) (7.5%) (26%) (88%) (6%) (3%) (2%) (2%) Megawati Sukarnoputri 2001 7 GDP 2094 2000 1 GDP 995 2000 1 GDP 3.3% 2001 2 1 GDP GDP GDP 1998
調査レポート
 2011 8 19 2009 2011 2.4 108-8248 2-16-4 TEL03-6711-1250 12% 10% 8% 6% 4% 2% 0% -2% -4% -6% -8% -10% -12% 1/20 18% 16% 14% 12% 10% 8% 6% 4% 2% 0% -2% -4% -6% -8% -10% -12% -14% -16% -18% 2/20 35% 30% 25%
スリランカ経済の現状と今後の展望
 TEL 3-6733-17 E-mail chosa-report@murc.jp 1 / 21 216 9 6 29 TEL 3-6733-17 E-mail chosa-report@murc.jp 2 / 21 1, 2, 3, 4, 5, 6, IMF, World Economic Outlook Database, April 216 % 2% 4% 6% 8% 1% World Bank,
Œ{Ł¶.JBD
 Special Administrative Region SAR NIES GDP GDP Peg GDP GDP GDP Laissez faire Hong Kong Annual Digest of Statistics 1995 Hong Kong External Trade Positive Noninterventionism GDP GDP / GDP / / Trade Involving
’M‰à™ƒ‰à2003-06PDFŠp
 Shinkin Central Bank Monthly Review 2003. 6 hinkin Central Bank Monthly Review 20036 2 3 4 5 6 7 8 9 10 11 12 13 14 15 16 17 18 19 20 21 22 23 24 25 26 27 28 29 30 31 32 33 34 35 36 37 38 39 40 41 42
 The Institute for Economic Studies Seijo University 6 1 20, Seijo, Setagaya Tokyo 157-8511, Japan EPA NAFTA (PRI) (PAN) (PRD) (PVEM) (PT) (PAN) (PAN) (PRI) (PRD) (PVEM) (Convergencia) (PT) (Nueva Alianza)


野村資本市場研究所|アジアの金融競争力(PDF)
") 2013 Spring 1. GDP 3 26% 2. 3. 4. GDP 1 GDP 2000 25.4% 2012 10 IMF 1 GDP 28.7%GDP 10.7% 20.3% 2000 2012 10 2 3 2000 2012 4.2 5.4 2 2000 14% 2012 26% GDP 2012 30 10 32003 11 2013 Spring 100% 2 90% 80% 70%
2013 Spring 1. GDP 3 26% 2. 3. 4. GDP 1 GDP 2000 25.4% 2012 10 IMF 1 GDP 28.7%GDP 10.7% 20.3% 2000 2012 10 2 3 2000 2012 4.2 5.4 2 2000 14% 2012 26% GDP 2012 30 10 32003 11 2013 Spring 100% 2 90% 80% 70%

6 1 20053 1 21 3 1 1
 6 1 20053 1 21 3 1 1 2 20 20003 4665 3000523 311 291 19 6 MONTHLY REPORT 276 3 338 307 410 458 385 436 2 321 4 652010 4302020537 652010 5092020585 5 MONTHLY REPORT 6 3 1989 60 20 1999 98533843 8 MONTHLY
平井HP原稿.doc
 IEEJ:2007 3 1 1.1 1982 3 1 2 1992 1995 1995 1996 (ILS) ( )IMF 2000 20 20 17. (2006 6 )4 1 2006 6 1 IEEJ:2007 3 1960 1970 1989 1971 2003 ( )1 GDP 1-1 1977 9,300 1989 4 3,800 1995 5,800 1970 1970 3 1988
アジアの資本移動の変化に関するクラスター分析 アジア域内の証券投資活性化に向けて
 * ** 199 1 1996-97 relation * ** Seoul conference China and Emerging Asia: Reorganizing the Global Economy? held by KIEP and Seoul National University 26 5 11-12 Hugh Patrick Yung-Chul Park 26 9 9-1 East
調査レポート
 BRICs 2005 EU 1970 2001 2001 IMF 2002 2001 2003 2007 7 2008 10-12 2009 1-3 14.3 2009 1-3 EU EU EU EU EU 2010 EU EU BRICs 2 0 20 40 60 80 0 5,000 10,000 15,000 20,000 World Development Report 2009 2005
スライド 1
 World Energy Outlook 2004 1 VLCC: very large crude oil career 2 ( )- (100t) 2015 () 19952003 Clarkson 2004 2015 15 44 43 66 28 18 230 34 11 32 24 37 40 27 94 14 1 4 3 4 4 3 60 9 DOE EIA IEA 3 ( ) - One
GDPギャップと潜在成長率
 2003 output gap 80 1 20 90 20 70 2 1 2 output gap potential output 1 2 (2001) 3 potential rate of growth 2000 Meyer (2000) European Central Bank: (1999b) 2002 10 4 3 (2000) 4 4 () 5 5 5 6 () () 7 Total
第2章 経済成長と所得分配: マレーシアの事例を中心に
 2006 1970 1990 U 1 GDP GDP GDP 1970 1 1969 5 13 5 13 New Economic Policy: NEP NEP 2 NEP 1971 1990 National Development Policy: NDP 1991 2000 Vision Development Policy: VDP 2001 2010 NEP NEP 1990 1980 1
 æ 1 2 3 rentier state s rent æ æ 1 Zanoyan 2 Gambill æ 3 æ 1987 Luciani Beblawi The Rentier State 4 Luciani Beblawi Luciani 40 æ World Development Indicators 10 1 UNDP 10 / æ æ No.37 2004 19 æ Sadowski
- March SCB -, -, -, -, -, -, -, -, -, -,,,,,, -, -, -, -,, -,,,, -,,,,,, - -,, -,, Survey of Current Business, July, Table (p. ), Oct, Table (p. ) S.
, Oct, Table (p. ) S.") - March SCB -, -, -, -, -, -, -, -, -, -,,,,,, -, -, -, -,, -,,,, -,,,,,, - -,, -,, Survey of Current Business, July, Table (p. ), Oct, Table (p. ) S.C.B. July, Table SCB, -, - - -, -, - -,,,, - Ibid.,
- March SCB -, -, -, -, -, -, -, -, -, -,,,,,, -, -, -, -,, -,,,, -,,,,,, - -,, -,, Survey of Current Business, July, Table (p. ), Oct, Table (p. ) S.C.B. July, Table SCB, -, - - -, -, - -,,,, - Ibid.,
untitled
 2009 4 GCC 2000 2000 2006 GDP 65 60 70 78 82 115 2008 1970 2000 1 2 3 4 1 1. UAE UAE 7 [2003] UAE 1985 2000 UAE GDP GDP 2000 76.1 2006 62.7 1980 2000 2004 1 UAE 2000 15.5 2006 12.3 GDP 2000 2001 2002 2003
18年度石見美術館年報最終.indd
 A Annual Report Annual Report B 1 Annual Report Annual Report 2 3 Annual Report Annual Report 4 Annual Report 5 Annual Report 6 7 Annual Report Annual Report 8 9 Annual Report Annual Report 10 11 Annual
C O N T E N T S 1. 2. 3. 4. 5. 6. 7. 8. 9. 10. 11. 12. 13. 14. 15. 16. 17. 18. 2009 Annual Report
 C O N T E N T S 1. 2. 3. 4. 5. 6. 7. 8. 9. 10. 11. 12. 13. 14. 15. 16. 17. 18. 2009 Annual Report 1 1 2009 Annual Report 1. 2. 2 2 2009 Annual Report 3 3 2009 Annual Report 3. 1980 1991 1992 1993 1994

IEEJ: m m3 2.1 m3 0.4 m3 8.4 m3 1.2 m3 2.9 m3 7.4 m3 4.2 m3 0.3 m3 2.5 m3 1.6 m3 2.2 m3 6.6 m ,727 m3 9,477 m3 2 7,204 m3
 IEEJ:2004 8 90 1990 3 EOR 1 BP 2002 25 1.7 R/P 14.8 2 10 3 140 1999 4205.6 EOR 5 1 IEEJ:2004 8 6 7 40.6 m3 8 0.9 m3 2.1 m3 0.4 m3 8.4 m3 1.2 m3 2.9 m3 7.4 m3 4.2 m3 0.3 m3 2.5 m3 1.6 m3 2.2 m3 6.6 m3 9
7 4 ( Council of Guardians ) Islamic Consultative Assembly - Majlis ( Expediency Council ) ( Foreign Investment Promotion & Protection Act ) 2 4 62 63
 Islamic Consultative Assembly - Majlis ( Expediency Council ) ( Foreign Investment Promotion & Protection Act ) 2 4 62 63") 7 1979 2 / 1925 54 1979 4 ( Islamic Republic of Iran 1 / 2 2 1,322 3 2 1960 1970 UAE 1 1 2 5 http://www.salamiran.org/iraninfo/state/constitution/ 2 ( Persian Gulf ) ( Arabian Gulf ) 3 2004 7 3 = () 2004
7 1979 2 / 1925 54 1979 4 ( Islamic Republic of Iran 1 / 2 2 1,322 3 2 1960 1970 UAE 1 1 2 5 http://www.salamiran.org/iraninfo/state/constitution/ 2 ( Persian Gulf ) ( Arabian Gulf ) 3 2004 7 3 = () 2004
2010年における原油価格の見通しについて
 NYMEXNew York Mercantile ExchangeLight Sweet Crude Oil 1 1,000 Cushing WTIWest Texas IntermediateWTI NYMEX Light Sweet Crude Oil NYMEX WTI NYMEX WTI 1990 40 1998 10 2000 35 2001 9 20 2002 2004 10 27 55.65
-February FRB BIS IMF BIS Spillover Spillovers BIS IMF EMEs
 BIS FRB BIS BIS FRB QE QE -February FRB BIS IMF BIS Spillover Spillovers BIS IMF EMEs GDP GDP........ GDP BIS, 83rd Annual Report, June 2013, p.14 Ibid., p.14. -February 1 1 2009 2013 2) 2009 2013 2) -7.6-4.0
GNI GDP % % K % 3 NIES ,
 Onozawa Jun 1 GNI 1 2013 1 60 1 2 middle-income trap1 ADB 14 3 1996 1998 2003 5 10 2004 198010 9% 2000 4 5% ADB 4 2010NEM: New Economic Model 5 2015 6 6 2020 2020 2020 2000 No. 633 2014 7 8 16 1 2013 1

90 90 GDP 4.0% %
 1990 1990 1 19902004 34% 1990 92ECLAC 100 8,000 7,000 6,000 5,000 4,000 3,000 2,000 1,000 0 World Bank EdStats,World Bank Lending for Education New Commitments by Sector and Region http://devdata.worldbank.org/edstats/wbl_a.asp
TheRecord.indd
 July 2015 The Record vol.668 Contents 5/19 6/4 6/5 THE RECORD 2015-07 2 focus 3 THE RECORD 2015 06 THE RECORD 2015 06 4 focus 5 THE RECORD 2015 07 6 THE RECORD 2015 07 01 02 03 7 THE RECORD 2015 07 04
Benson and Clay Before/After WTO World Development IndicatorsGDP GDP % % GDP % GDP % % % % EACEast African Community
 Department of State Khost KhartoumDepartment of State Harman Benson and Clay Before/After WTO World Development IndicatorsGDP GDP % % GDP % GDP % % % % EACEast African Community Watanabe GDP % % GDP /
TheRecord.indd
 October 2015 The Record vol.671 Contents 8/2024 8/2627 THE RECORD 2015-10 2 3 THE RECORD 2015 10 focus 600 500 400 300 200 100 0 2005 2006 2007 2008 2009 2010 2011 2012 2013 2014 4,000 40% 3,500 33.4%
0406_TheRecord_605_戻.qxp
 2010 04 Vol.605 Contents 3/01 3/02 3/03 3/04 THE RECORD 2010 04 2 focus 3 THE RECORD 2010 04 THE RECORD 2010 04 4 focus 5 THE RECORD 2010 04 THE RECORD 2010 04 6 7 THE RECORD 2010 04 8 THE RECORD 2010
 Paper A Forecast of World Primary Energy Ichizo Aoki Greenwood Office E-mail:iaoki@gakushikai.jp Abstract Up to industrial revolution, we had used renewable energy such as wood for our daily use. Start
6/9-98-資生堂-前半AR-6.5pm
 1998 1998 3 1998 1997 1996 620,910 39,278 16,868 588,572 42,898 19,152 560,821 37,012 17,507 1998 4,776,231 302,139 129,754 457,333 99,310 64,267 436,705 94,610 57,257 404,181 101,675 54,965 3,517,946
5 5 (%) 9. 3 5 3 8. 7. 5. 5.. 5 5 5 3 8 5 3.9 3.. 1/3 1/9 /3 /9 3/3 3/9 /3 /9 5/3
 9. 3 5 3 8. 7. 5. 5.. 5 5 5 3 8 5 3.9 3.. 1/3 1/9 /3 /9 3/3 3/9 /3 /9 5/3") I *1 *1 ( ) ( ) ( ) ( ) ( ) ( ) ( ) ( ) * ( ) ( ) ( ) ( ) ( ) ( ) (JCR) G7 *1) *) (1) JCR AAA ( ) 1 () 5 - IT 1 5 5 (%) 9. 3 5 3 8. 7. 5. 5.. 5 5 5 3 8 5 3.9 3.. 1/3 1/9 /3 /9 3/3 3/9 /3 /9 5/3 1 (%).
I *1 *1 ( ) ( ) ( ) ( ) ( ) ( ) ( ) ( ) * ( ) ( ) ( ) ( ) ( ) ( ) (JCR) G7 *1) *) (1) JCR AAA ( ) 1 () 5 - IT 1 5 5 (%) 9. 3 5 3 8. 7. 5. 5.. 5 5 5 3 8 5 3.9 3.. 1/3 1/9 /3 /9 3/3 3/9 /3 /9 5/3 1 (%).
 1 2...5...6...7...7...7...8...8...8...9...10...10... 11... 11... 11... 11... 11...13...13...14...14...15...15...16...16...18...18...19...20...20...20...20...21...21...22...22 3...23...23...23...24...24...24...24...25...25...25...26...26...26...26...26...27...27...27...27...28...28...28...29...30
TheRecordx.indd
 March 2015 Contents 2/2-13 2/12 THE RECORD 2015-03 2 focus 3 THE RECORD 2015 03 THE RECORD 2015 03 4 focus 5 THE RECORD 2015 03 THE RECORD 2015 03 6 01 02 03 04 05 06 07 08 7 THE RECORD 2015 03 09 10 11
長岡慎介 45‐78/45‐78
 HSBC http://news.bbc.co.uk/2/hi/business/5074068.stm HSBC HSBC Amanah Saadiq [CIBAFI 2005: 10; CIBAFI, 2009: 4; TheCityUK, 2013: 4; IFSB, 2013: 10; IFSB, 2014: 12] [TheCityUK 2013: 1] [UK Trade & Investment
- March IMF IMF IMF ITO The General Agreement on Tariffs and Trade
 M&A IMF IMF gold tranche - March IMF IMF IMF ITO The General Agreement on Tariffs and Trade IMF IMF IMF GATT OECD OECD BITs. - March. U I = I (r m, i, Z * r m i Z * (= Z / Z) I / r m > I / i < I / Z *
野村資本市場研究所|日本の高度経済成長を支えた財政投融資の意義と教訓-アジアで応用する場合のヒント-(PDF)
") 2013 Summer 1. 2. 3. 4. 1 2013 Summer 1 2 2 1 2010 2020 11 8 2 7,260 300 2007 7,000 3 1 25.0% 20.0% 15.0% 10.0% 5.0% 0.0% -5.0% -10.0% 1953 1965 1980 1995 2004 2007 2010 100 90 80 70 60 50 40 30 20 10
2013 Summer 1. 2. 3. 4. 1 2013 Summer 1 2 2 1 2010 2020 11 8 2 7,260 300 2007 7,000 3 1 25.0% 20.0% 15.0% 10.0% 5.0% 0.0% -5.0% -10.0% 1953 1965 1980 1995 2004 2007 2010 100 90 80 70 60 50 40 30 20 10
\\ \Data_in4\TeX\OR\63-7\07\or63_7_401.dvi
 c CO 2 2 CO 2 CO 2 CO 2 IPCC 1. CO 2 2015 400 ppm CO 2 CO 2 2 2.5 16.2 8.2 [1] CO 2 305 0005 1 1 1 3F 1134 mamoru@sk.tsukuba.ac.jp 206 000 626 2 2 507 brother.hide10@gmail.com 305 005 1 1 1 IIIS 4F kojima.kazunori.ga@un.tsukuba.ac.jp

untitled
 2 19 1960 1980 1990 6 1 6 144 6-36 - Firth [2007: 111-112], [2008: 162] 19 19 20 1960 1980 1 1-37 - 2 1978 1990 34.5 1994 56 1994 31 Kabutaulaka [2006b: 247] 1960 3 1960 1980 26 Dauvergne [2001: 23] 1990
高齢化による影響と波及効果
 1 1. 2000 65 7.2 1 2018 14.3 8 2026 1955 1963 20.8 2050 38.2 < 1-1> 65 65 : Korean Statistical Information System(KOSIS) database (0 14 )1960 42.3 2000 21.1 40 2020 12.42050 8.9 (15 64 ) 1960 54.8 2000
292 Vol. 44 No refundable tax credit Mirrlees 1971 Friedman
 Winter 08 291 I はじめに Shinozaki 2005 2006 OECD United Nations 2007 OECD 2008 2 1 2006 2005 2 2006 refundable tax credit 2006 292 Vol. 44 No. 3 3 1 2 refundable tax credit 3 10 5 5 10 5 2 1 Mirrlees 1971
#10094931_信金7月号.indb
 2006. 7 2006 7 2 4 24 41 58 84 85 97 99 2006 7 2 3 4 5 6 7 8 9 10 11 12 13 14 15 16 17 18 19 20 21 22 23 24 25 26 27 28 29 30 31 32 33 34 35 36 37 38 39 40 41 42 43 44 45 46 47 48 49 50 51 52 53 54 55
2 Saddam Hussain 3 4 2002 75-76% 56% 20% 3 1993 4 2003 13 2
 W 2003 5 11 5 23 1 5 9 5 22 2 2001 9 11 1 2003 5 2 12 24 2 1483 1 2 Saddam Hussain 3 4 2002 75-76% 56% 20% 3 1993 http://www.jetro.org.tr/middleeast/special/riyadh_arabjinmei.html 4 2003 13 2 5 6 ( Iraqi
国際流動性に関する財政的側面について
 IMF SDR IMF 2011 6 1 2 2011 E-mail: obstfeld@econ.berkeley.edu / /2011.10 35 1. 2007 2009 2 Goodhart [1999] 2010 11 2. 4 1970 IMF 1960 36 /2011.10 international reserve 1 D 35 1 D 35 1960 Eichengreen [2011]
! Topics ,250 2, ,000 2, % 6 7 2
 30 4 3March 2018 VOl.39 No.3 TOKYO2018 ! Topics 2018.3 2 1,250 2,000 3 2.84.8 5.6 9.6 30 4 30 4 1 30 1 1,000 2,000 6 4 5 5 100 30 3 31 100 5 100% 6 7 2 8 9 10 2 8,000 4 8,000 2 8,000 2 8,000 3,000 10 10
2 2 3 4 5 5 6 10 14 17 18 18 20
 1. 1990 2001 38 02 2. 90 3. 00 3 4. 02 5.5 3.6 2 5. 02 03 GDP 0 2 2 3 4 5 5 6 10 14 17 18 18 20 1930 50 81090 10 2001 38 2.2 2.301 7 02 3.603 5 3.5 FRB03 2 11 BS BS BS 90 1 Personal Income and Its Disposition
untitled
 [ 研究ノート ] 4% 19 19 20 1997a 20 Mitchell, 2002: 123 208 1997b; 2008 2 1960 1980 Abdel-Fadil, 1975; Hansen, 1969; Radwan & Lee, 1986 Abdel-Fadil, 1980; 85 Assaad, 1997 2 Hopkins Hopkins & Westergaard, 1998:
Jeffrey Sachs Chang(1998) Steven Radelet and Jeffrey Sachs (1998) 1999 IMF 1999 World Bank 1998 [ 1998 ] 2000 p [ 20
![Jeffrey Sachs Chang(1998) Steven Radelet and Jeffrey Sachs (1998) 1999 IMF 1999 World Bank 1998 [ 1998 ] 2000 p [ 20](/thumbs/88/117909888.jpg "Jeffrey Sachs Chang(1998) Steven Radelet and Jeffrey Sachs (1998) 1999 IMF 1999 World Bank 1998 [ 1998 ] 2000 p [ 20") 62 1997 1996 1 1 2 1 Jeffrey Sachs1997 2 Chang(1998)Steven Radelet and Jeffrey Sachs (1998) 1999 IMF 1999 World Bank1998 [ 1998 ] 2000p.9196 [ 2003] 21 [ 2002 2000] [ 1998 1999 ] 1 62 21 3 4 5 6 90 7 3
62 1997 1996 1 1 2 1 Jeffrey Sachs1997 2 Chang(1998)Steven Radelet and Jeffrey Sachs (1998) 1999 IMF 1999 World Bank1998 [ 1998 ] 2000p.9196 [ 2003] 21 [ 2002 2000] [ 1998 1999 ] 1 62 21 3 4 5 6 90 7 3
2019 VOl.40 No.3 3March TOKYO GUARANTEE PASSPORT!
 2019 VOl.40 No.3 3March TOKYO GUARANTEE PASSPORT! ! Q&A Topics 2019.3 Q.1 A.1 2 Q.2 A.2 1 3 1 2 3 5 3 3 5 5 20 20 15 2.0 1.5 1.5 1 10 10 5 2.0 1.5 1.0 1 2 Q.3 A.3 100km Q.4 A.4 Q.5 A.5 1 Q&A 3 ! OCR! 281!
Psacharopulos Psacharopulos and Patrinos (1) Byron and Takahashi McMahon and Boediono Duflo (2)
 Byron and Takahashi McMahon and Boediono Duflo (2)") Psacharopulos Psacharopulos and Patrinos (1) Byron and Takahashi McMahon and Boediono Duflo (2) (3) Survei Sosial Economi NasionalNational Socio-economic Survey SUSENAS KorModul (4) SUSENAS (5) (6) t
Psacharopulos Psacharopulos and Patrinos (1) Byron and Takahashi McMahon and Boediono Duflo (2) (3) Survei Sosial Economi NasionalNational Socio-economic Survey SUSENAS KorModul (4) SUSENAS (5) (6) t
FDI2 22 BRICs 22 ODA 22 PF SSA FDI International Finance Corporation 29
 1 21 198 1 1 OECD/DAC 22 28 27 29 ODA Remittance 12 1 1 199 25 FDI2 22 BRICs 22 ODA 22 PF 1 1 1 2 23 SSA 23 1 3 1 4 1 5 21 24 25 FDI 1999 22 1 6 25 27 25 International Finance Corporation 29 13 23 23 1
untitled
 S C B SHINKIN CENTRAL BANK 103-0028 1-3-7 TEL.03-5202-7671 FAX.03-3278-7048 URL http://www.scbri.jp 20 1015 GDP 80 S&L OFHEOHPI 2007 79 0.4 1994 13 1975 2007 912 1995 1-3 100 OFHEO 1980 2000 GDP ( 5.9)
 IMES DISCUSSION PAPER SERIES Discussion Paper No. 99-J-17 INSTITUTE FOR MONETARY AND ECONOMIC STUDIES BANK OF JAPAN 100-8630 203 IMES Discussion Paper Series 99-J-17 1999 6 * JEL classification E52 E58
,255 7, ,355 4,452 3,420 3,736 8,206 4, , ,992 6, ,646 4,
 30 8 IT 28 1,260 3 1 11. 1101. 1102. 1103. 1 3 1,368.3 3 1,109.8 p.5,p.7 2 9,646 4,291 14.5% 10,p.11 3 3,521 8 p.13 45-49 40-44 50-54 019 5 3 1 2,891 3 6 1 3 95 1 1101 1102 1103 1101 1102 1103 1 6,255
 Title Author(s) Kobe University Repository : Kernel 世界の雑貨卸売市場 : 中国義烏市の発展のメカニズム (The World Goods Wholesale Market : The Growing Mechanism of Yi-Wu City in China) 伊藤, 宗彦 / 浜口, 伸明 Citation 国民経済雑誌,204(5):15-30

表紙_目次.PDF
 JIL 2 1980 vol.3 15 3 1 3 15 18 IT 26 28 33 20 OECD 80 90 (1998) (2000) 2 Aghion et al. (1999) OECD 1970 1 2 70 1980 90 1.1 Kuznets U inverted U-shaped hypothesis GNP U 1 18901940 6 3 Kuznets(1955) (1963)
Perusahaan Pertambangan Minyak dan Gas Bumi Negara: Pertamina Susilo Bambang Yudhoyono 171
 2001 2003 30 Perusahaan Pertambangan Minyak dan Gas Bumi Negara: Pertamina 200410 2004 200410Susilo Bambang Yudhoyono 171 2005 2005 11 2001 Organization of the Petroleum Exporting Countries: OPEC 2003BP
「LNGスポット市場形成に関する調査」
 * LNG LNG LNG 3 LNG LNG LNG LNG LNG LNG LNG LNG 1. LNG (1) 178 m 3 2002 1, CEDIGAZ 7 46 m 3 26 27 m 3 15 26 m 3 14 3 55 2.55 m 3 2001, CEDIGAZ 23% 22% 7% 4% 3% 6,560 m 3 * 14 LNG 1 LNG 1. LNG 2. LNG 3.
高齢化とマクロ投資比率―国際パネルデータを用いた分析―
 196 2017 * ** ** ** ** 160 2 2 JEL Classification Codes E21, E22, J11 Keywords * ESRI 28 ESRI 29 3 17 ESRI ** 115 196 Population Aging and Domestic Investment An Analysis Using International Panel Data

28 GCC UAE GCC (2) 大きく上昇した食料価格と住居費 GCC GCC GCC 図表 2 湾岸協力会議 (GCC) 諸国の消費者物価上昇率 (28 年 ) 図表 3 湾岸協力会議 (GCC) 諸国の消費者物価指数に占める食料品と住居費の割合
 大きく上昇した食料価格と住居費 GCC GCC GCC 図表 2 湾岸協力会議 (GCC) 諸国の消費者物価上昇率 (28 年 ) 図表 3 湾岸協力会議 (GCC) 諸国の消費者物価指数に占める食料品と住居費の割合") アジアの視点 インフレ圧力の高まりに苦慮する湾岸協力会議 (GCC) 諸国 調査部環太平洋戦略研究センター 上席主任研究員 高安健一 はじめに Gulf Cooperation Council: GCC 28 GCC GCC 27 6.1 UAE 11.13.8 GCC 1. インフレ高進の背景 (1) 高インフレ地域に転じたGCC 19922 GCC GCC98 22.1 図表 1 湾岸協力会議
アジアの視点 インフレ圧力の高まりに苦慮する湾岸協力会議 (GCC) 諸国 調査部環太平洋戦略研究センター 上席主任研究員 高安健一 はじめに Gulf Cooperation Council: GCC 28 GCC GCC 27 6.1 UAE 11.13.8 GCC 1. インフレ高進の背景 (1) 高インフレ地域に転じたGCC 19922 GCC GCC98 22.1 図表 1 湾岸協力会議
[1964] [1957] Core Peripheral 7 Mangan,John[2000] [1999] [1999]pp7-8 5 [1964]p89 6 Doeringer and
![[1964] [1957] Core Peripheral 7 Mangan,John[2000] [1999] [1999]pp7-8 5 [1964]p89 6 Doeringer and](/thumbs/88/115073126.jpg "[1964] [1957] Core Peripheral 7 Mangan,John[2000] [1999] [1999]pp7-8 5 [1964]p89 6 Doeringer and") 1 2 2 1 Cappelli,Peter[1999] 20 3 1 [1999] 20 1928 1935 1 1965 2003 2 [1998] 3 Cappelli, Peter [1999]p4-1 - 1945 1973 1960 4 [1964] 2 5 1948 [1957] 1960 6 Core Peripheral 7 Mangan,John[2000] 1970 1980
1 2 2 1 Cappelli,Peter[1999] 20 3 1 [1999] 20 1928 1935 1 1965 2003 2 [1998] 3 Cappelli, Peter [1999]p4-1 - 1945 1973 1960 4 [1964] 2 5 1948 [1957] 1960 6 Core Peripheral 7 Mangan,John[2000] 1970 1980
科学雑誌金田古田
 4 1 2 petroleum 87.3 99.6 94.5 85.9 83.1 97.4 99.6 98.3 81.8 100.0 99.7 96.0 65.5 31.8 97.1 83.8 56.6 97.4 98.9 83.8 34.1 3.5 69.0 19.2 38.4 70.3 48.8 14.5 16.9 26.9 29.1 4.8 10.0 1.3 48.1 0.0 1.8 8.2
第3章 日本の対タンザニア援助の評価
 46,500 km 2 1.1 67 2 60 20 150 105 10 35 1972 4 3 1998 1 2001 2005 3 9 20 12 100 2008 2006 12 2008 2005 11 Good Governance Plus 20 Dzongkhag201 Gewog1981 DYT1991 GYT2002 6 DYTGYT 10 Gup DYT DYT 2-1 2 50